29 March 2024 | Author: Chip Taylor
Introduction
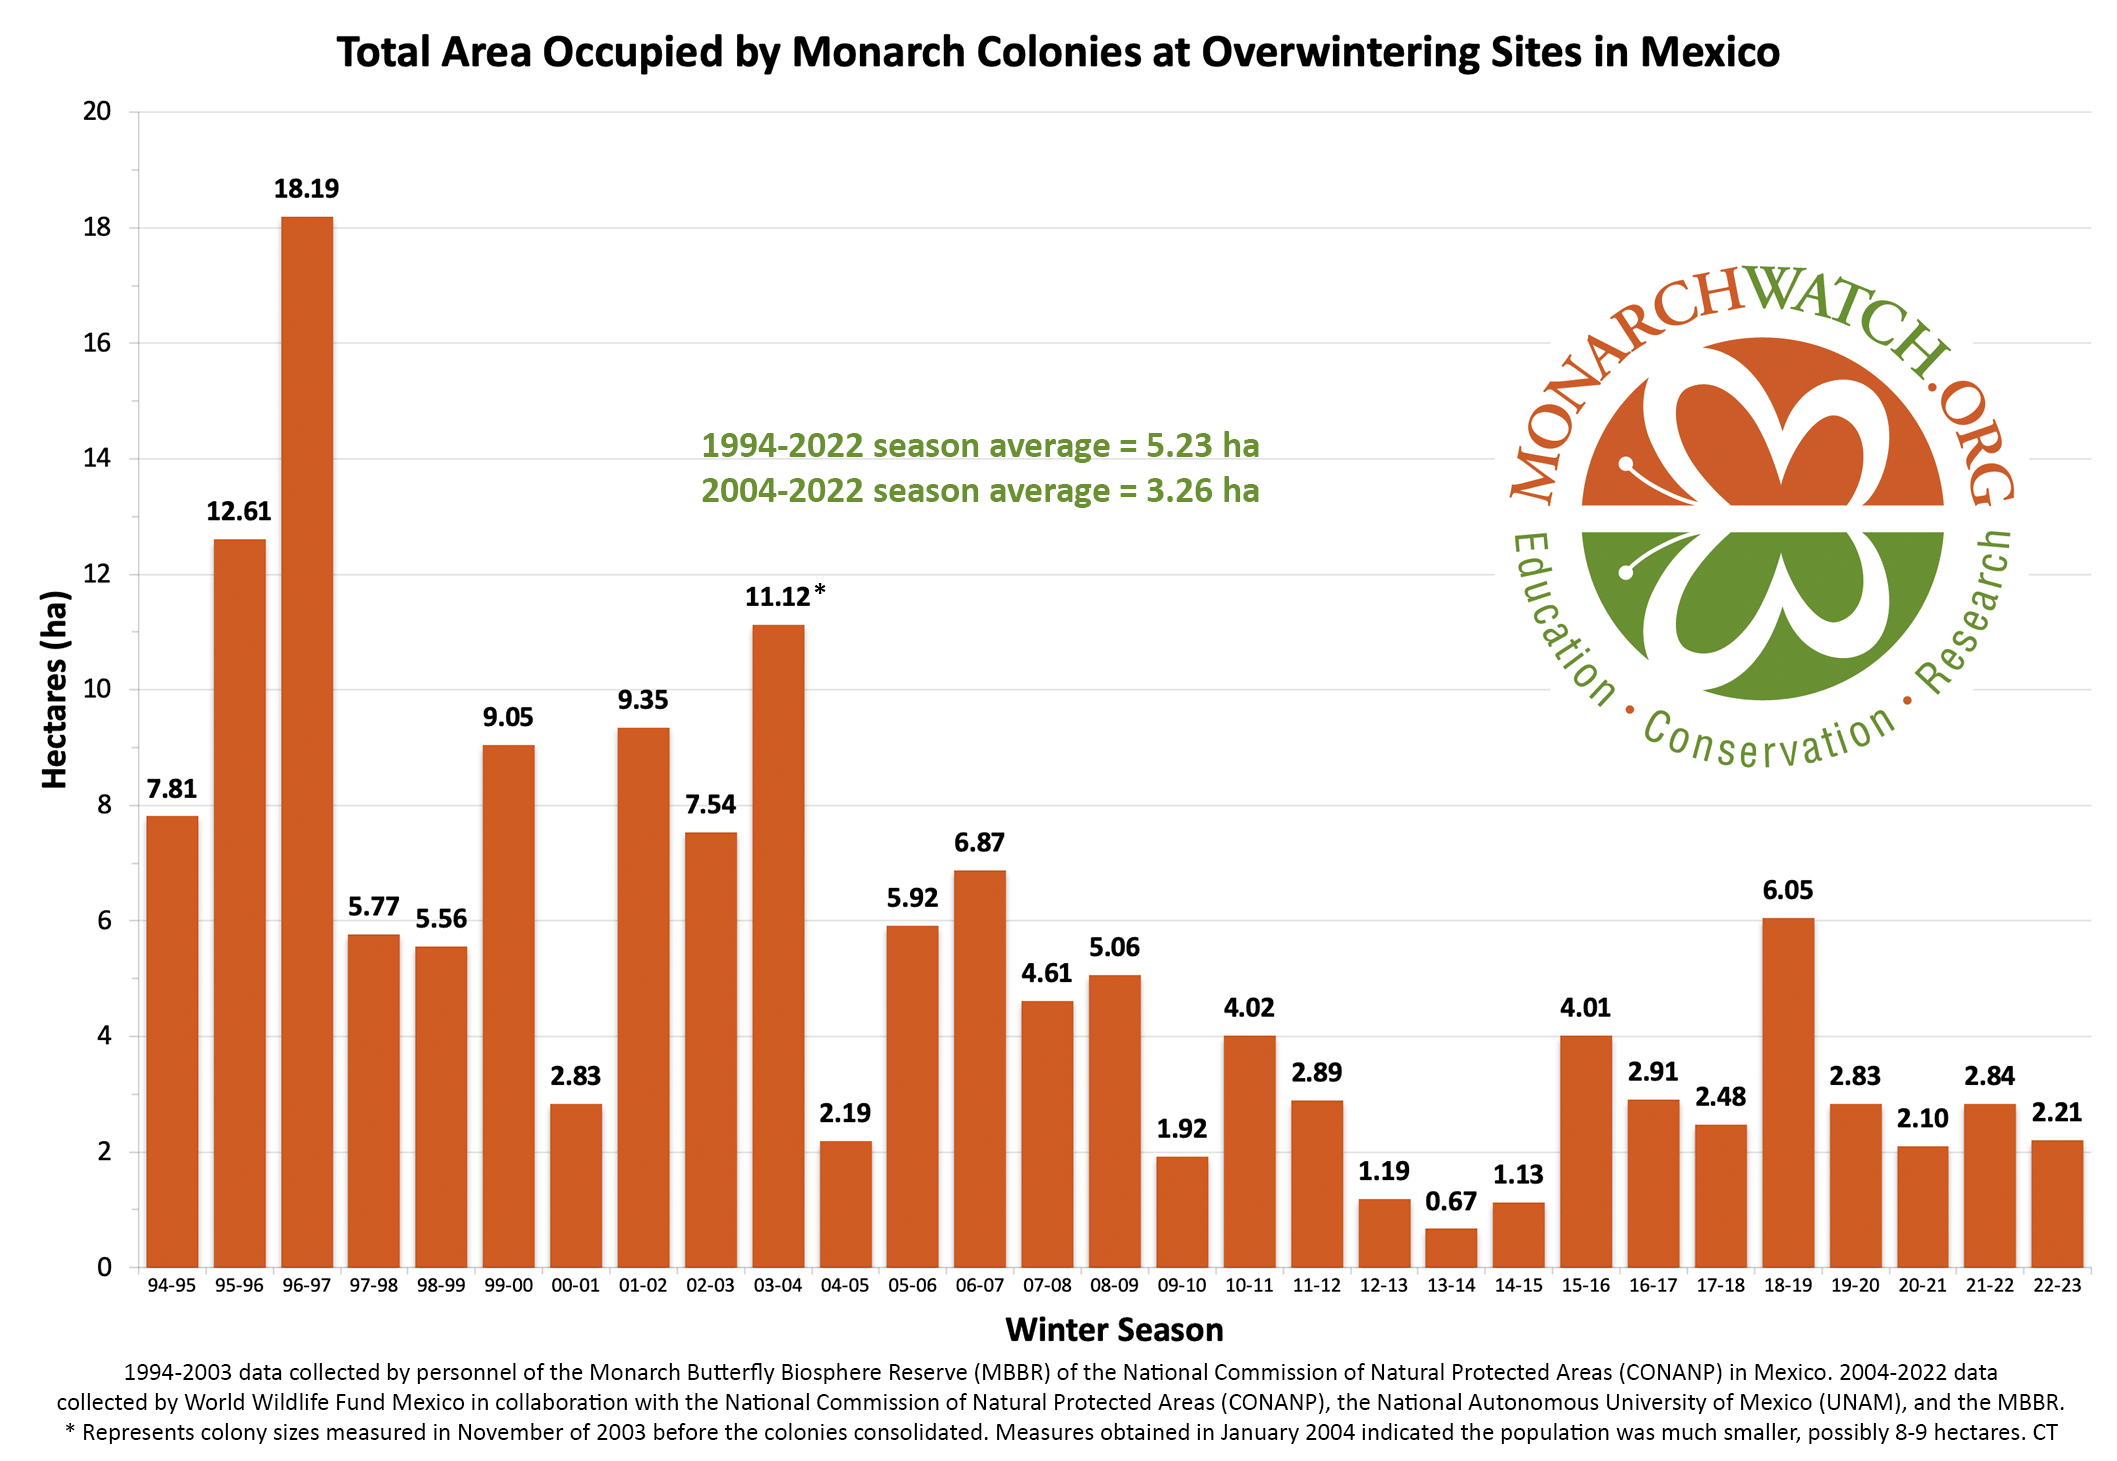
The question posed in the title is important. Evidence of a continuous decline could lead to regulations and restrictions in accordance with the Endangered Species Act (ESA) while evidence of stable numbers would indicate that regulations are unwarranted. In fact, monarch numbers did decline substantially from overwintering hectares in the double digits in 1995-1996 to the all-time low of 0.67 hectares in 2013 (Figure1). The question at this time however is whether the population is continuing to decline. The 2013 low led to a petition to the Department of Interior to declare the monarch endangered. In 2020, after delays and a lengthy Species Status Assessment (SSA), the Fish and Wildlife Service (FWS) declared the monarch to be threatened. However, actions and regulations were precluded based on current numbers and the needs of other endangered species. Subsequently, the threatened status in the United States, and the apparent assumption that the decline recorded 1995-1996 to 2013 was ongoing, led the IUCN to declare the monarch endangered in 2022. However, in 2023, the ICUN downgraded the monarch status from endangered to vulnerable, as the result of an analysis by Meehan and Crossley (2023) that clearly indicated the population had not declined measurably in the last 10 years.
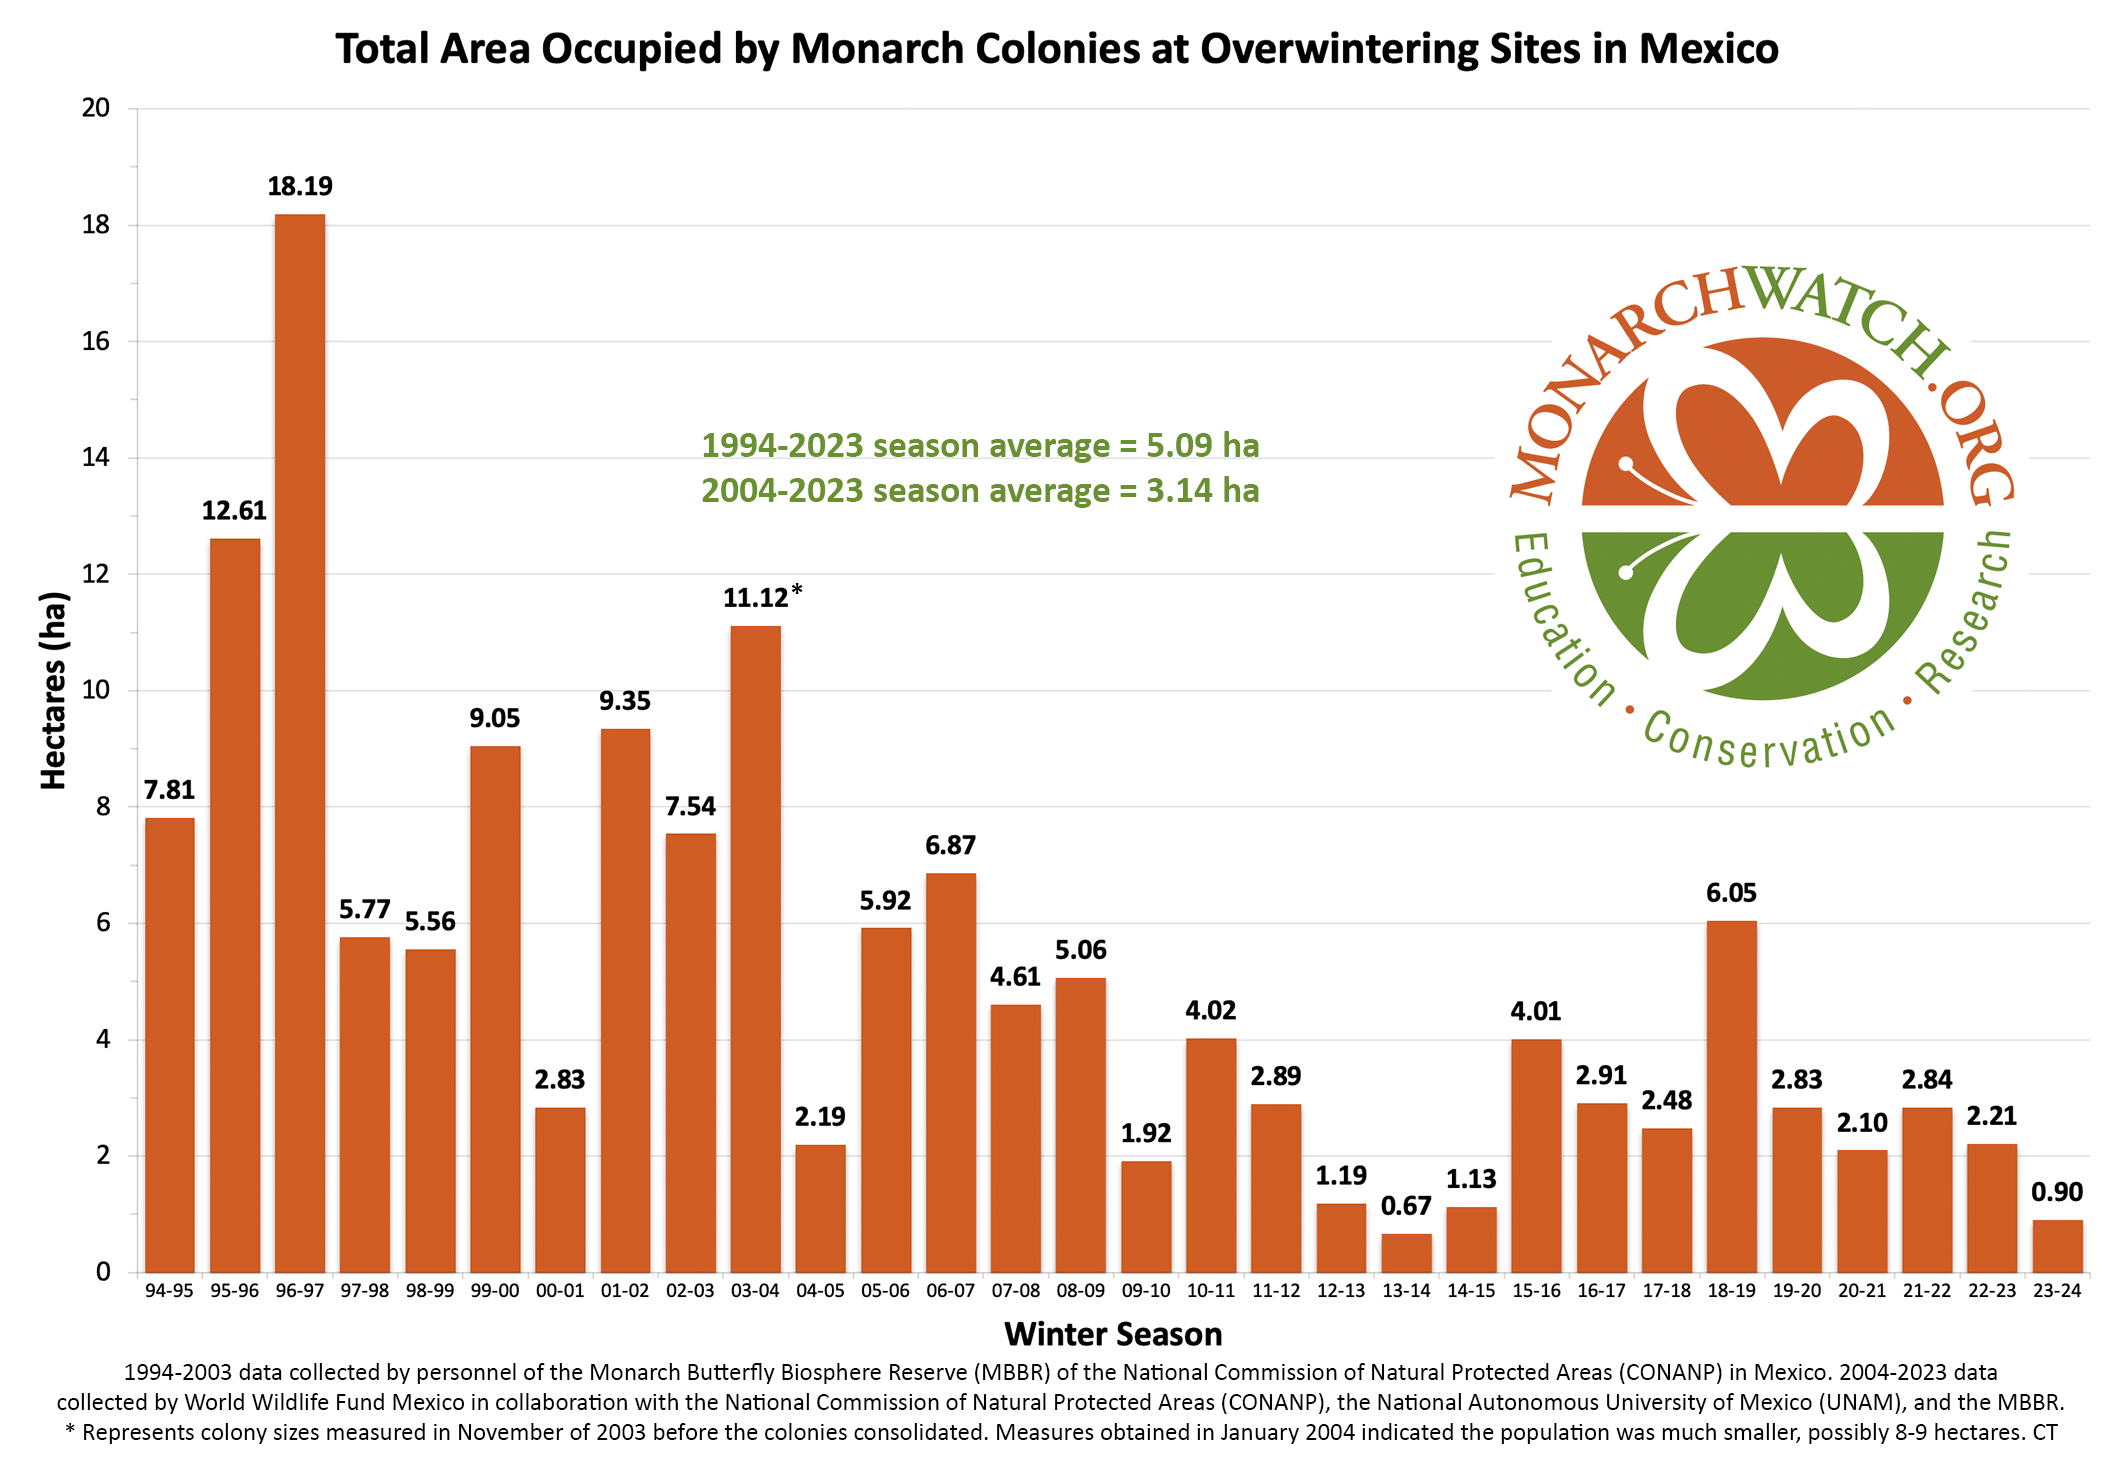
Figure 1. Total Area Occupied by Monarch Colonies at Overwintering Sites in Mexico.
In this text, I will review the changes in monarch numbers from 1994 to the present and will address whether the population is continuing to decline. I will end with an outlook for the next two decades based on current trends in the weather.
How we got to this point
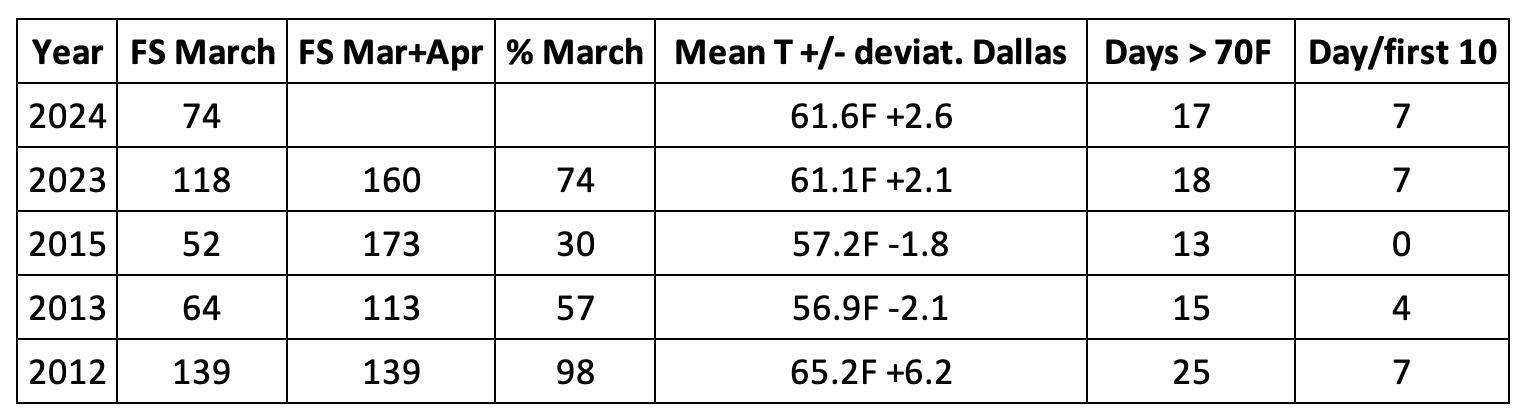
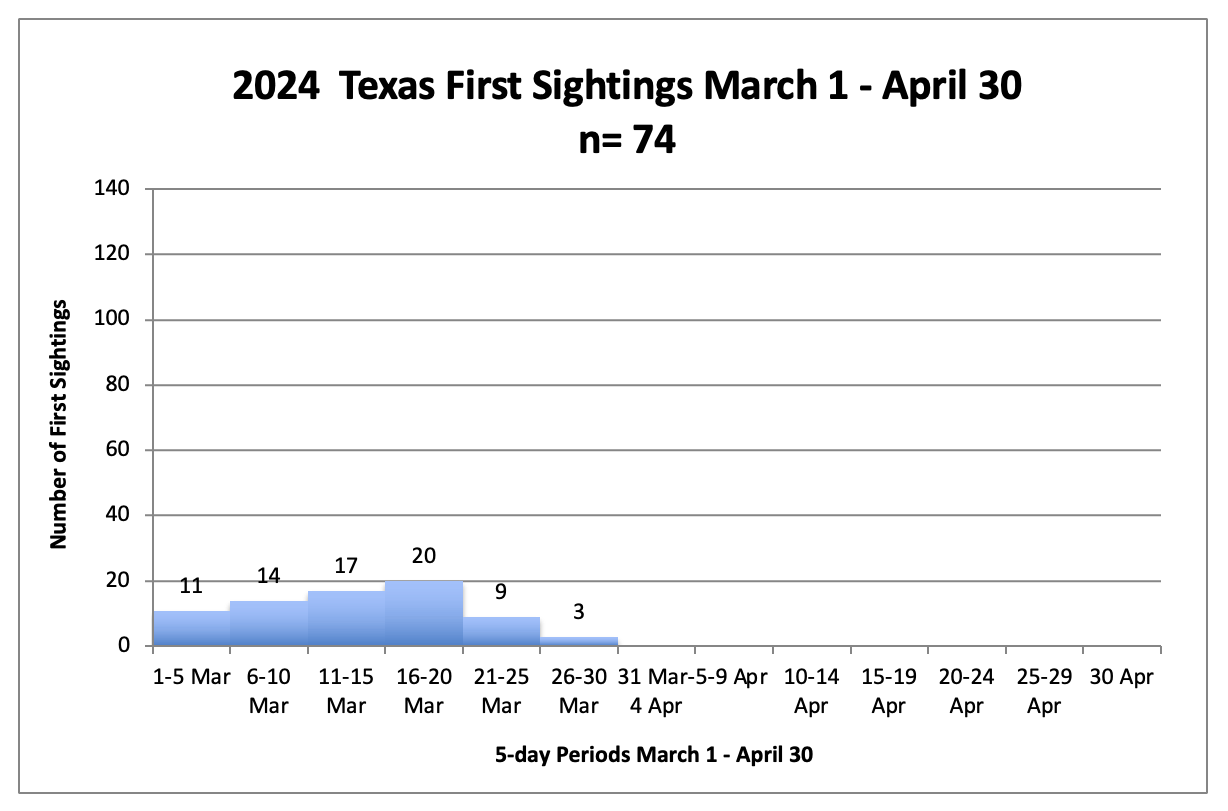
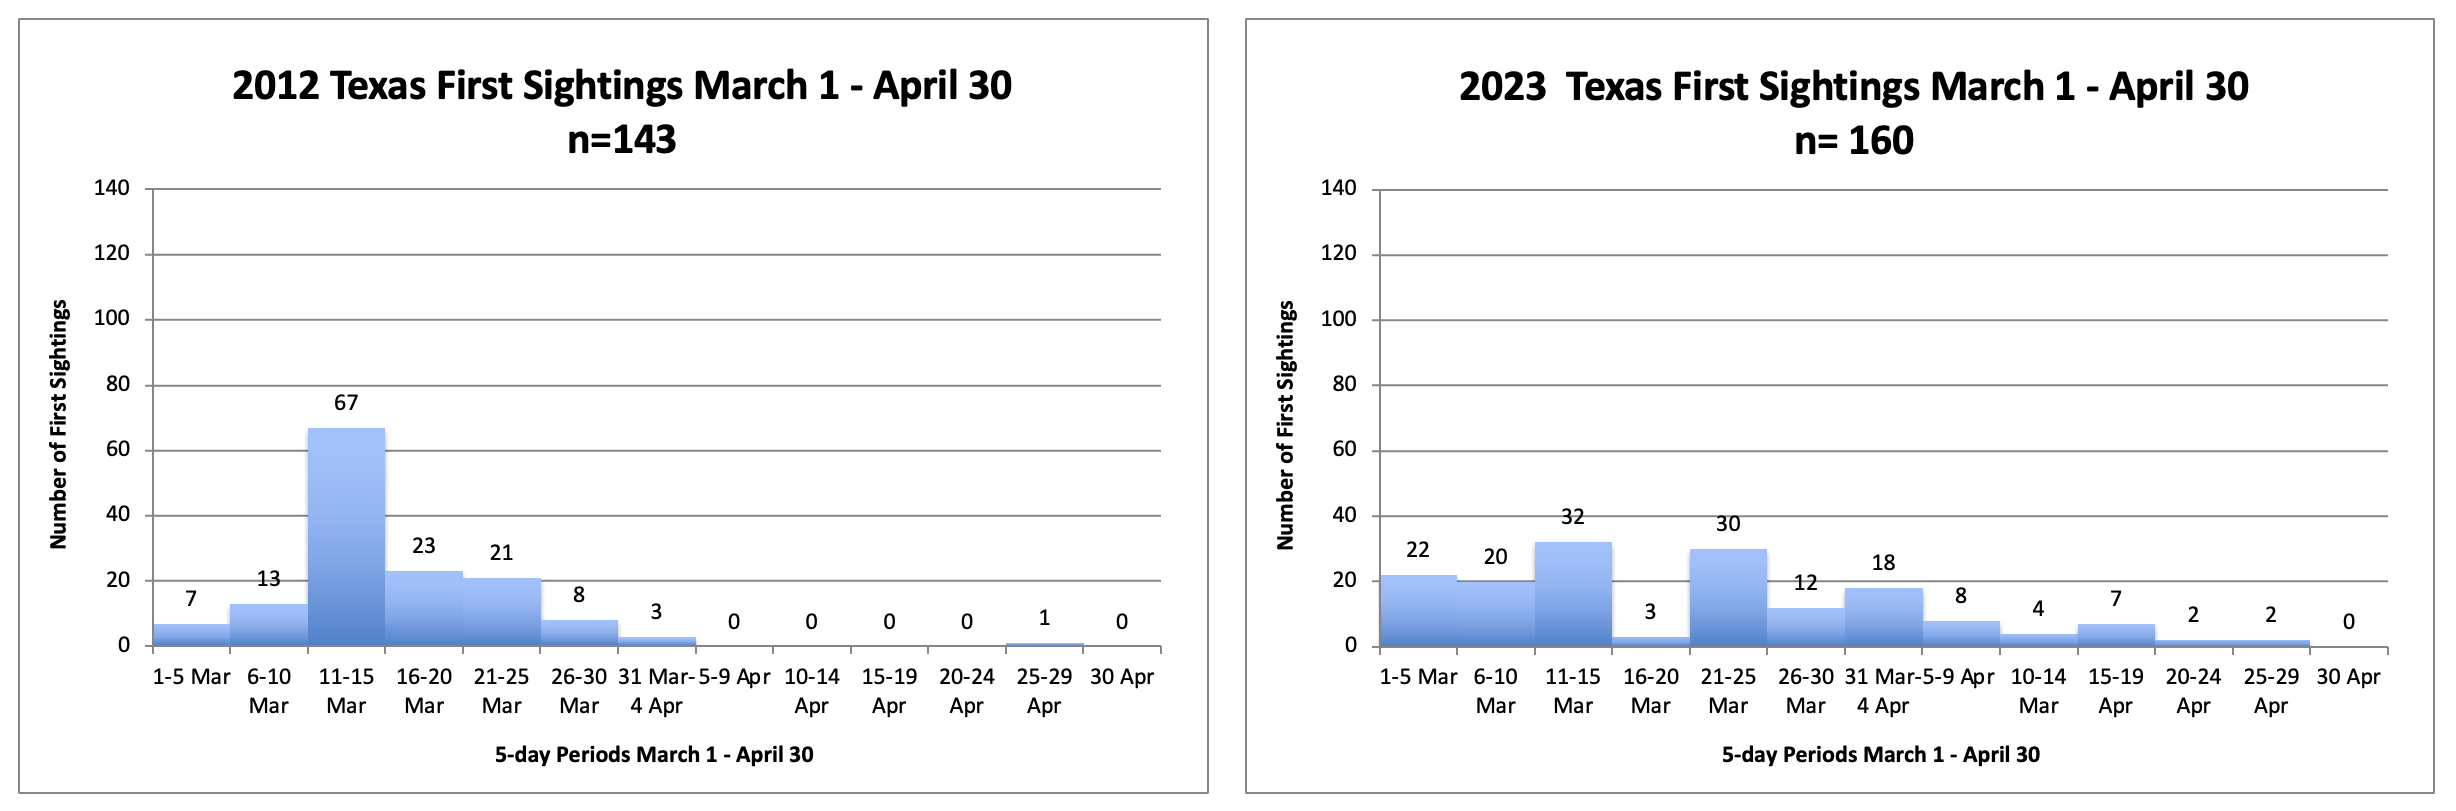
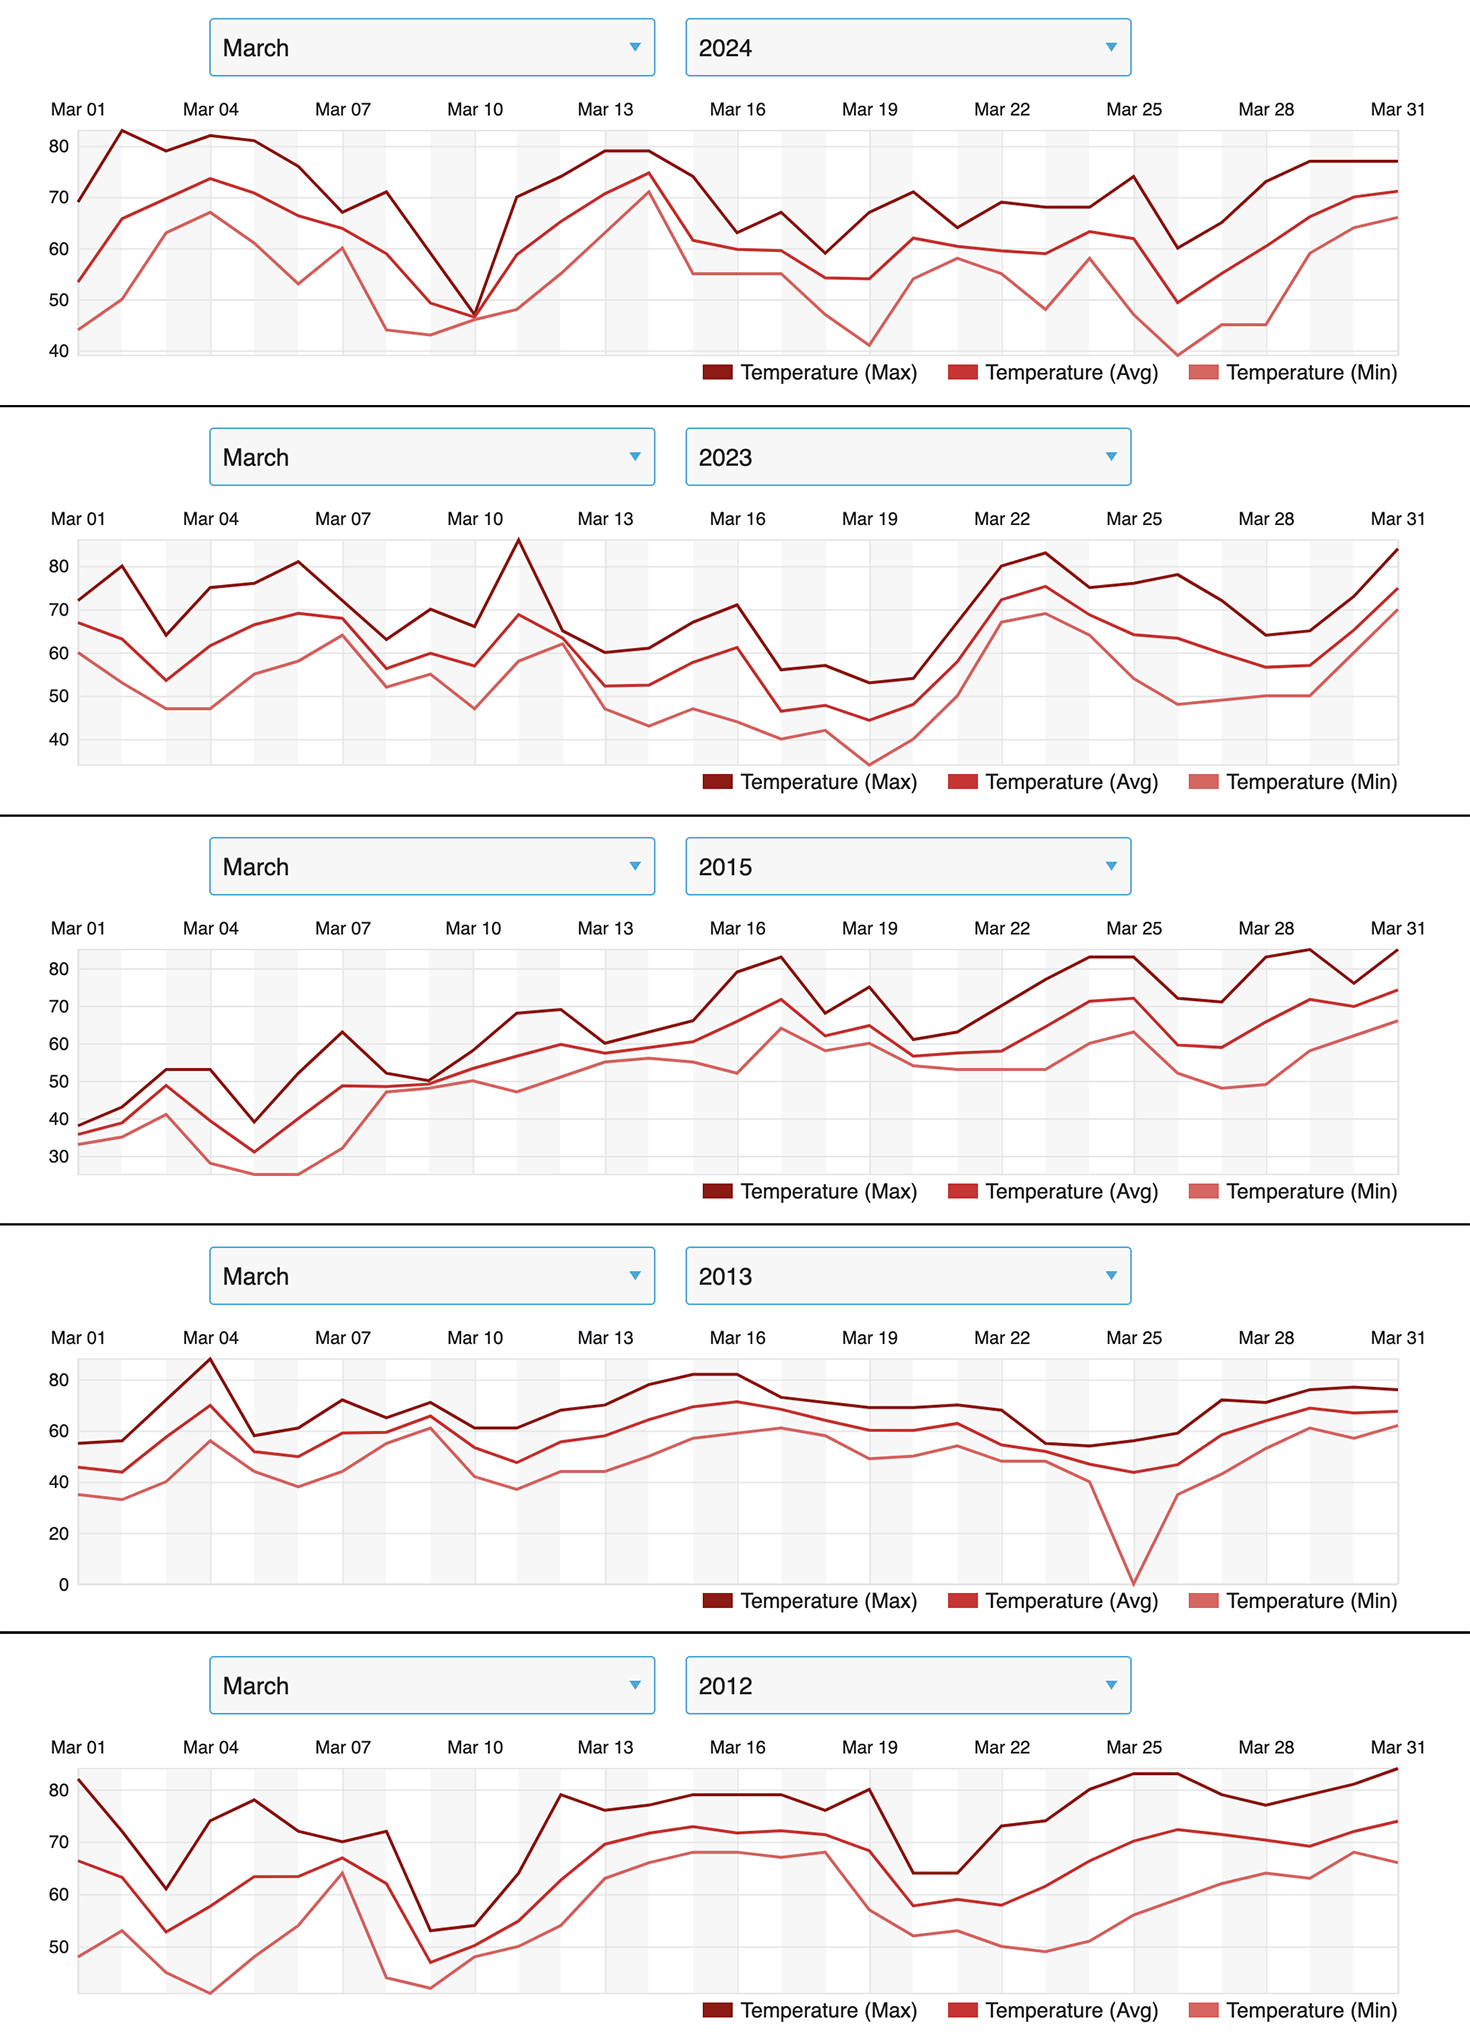
In an effort to keep this text brief, and to lead as directly as I can to the question posed in the title, I’m going to start with several questions and answers (my answers). First, have monarch numbers declined by 85%? Yes, if we accept that the numbers measured from 1994-1996 represent a long-term average. However, that is unlikely. The size of the overwintering monarch population is largely determined by weather and extreme events, as shown by the crash due to an April freeze deep into Texas in 1997 that led to a decline from 18.19ha to 5.77ha, and the drought in 2000, a decline from 9.05ha to 2.83ha. What the numbers from 1994-1996 tell us is that in the 1990s, and for some unknown number of years earlier, there was enough habitat to enable large populations to develop when conditions were favorable. Actually, conditions favored population growth in all three of those years, the only three consecutive years of positive growth in the 30-year record (Taylor, in prep). In fact, the conditions for population growth in 1996, were the most favorable in the 30-year record and the resulting population was the largest to be measured (18.19ha) (Taylor, in prep). We can also ask why there were no populations as large as those in 1995 (12.16ha) and 1996 (18.19ha) in subsequent years. Was it because of weather and mortality related to the migration that caused the population to decline or was it due to habitat loss? It’s clear that in the 1990s there was enough habitat to enable the development of large populations when conditions were favorable; however, the decline in 1997 (5.77ha), the failure to increase in 1998 (5.56ha) followed by the increase in 1999 (9.05ha) and the crash in 2000 (2.83ha) occurred while there was an abundance of monarch habitat. The ups and downs through these years can all be attributed to weather and not loss of habitat. These and other examples, make it clear that monarch numbers are largely driven by weather irrespective of the amount of habitat available. Subsequently, it became clear that monarch numbers had begun to decline starting in or before 2004-2005. The consistently low numbers in years that followed led to a focus on the loss of habitat associated with the adoption of herbicide tolerant corn and soybean crop lines as responsible for lower population numbers (Brower, et al., 2012, Brower, Taylor and Williams, 2012). Weather, as the driver of numbers, wasn’t part of the conversation until the 2011 drought in Texas, the extreme March temperatures in the spring of 2012 and the crash of 2013.
The above examples show us that to fully understand monarch numbers through the years, we have to track the effects of weather on the growth of the population and the success in reaching Mexico against what is known about the distribution, abundance and quality of monarch habitat. This applies especially to the conditions in the Upper Midwest, the area that produces the largest number of monarchs that reach the overwintering sites.
The monarch annual cycle – a stage specific approach
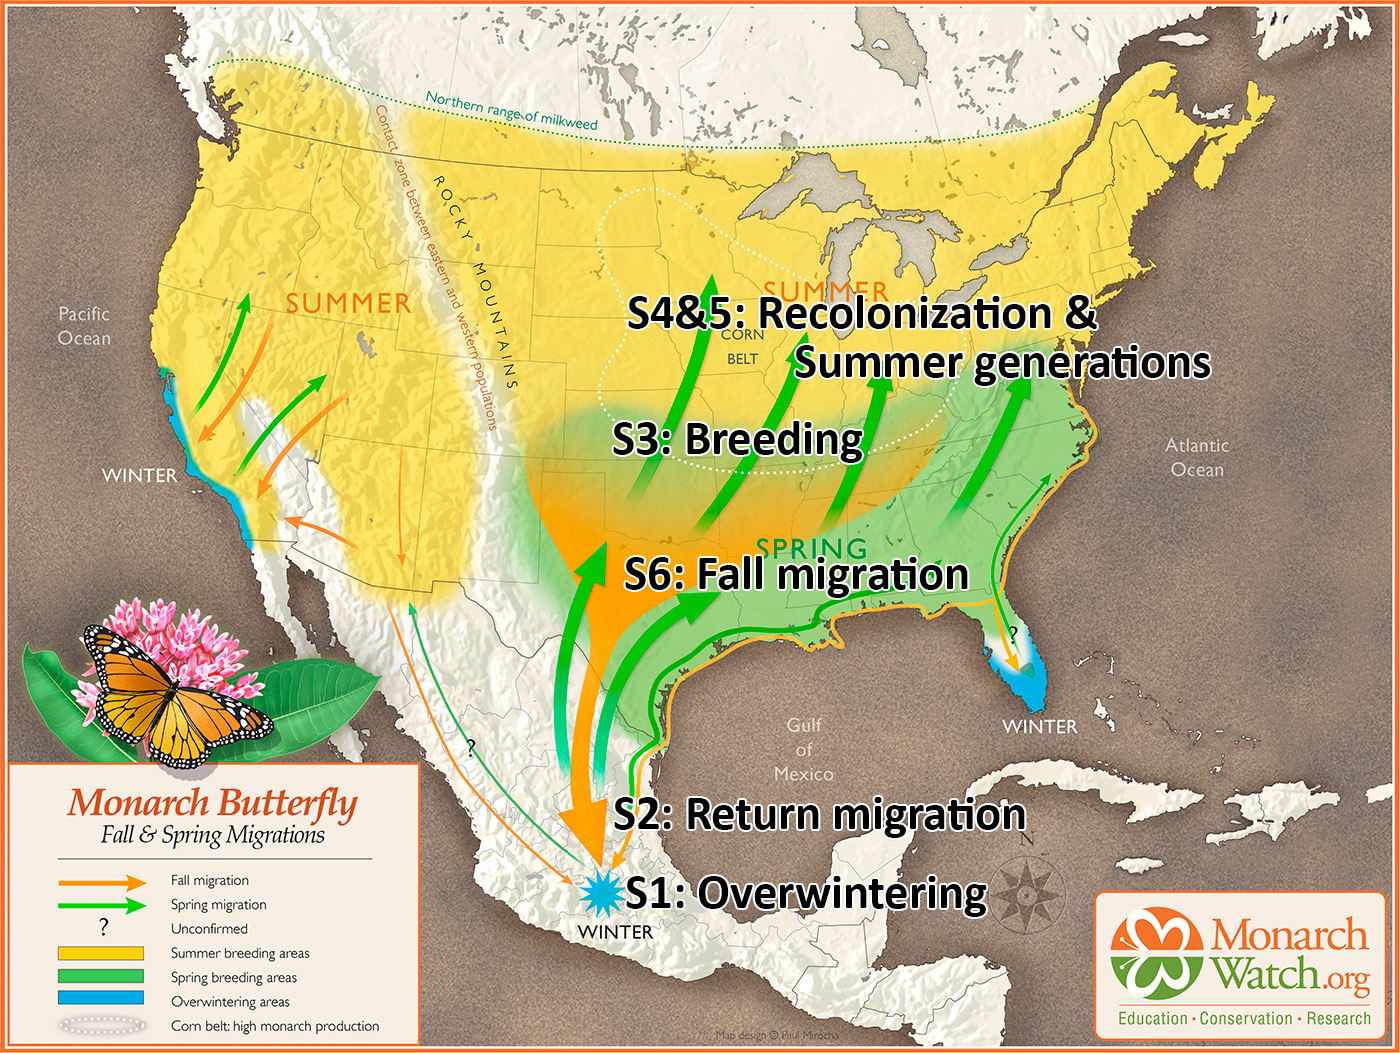
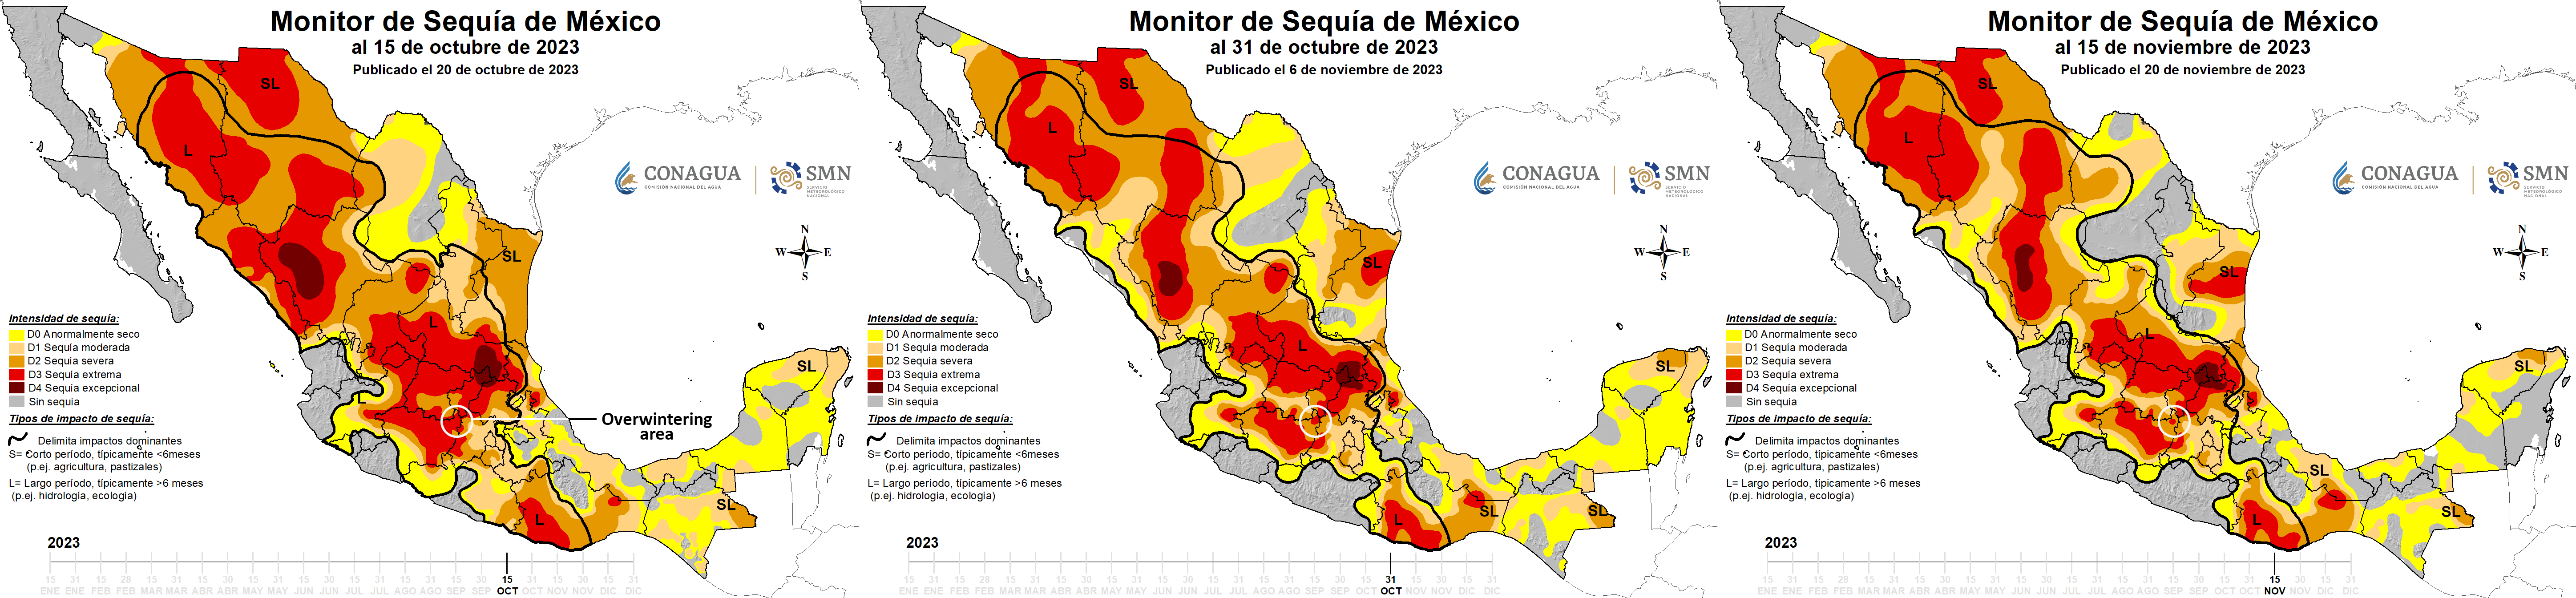
To parse out the possible effects of habitat loss and weather, we have to identify what happens during each stage of the annual cycle. The “health” of the monarch population is based on measures of the areas in the oyamel forests in Mexico that contain clustered monarchs. The overwintering period extends from November to late March. The colonies of clustered monarchs are thought to be fully formed by mid-December, and the colonies are measured at that time.
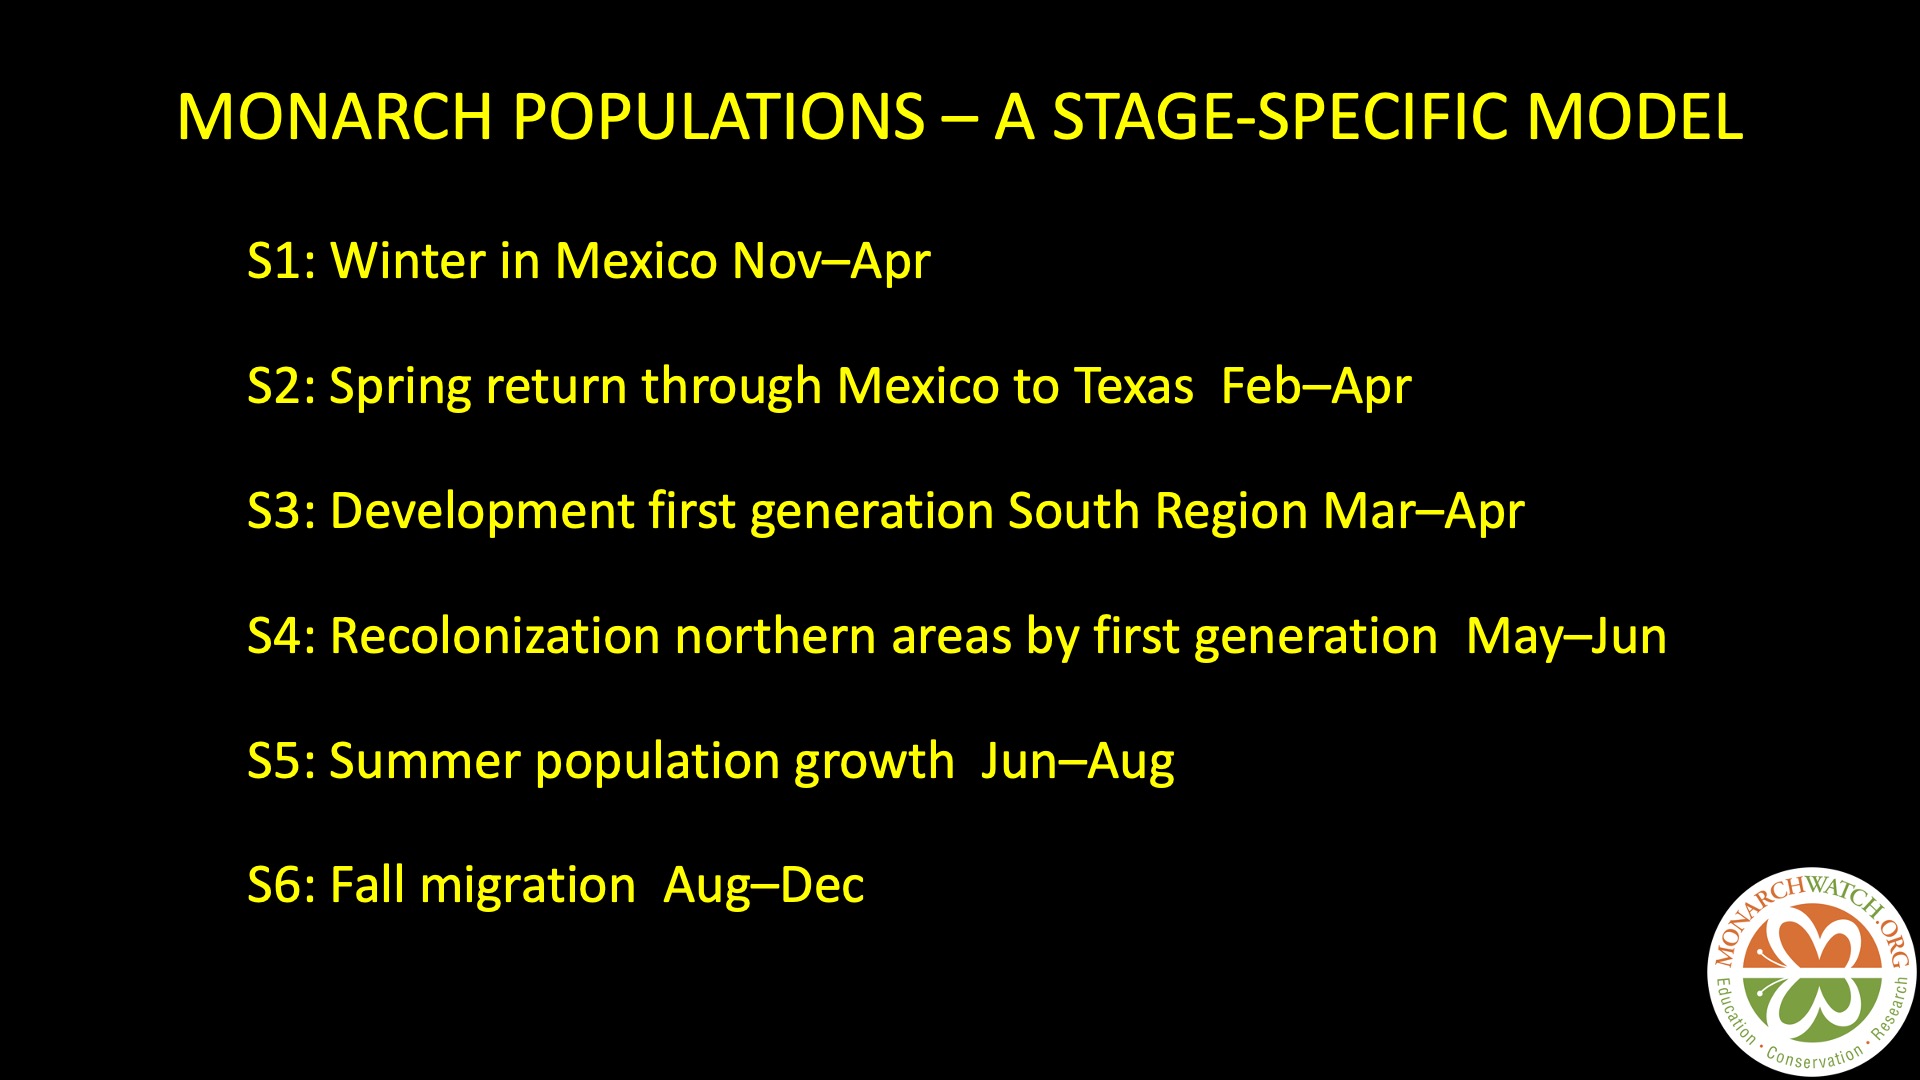
The numbers, in hectares (ha) of occupied forest, for the last 30 years are shown in Figure 1. To understand the increases and decreases in these numbers, we need to follow the population through six stages: 1) overwintering, 2) the 600-800mile return from late February to April to Texas, 3) the production of the first generation in March and April, 4) the colonization of the northern breeding area in May through early June, 5) the production of the second and third generations during the summer months and finally 6) the migration in September-October. Weather events in each of these stages determine the number of monarchs that enter the next stage. In the winter months (S1), and the return to Texas in the spring (S2), weather has an impact on adult survival. During the breeding season from March-September both weather and habitat determine adult numbers and reproductive success (S3-5). In simple terms, the population increases in the breeding season and declines from the end of the last summer generation (S6) until the initiation of the next breeding season.
Effects of weather
The effects of weather on overwintering numbers, during migrations and through the breeding season, have been summarized in other articles in this series (Taylor, 2023 A, B, C, D and in prep). Briefly, in the breeding season, increases are strongly associated with conditions that are close to the long-term averages during each stage from March through September. Decreases are associated with elevated March and September temperatures, extreme high or low temperatures during the breeding season, droughts during the migration or breeding season, catastrophic winter mortality, and, in one instance (1997), an April freeze that extended into Texas. The effects of weather can be seen through the entire 30-year record. There are two trends in this record that are worrisome, the increases in the March temperatures in Texas and elevated September temperatures during the fall migration north of 35N. In the case of the March temperatures, higher than average temperatures have a negative impact on the growth of the population due to the tendency of monarchs to disperse too far north too soon. Above average September temperatures are associated with slower migrations with fewer monarchs reaching the overwintering sites (Taylor, et al., 2020). Looking ahead, an increase in the frequency and severity of droughts in Texas (Nielsen-Gammon, et al., 2021) will also limit the number of monarchs reaching the overwintering sites.
Loss of habitat
There have been a number of studies dealing with the decline in monarch habitat that started in the 2000s. Most have focused on the loss of milkweeds in row crops (corn and soy) due to the adoption of herbicide tolerant crop lines (Pleasants, 2017, Pleasants and Oberhauser, 2013). Less attention has been paid to the loss of habitat that followed the adoption of the renewable fuel standard (RFS) in 2007 (Faber, et al., 2012, Lark, et al., 2015, Lark, et al., 2020, Lark, et al., 2022) and even less to the amount of habitat loss that has occurred in the last 10 years. Through this 30-yr period the acres devoted to corn and soy have increased from 140million acres to 180million acres (Table 1) and much of the grain production in the Upper Midwest was shifted to grassland areas somewhat to the southwest (Faber, et al., 2012, Lark et al., 2015). Loss of milkweed/monarch habitat due to development, mostly suburban sprawl, increased during this period until the housing/banking crisis of 2008 but began to pick up again after 2011 (Houston Housing Starts). How much monarch habitat was lost to development throughout this period is difficult to estimate but was probably significant. The American Farmland Trust puts the loss of farmland during the period from 2012 to 2017 at 14.3million acres (New Census of Agriculture Shows Decline in Number of America’s Farms, Farmers, and Farmland). It is likely that much of the more than 2million per year loss was, and continues to be, due to the sprawl surrounding the cities in the Upper Midwest and the Ohio Valley. In the South Region, the city of Houston provides an extreme example of the expansion that occurred broadly in the United States before 2008. In 2007, 37,568 new single-family homes were added in the greater Houston area. That’s about 12,000 acres without accounting for multi-family units, roads, schools, churches, etc. Habitat losses associated with HT crop adoption and the growth of corn acreage that followed implementation of the RFS are summarized in Table 1.
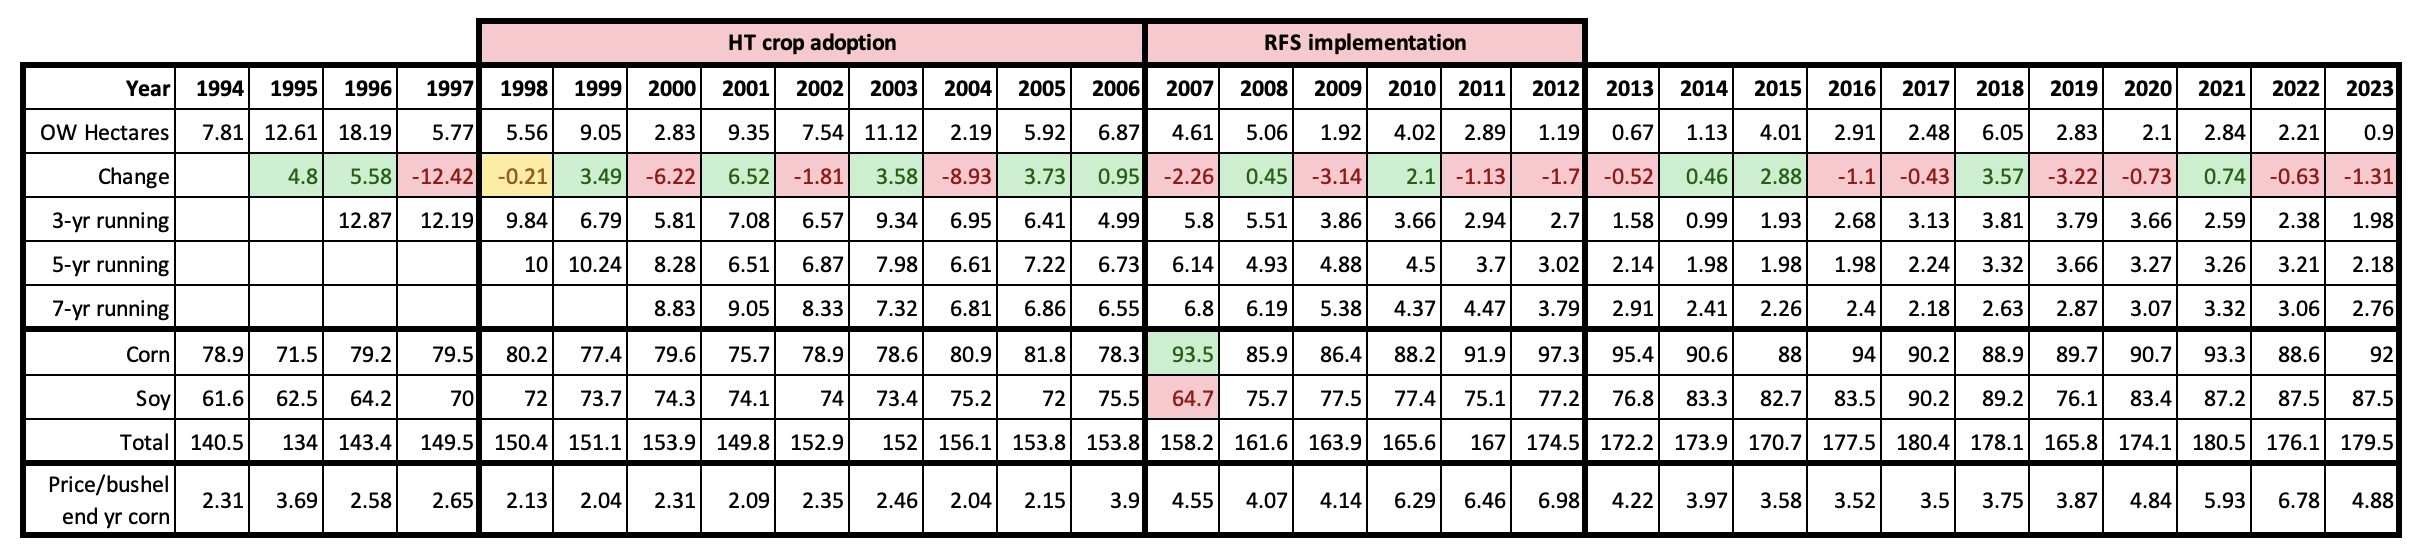 Table 1. Running averages for three, five and seven year intervals are summarized for overwintering numbers for 1994 – 2023. “Change” refers to the change in the number of hectares from one year to the next with gains highlighted in green and losses in pink. Corresponding corn and soybean acreages and corn prices are included for reference. Note the shift in corn and soybean acreage in 2007. Habitat losses due to the adoption of HT crops may have ranged from 70-100million acres while losses that followed the adoption of the RFS were roughly 17-24million acres. Additional habitat losses are not listed due to their complexity. Row crop acreage increased from 140 to 180 million from 1994-2022.
Habitat fragmentation
The loss of habitat due to HT crops, the RFS, urban sprawl, herbicide use along roadsides and other causes has come with a cost. It has resulted in the creation of large fragments of the landscape that lack nectar sources and host plants. The effect has been to increase the distance between the remaining resource patches. Because there are only so many hours for foraging and egg laying each day, and so many active days in the life of female monarchs, increased distances mean increasing search times, greater stress and reduced egg laying efficiency (Crone and Shultz, 2022, Fisher and Bradbury 2021, Grant, et al., 2018). Although there are no measures of these costs, they are easily envisioned by taking a car trip through the Midwest in June and measuring the distance between, and abundance of, nectar sources and milkweed patches. Or, you can zero in on landscape use with Google Earth. Should you do so, try to imagine the landscape as a tall and mixed grass prairie in the early 1800s, the habitat that supported monarchs for thousands of years. The fact that monarchs persist in this man-made environment, with massive empty fragments, is a testament to their adaptability and therefore the “representation” that is key to the Species Status Assessment used to determine an ESA designation (Taylor, 2023F).
Modifications of the landscape for agriculture and development have broken the connectivity that previously existed in the prairies. This process is ongoing. It follows, that to sustain the monarch migration, we will need to restore much of this connectivity, especially in the Upper Midwest and Ohio Valley that produce the largest number of monarchs that reach Mexico.
Origins of monarchs that reach Mexico
Prior to Native Americans and Europeans, eastern monarchs were a species of the tallgrass and short grass prairies. Their present distribution is much broader, ranging from Saskatchewan to the Maritimes in Canada and from the Front Range in the Rockies to the east coast. Common milkweed, Asclepias syriaca, an early successional species, rapidly colonizes disturbed soils and likely increased in abundance as Native Americans used fire to open up the landscape for hunting and the production of crops (Russell, 1983, Stewart et al., 2002). These activities, that ranged from Minnesota to the east coast, likely led to an increase in monarchs east of the grasslands (Brower,1995). Monarchs were known to the earliest settlers as the “King Billy”, a name taken from William of Orange, the King (1689-1702) at the time. Their occurrence in the late 1600s signals the presence of common milkweed and open areas in a forest climax region. As settlers opened up the landscape further, it is likely that both milkweeds and monarchs became even more abundant in the east (Brower, 1995). Thus, although the original distribution of the monarch is not known, it is likely that human activities have played a role in the distribution and abundance of monarchs for thousands of years. In this history, it’s probable that humans have both extended and reduced monarch habitats as the use of the land has changed over the centuries. This dynamic continues.
Remarkably, whatever the original distribution, tagged monarchs have been recovered from every 5×5 latitude/longitude sector east of the Rockies in which more than 400 monarchs have been tagged (Taylor, et al., in prep). These recoveries have included monarchs tagged in the Maritimes, a previously forested area, that probably had no monarchs before early settlers began opening up the landscape. While these records demonstrate the monarchs’ remarkable ability to respond to changes in the distribution of milkweeds, it remains a butterfly of what was originally the tall and mixed grass prairies as indicated by recoveries of tagged monarchs. Preliminary analysis of the recoveries of tags recovered in Mexico shows that about 70% of the monarchs reaching Mexico were tagged between longitudes from just west of Madison, WI to the middle of the Dakotas (90W to 100W). Another 20% were tagged from western Pennsylvania to just west of Madison (80W to 90W). The recoveries from the Maritimes to western PA to (65W to 80W) totaled about 10% (Taylor, et al., in prep). From these results, and other analyses (Thogmartin, et al., 2017), it’s clear that sustaining the monarch migration will require protection and restoration of nectar and milkweed resources in the Upper Midwest and the Ohio Valley.
Milkweeds and monarchs
Although monarch larvae are known to feed on about 30 of the more than 70 species of milkweeds known to occur in the United States and Canada, the eastern migration is largely dependent on three of these species, Asclepias syriaca, A. viridis and A. asperula. In fact, it is probably safe to say that there would be no eastern migration without these three species. All three are abundant and widespread, but their most import attribute is their ability colonize disturbed sites and to persist in spite of attempts to eliminate them through mowing and herbicides. Their ability to replace themselves sets them apart from most species in the genus. The vast majority of milkweed species are unable to colonize disturbed sites and none of them, aside from the three mentioned, are both widespread and abundant. Many species persist as small, scattered populations in sites with relatively little disturbance.
The reestablishment of the monarch population in the United States and Canada each spring involves a two-step process (Cockerel, Malcolm and Brower, 1993, Malcolm, Cockerel and Brower, 1993, Flockhart, et al., 2013). Monarchs return to Texas in March and early April. Females seek out milkweeds on which to lay eggs. Most of these eggs are laid on A. viridis, the most common milkweed in Texas and Oklahoma. Many are also laid on A. asperula that is also abundant in portions of Texas west of I-35. Most of the returning adults die by the end of April, and about that time, the earliest offspring of these monarchs begin their migration northward. The first-generation females in this cohort mate and lay eggs as they move north with most eggs being laid on A. viridis in Texas, Oklahoma and even southern Kansas. As they move further into Kansas, A. viridis declines with the predominant host plant becoming A. syriaca north of 40N, the main summer breeding range. The dependence on common milkweed as the host for the summer generations is almost complete. Seiber, et al., 1986, and Malcolm et al., 1993 using cardenolide signatures specific for milkweed species found that 85% and 92%, respectively, of monarchs obtained from overwintering sites had fed on A. syriaca as larvae. Malcolm et al., 1993, also showed that 84% of the first-generation monarchs that colonized the Upper Midwest had fed as larvae on A. viridis. Clearly, without an abundance of A. viridis and A. asperula in Texas in March and April there would be little in the way of a first generation and therefore an infinitely small migratory generation in the fall – if there was any at all. So, it is not just A. syriaca that we need to sustain and restore in the Upper Midwest and Ohio Valley, we also need to protect and restore A. viridis and A. asperula in Texas, Oklahoma and Kansas.
Milkweed limitation vs migratory mortality hypotheses
The reduction in monarch numbers over the last two decades has given rise to two competing hypotheses about the cause of the decline. One is based on the observation that milkweeds have declined due to the adoption of herbicide tolerant (HT) row crops. This assessment has been termed the milkweed limitation hypothesis (Pleasants and Oberhauser, 2013). The presumption is that there is a link between the amount of habitat and the number of monarchs that reach Mexico. Stated more directly, fewer milkweeds mean fewer monarchs. The second interpretation comes from a series of mid-summer butterfly counts from eastern Illinois through the Ohio Valley that appear to show no decline in monarch numbers over many years (Crossley, et al., 2022, Inamine, et al., 2016, Ries, et al., 2015). These observations have led adherents to maintain that the population has declined due to events that occur during the migration or shortly after the monarchs reach the overwintering sites (Agrawal, 2019, Agrawal and Inamine, 2018). This hypothesis is termed the migration mortality hypothesis. A presumption in this case is that milkweed is not limiting in that females are able to locate enough plants to fulfill their reproductive potential. Proponents of the milkweed limitation hypothesis maintain that the summer counts fail to account for the loss of milkweeds from the intensely farmed areas of the Upper Midwest that followed the adoption of herbicide crop lines (Taylor, et al., 2020, Pleasants, et al., 2024). Those that maintain that the summer population has not declined argue that the reduction must be due to losses during the migration (Agrawal, 2019, Agrawal and Inamine, 2018). In effect, one side is arguing that milkweeds can be relatively abundant and widespread yet limiting due to massive fragmentation while the other argues that milkweed is so abundant that it can’t possibly be limiting. Early on in this discussion neither side considered other factors that determine the size of the population in a given year or through time. There is also a question about monarch production vs the area in which the summer counts were obtained. The majority of monarchs that reach the overwintering sites in Mexico originate from the Upper-Midwest (west of 90W, Taylor et al., in prep), the summer counts were obtained in lower production areas to the east of the Upper-Midwest, e.g., from 90-89W.
There are two questions that need to be dealt with in this debate. First, can a host plant be abundant and widespread and limiting at the same time? The answer is yes, and it has to do with fragmentation and the ability of monarchs to find diminished resources in a progressively fragmented landscape (Crone and Schultz, 2022, Fisher and Bradbury, 2021). Fragmentation surely has a cost. As search time, energy expenditure, and wing ware increase, realized fecundity is likely to decline. Our perception of the abundance and distribution of milkweeds and nectar sources is unlikely to align with how a monarch perceives those resources (Grant, et al., 2022). The second question deals with why the summer populations fail to track the general decline in monarch numbers. The butterfly counts that were used to indicate a disconnect between summer and winter numbers spanned a period before the adoption of herbicide tolerant (HT) corn and soybeans as well as the years after their use had largely eliminated milkweeds from these row crops.
A recent analysis of the same data showed that, while summer counts conducted during the interval before milkweed were eliminated from row crops (1994 -2005) were not correlated with winter numbers, those obtained after the elimination of milkweeds (2006-2021) from croplands were correlated with winter numbers (Pleasants, et al., 2024). The message here is that by including all years in the analysis, Crossley, et al., 2022 had combined data from a period during which milkweed was declining rapidly with a range of years in which habitat loss was minimal. This result also supports the assessment prior to the elimination of milkweeds in row crops that these “habitats” accounted for “most” of the monarchs that were produced in the Upper Midwest (Oberhauser, et al., 2001).
Questions about the number of monarchs in some counts can be approached in another way. In theory, if we know what has happened during every stage from the winter to the development of the second generation, especially if we know the timing and number of monarchs returning to Texas together with measures of the timing and numbers of the first-generation monarchs arriving at summer locations, we should be able to predict the relative size of the summer population. Indeed, a preliminary analysis suggests that this is possible since the number of sightings reported to Journey North of first-generation adults in the Ohio River Valley by mid- June is correlated with the mean temperature for May, p = 0.023, (Taylor, in prep).
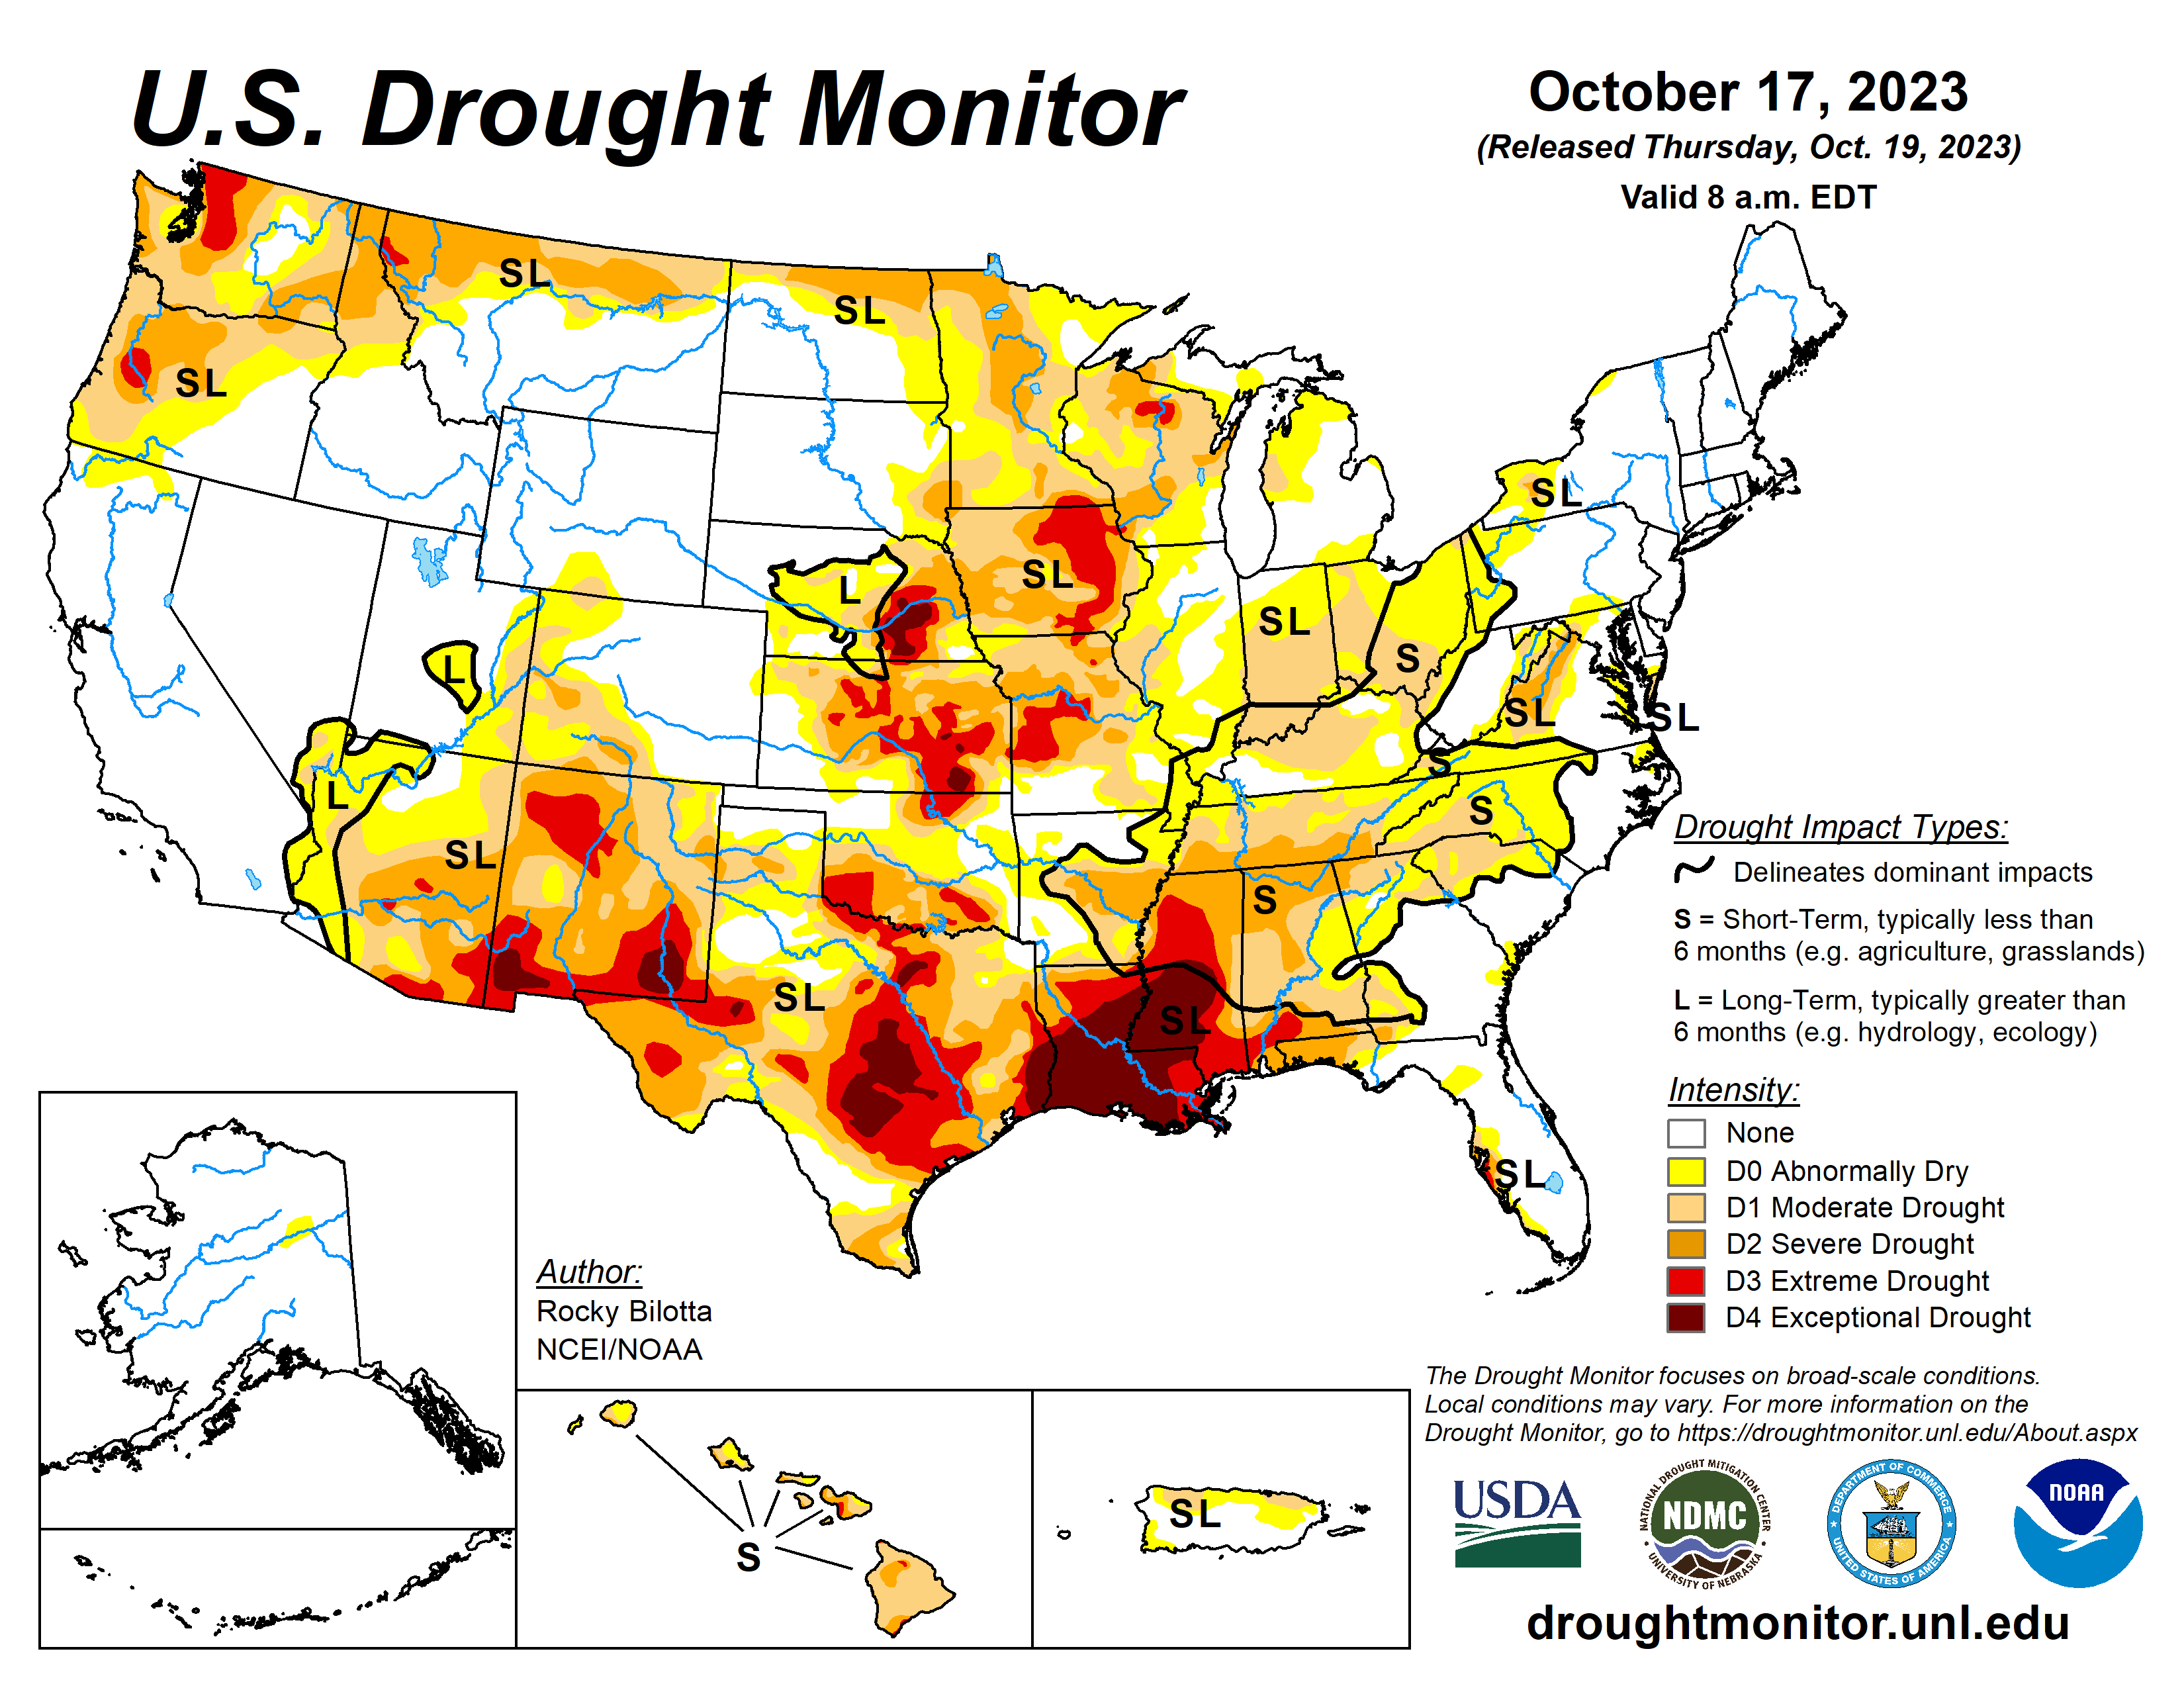
Further, the possibility, indeed the likelihood, that declines in the distribution and abundance of milkweeds and increases in mortality during the migration both account for lower numbers in Mexico is not treated in detail. The loss of milkweeds is well established, and it is also clear that higher than average September temperatures in the Upper Midwest and Northeast (Culbertson, et al., 2021, Taylor, in prep.) and droughts (1999, 2000, 2011, 2019, 2022, 2023) (Taylor, et al., 2020, Hobson, et al., 2023) during the fall migration are associated with lower numbers reaching the overwintering sites in Mexico. However, knowing how many monarchs reach Mexico is only part of the story since the number returning from the overwintering sites to Texas in the spring is determined by the conditions during the winter months (Taylor, in prep) and the temperatures and abundance of nectar along the 800-mile pathway most monarchs use to reach the milkweed areas in Texas. In fact, the numbers returning from Mexico in March are often lower (2012 -2013) and sometimes higher (2013-2014) than would be expected from the overwintering counts (Taylor, 2021). The point here is that to understand the overwintering numbers, or those at any time during the year, we need an approach that links all the consequential events during the annual cycle.
How much habitat remains?
To further monarch conservation, we need to know a great deal about the distribution and abundance of the three milkweed species A. syriaca, A. viridis, A. asperula that play the greatest role as hosts for the population each year. These data need to be linked with what is known about the geographic origins of monarchs that successfully reach the overwintering sites in Mexico. The regions (Upper Midwest, Ohio Valley) where milkweeds are most used by monarchs are priority areas for restoration. In addition to tagging data, first sightings recorded by Journey North, egg and larval counts by the Monarch Larval Monitoring Project (MLMP), and surveys for adult abundance help define these priority regions. Beyond that, it is helpful to know the maximum size that a population can attain under the most favorable conditions. The presumption here is that the distribution and abundance of milkweeds sets a limit, or cap, on the number of monarchs that can be produced from a region under the most favorable conditions. Comparing conditions during population development each year allows us to define the metrics associated with both increases and decreases (Taylor, in prep). The conditions that occur during the most productive years tell us two things: the upper limit that can be supported by the available milkweed and what defines the most favorable conditions. Further, comparing conditions among all years (1994-2023) shows that larger numbers of monarchs were produced under similar conditions (1994-2003) when more milkweed was present. These observations support the milkweed limitation hypothesis, and they tell us that, at present, even under conditions similar to those of the early period, it is impossible for populations to reach the numbers of the early 90s given the current distribution and abundance of milkweeds.
The future status of monarchs: The listing
The Fish and Wildlife Service is under court order to establish whether there is sufficient evidence to confer protected status to the monarch butterfly based on provisions in the Endangered Species Act (ESA). The range of options includes not warranted, warranted but precluded (the current status), threatened 4d, and endangered. Under a threatened 4(d) ruling, FWS can customize prohibitions and regulate activities as it deems appropriate for a species under consideration. The range of potential prohibitions are listed in Section 9 of the ESA.
The decision will largely depend on how trends in the data are interpreted, the perceived imminent threats to the population, and the presumption that the migratory population would NOT be able to recover from a series of extreme events and would therefore become extinct. In practice, the decision should be based on the best available data-based science and not speculation. In general, such decisions are preceded by a Species Status Assessment (SSA). This assessment includes a literature review and usually the opinions of experts. It’s centered around what are known as the three r’s: resilience, redundancy and representation. Resilience refers to the ability of the species to respond to stochastic (random) events. Redundancy represents an assessment of the ability of a species to respond to catastrophic mortality. Representation seems to have two interpretations: the ability of a species to adapt to long-term changes in the environment and/or the species’ role in the ecological processes in the range it occupies (Taylor, 2023F). For reasons that are not clear, none of these criteria were assessed in detail in the SSA used as the basis of the threatened but precluded status for monarchs issued in 2020 (Fish and Wildlife Service, Monarch SSA, 2020). Yet, at the time of the SSA, there was ample evidence that supported each of the three r’s for monarchs (Taylor, 2023F). Monarchs are a resilient species with a high reproductive rate that is well adapted to recover from extreme climatic events and catastrophic mortality. It’s clear that monarchs have recovered from low numbers many times in the past (Taylor, 2021, 2023, A, B, C, F).
The depth and quality of the assessment is important since the pending decision and the attendant assumptions and prohibitions, will have consequences that are likely to involve agricultural interests, pesticide regulations, landowners, government sponsored restoration programs, conservation efforts led by NGOs and corporations as well as citizens and even educational programs. This decision will have a far-reaching impact.
An underlying assumption in the Endangered Species Act is that regulations limiting harvest (take), protecting habitats, or managed propagation followed by releases, which have led to the restoration of a number of vertebrates, will also work for monarchs and other invertebrates whose numbers are determined by weather. That’s not likely. Threatened 4(d) prohibitions and regulations will surely be ineffective in this case and could have unintended consequences.
Monarch numbers now and in the coming decades
The low number of hectares of overwintering monarchs in 2013 (.67ha) was a shock. At the time, knowledge of monarch demography was minimal, and there was no understanding of why the population was low and no prior record of recoveries from low numbers. In the West, monarch numbers went from lows in 2018 (27,721) and 2019 (29,429) to only 1849 in California in 2020, a number that was believed to be below the extinction threshold for that population. Both populations recovered rapidly. By 2015, the overwintering numbers in the East measured 4.05 hectares, a remarkable recovery in just two years. In the West, the low winter count in 2020 led to >247K in the fall of 2021 (Taylor, 2023C). In retrospect, the recoveries from low numbers in both the East and West indicate how little we knew at that time about the factors that determine monarch numbers from one year to the next. There was an overreaction in both cases. Recoveries from both lows indicate that there is enough habitat to support 6-7 hectares of overwintering monarchs in the East (6.05ha in 2018) and at least 350K monarchs in the West when conditions are favorable.
In the immediate future and perhaps into the next two decades, the population will be relatively stable since it is not presently on a continuous downward trend as it was from 2000-2006. Meehan and Crossly (2023), using a statistical approach, pointed out that the decline in numbers in the East over the last 29 years progressed at an uneven rate and concluded that the population has not decreased measurably over the last 10 years. This pattern can also be seen in the 3, 5 and 7-year running averages in Table 1. The running averages as of 2023, are similar to those of 2013-2015, Table 2. Although the numbers reported for the winter of 2023-2024, were low (0.9ha), and therefore alarming, this number is within the range of variation (0.7-6.5ha) we might expect over the next two decades. As mentioned earlier, and in several of the Monarch Watch Blog texts, monarchs have gone through many ups and downs in the past and there are reasons to be confident that they will recover again – IF weather allows and IF the collective “WE” sustain and restore the resources that monarchs require.
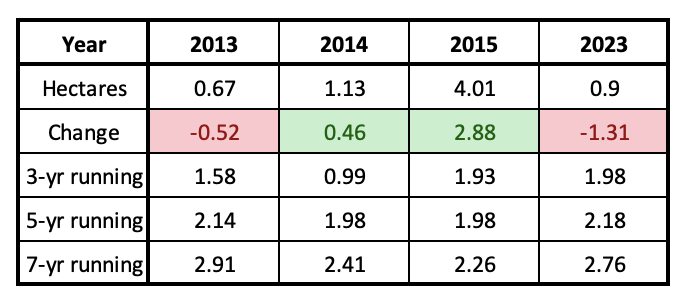
Table 2. Running averages from 2013-2015 compared with 2023.
Although there are reasons to be optimistic, there are trends in the data that are of concern. Higher than average March and September temperatures are strongly associated with years in which the population declines. Both have negative effects. High March temperatures allow monarchs to advance into higher latitudes where mortality due to late frosts kill eggs and larvae. The lower temperatures also lead to longer periods of development and older mean age to reproduction for the first-generation cohort. These effects reduce the rate of population growth. High temperatures in September slow the exodus from the northern latitudes since monarchs reduce flight when temperatures exceed 86F. High temperatures also shorten flowering periods and perhaps the availability of nectar for late monarchs. Whatever the interaction, these high temperatures are associated with years during which numbers are lower. Another concern involves a trend in higher temperatures in September and October in southern latitudes (<35N). At some point, it is likely to become so warm that larvae developing at these latitudes will no longer be able to enter diapause and migrate.
Given these trends, together with habitat losses due to intensive land use and the growth of our cities and towns, monarch numbers will gradually decline unless habitat restoration more than matches the annual loss of habitat. There is no doubt, it’s up to us to maintain the Eastern monarch migration.
Acknowledgements
The views and interpretations in this text have been shaped by conversations with many colleagues and by numerous data sets large and small provided by citizen scientists. Many insights have been gained through our tagging program at Monarch Watch. The latter has involved thousands of taggers and assistance of many. Through all of these efforts I have been ably assisted by Jim Lovett, Ann Ryan and Dena Podrebarac and many others. John Pleasants has patiently listened or read many of my views and has offered statistical advice on many occasions. My approach to monarch demography, which I only touch on in this text, is derivative of a graduate course in Insect Ecology I took at the University of Connecticut more than 60 years ago.
References
Agrawal, A. A., and Inamine, H. 2018. Mechanisms behind the monarch’s decline: Migratory failure may contribute to the dwindling of this iconic butterfly’s population. Science 360:1294-1296. doi.org/10.1126/science.aat5066.
Brower, L. P. 1995. Understanding and misunderstanding the migration of the monarch butterfly (Nymphalidae) in North America: 1857-1995. J. Lepidopterists Soc. 49, 304–385. biostor.org/reference/115918.
Brower, L. P., Taylor, O. R., Williams, E. H., Slayback, D.A., Zubeita, R. R. and Ramirez, M. I. 2012. Decline of monarch butterflies overwintering in Mexico: is the migratory phenomenon at risk? Insect Conserv. Divers, 5: 95-100. doi.org/10.1111/j.1752-4598.2011.00142.x.
Brower, L. P., Taylor, O. R. and Williams, E. H. 2012, Response to Davis: choosing relevant evidence to assess monarch population trends. Insect Conserv. Divers, 5: 327-329. doi.org/10.1111/j.1752-4598.2011.00176.x.
Cockrell B. J., Malcolm S. B., Brower L. P., 1993. Time, temperature, and latitudinal constraints on the annual recolonization of eastern North America by the monarch butterfly. Pp. 233–251 in Malcolm, S. B., Zalucki, M. P., eds. Biology and Conservation of the Monarch Butterfly. Natural History Museum of Los Angeles County, Science Series 38. link
Crone, E. E. and C. B. Schultz. 2022. Host plant limitation of butterflies in highly fragmented landscapes. Theoretical Ecology 15(17). doi.org/10.1007/s12080-021-00527-5.
Culbertson, K. A., Garland, M. S., Walton, R. K., Zemaitis, L., and V. M. Pocius. 2021. Long‐Term Monitoring Indicates Shifting Fall Migration Timing in Monarch Butterflies (Danaus plexippus). Global Change Biology. doi.org/10.1111/gcb.15957.
Faber, S., Rundquist, S. and T. Male. 2012. Plowed Under. Report. Environmental Working Group. pp 1-12. ewg.org/research/plowed-under.
Fish and Wildlife Service. Monarch Butterfly Species Status Assessment (SSA) Report. September 2020. www.fws.gov/media/monarch-butterfly-species-status-assessment-ssa-report.
Fisher, K. E., and S. P. Bradbury. 2021. Influence of habitat quality and resource density on breeding-season female monarch butterfly Danaus plexippus movement and space use in north-central USA agroecosystem landscapes. J. Applied Ecology, doi.org/10.1111/1365-2664.14061.
Flockhart, D.T. T., Wassenaar, L. I., Martin, T. G., Hobson, K.A., Wunder, M.B. and D. R. Norris. 2013. Tracking multi-generational colonization of the breeding grounds by monarch butterflies in eastern North America. Proc. R. Soc. B 280,20131087. doi.org/10.1098/rspb.2013.1087.
Grant, T.J., Perry, H. R., Zalucki, M. P., and S. P. Bradbury. 2018. Predicting monarch butterfly (Danaus plexippus) movement and egg-laying with a spatially-explicit agent-based model: The role of monarch perceptual range and spatial memory. Ecological Modelling 374:37-50. doi.org/10.1016/j.ecolmodel.2018.02.011.
Hobson, K. A., Taylor, O., Ramírez, M. I., Carrera-Treviño, R., Pleasants, J., Bitzer, R., Baum, K. A., Mora Alvarez, B. X., Kastens, J., and J. N., McNeil. 2023. Dynamics of stored lipids in fall migratory monarch butterflies (Danaus plexippus): Nectaring in northern Mexico allows recovery from droughts at higher latitudes. Conserv Physiol 11(1): coad087; doi.org/10.1093/conphys/coad087.
Inamine, H., Ellner, S. P., Springer, J. P., and Agrawal, A. A. 2016. Linking the continental migratory cycle of the monarch butterfly to understand its population decline. Oikos 125, 1081-1091. doi.org/10.1111/oik.03196.
Krannich, J. M. 2006. A Modern Disaster: Agricultural Land, Urban Growth, and the Need for a Federally Organized Comprehensive Land Use Planning Model. Cornell Journal of Law and Public Policy. 16 (1): 57. https://scholarship.law.cornell.edu/cjlpp/vol16/iss1/2
Lark, T. J., Salmon, J. M. and H. K. Gibbs. 2015. Cropland expansion outpaces agricultural and biofuel policies in the United States. Environmental Research Letters. 10(4): 044003. doi.org/10.1088/1748-9326/10/4/044003.
Lark, T. J., Spawn, S. A., Bougie, M. and H. K. Gibbs. 2020. Cropland expansion in the United States produces marginal yields at high costs to wildlife. Nature Communications, 11, 4295. nature.com/articles/s41467-020-18045-z.
Lark, T. J., Hendricks, N. P., Smith, A., Patese, N., Spawn-Leea, S.A., Bougie, M. et al. 2022. Environmental outcomes of the US Renewable Fuel Standard. Proc. Nat. Acad. Sci., 119, e2101084119. doi.org/10.1073/pnas.2101084119.
Malcolm, S. B., Cockrell, B. J., and L. P. Brower. 1993. Spring recolonization of eastern North America by the monarch butterfly: successive brood or single sweep migration? Pp. 253–267 in Malcolm, S. B., Zalucki, M. P., eds. Biology and Conservation of the Monarch Butterfly. Natural History Museum of Los Angeles County, Science Series 38. link
Malcolm, S. B., Cockrell, B. J. and L. P. Brower. 1989. Cardenolide fingerprint of monarch butterflies reared on common milkweed, Asclepias syriaca L. J Chem Ecol 15, 819–853. doi.org/10.1007/BF01015180.
Meehan, T. D. and M.S. Crossley. 2023. Change in monarch winter abundance over the past decade: A Red List perspective. Insect Conserv. Divers. 1–8. doi.org/10.1111/icad.12646.
Nielsen-Gammon, J. S., Holman, A., Buley, S., Jorgensen. J., Escobedo, C., Ott, J., Dedrick, J., and A. Van Fleet. 2021. Assessment of Historic and Future Trends of Extreme Weather in Texas, 1900-2036: 2021 Update. Document OSC-202101, Office of the State Climatologist, Texas A&M University, College Station, 44 pp. climatexas.tamu.edu/files/ClimateReport-1900to2036-2021Update
Pleasants, J. M. and K. S. Oberhauser. 2013. Milkweed loss in agricultural fields because of herbicide use: effect on the monarch butterfly population. Insect Conserv. Divers. 6, 135–144. doi.org/10.1111/j.1752-4598.2012.00196.x.
Pleasants, J. 2017. Milkweed restoration in the Midwest for monarch butterfly recovery: estimates of milkweeds lost, milkweeds remaining and milkweeds that must be added to increase the monarch population. Insect Conserv. Divers. 10, 42-53. doi.org/881 10.1111/icad.12198.
Pleasants, J., Thogmartin, W.E., Oberhauser, K.S., Taylor, O.R. & Stenoien, C. 2024. A comparison of summer, fall and winter estimates of monarch population size before and after milkweed eradication from crop fields in North America. Insect Conserv. Divers. 17(1), 51–64. doi.org/10.1111/icad.12687.
Ries, L., Taron, D.J. & Rendón-Salinas, E. 2015. The disconnect between summer and winter monarch trends for the eastern migratory population: possible links to differing drivers. Ann. Ent. Soc. Amer., 108, 691–699. doi.org/10.1093/aesa/sav055.
Russell, E. W. B. 1983. Indian Set Fires in the Forests of the Northeastern United States. Ecology, Vol. 64, #1 (Feb): 78–88. doi.org/10.2307/1937331.
Seiber, J. N., Brower, L. P., Lee, S. M. et al. 1986. Cardenolide connection between overwintering monarch butterflies from Mexico and their larval food plant, Asclepias syriaca . J Chem Ecol 12, 1157–1170. doi.org/10.1007/BF01639002.
Stewart, O. C., Lewis, H. T. and M. K. Anderson (eds.). 2002. Forgotten Fires: Native Americans and the Transient Wilderness. Norman, OK: University of Oklahoma Press. 364 pages. oupress.com/9780806140377/forgotten-fires
Taylor, O. R. Jr., Pleasants. J. M., Grundel, R., Pecoraro, S. D., Lovett, J. P. and A. Ryan. 2020. Evaluating the Migration Mortality Hypothesis Using Monarch Tagging Data. Front. Ecol. Evol. 8:264. doi.org/10.3389/fevo.2020.00264.
Taylor, O. R. 2004. Status of the population. Monarch Watch Update, 16 February 2004.Monarch Watch, Lawrence, Kansas. monarchwatch.org/update/2004/0318.html#4.
Taylor, O. R. 2021. Monarch population crash in 2013
monarchwatch.org/blog/2021/06/11/monarch-population-crash-in-2013/
Taylor, O. R. 2023A. Monarchs: Weather and population sizes in the past
monarchwatch.org/blog/2023/07/21/monarchs-weather-and-population-sizes-in-the-past/
Taylor, O. R. 2023B. Monarch populations during the Dust Bowl years
monarchwatch.org/blog/2023/07/17/monarch-populations-during-the-dust-bowl-years/
Taylor, O. R. 2023C. The Western monarch puzzle: the decline and increase in monarch numbers
monarchwatch.org/blog/2023/05/29/the-western-monarch-puzzle-the-decline-and-increase-in-monarch-numbers/
Taylor, O. R. 2023F. Species Status Assessment and the three r’s. Monarch Watch Blog.
monarchwatch.org/blog/2023/10/13/species-status-assessment-and-the-three-rs
Taylor, O. R. 2024. The curvilinear monarch: How weather drives the numbers of monarch butterflies (in prep).
Thogmartin, W. E., López-Hoffman, L., Rohweder, J., Diffendorfer, J., Drum, R., Semmens, D., Black, S., Caldwell, I., Cotter, D., Drobney, P., Jackson, L., Gale, M., Helmers, D., Hilburger, S., Howard, E., Oberhauser, K., Pleasants, J., Semmens, B., Taylor, O. and R. Wiederholt. 2017. Restoring monarch butterfly habitat in the Midwestern US: ‘All hands on deck.’ Environmental Research Letters 12: 074005. doi.org/10.1088/1748-9326/aa7637.
Thogmartin, W. E., Szymanski, J, A., and E. L. Weiser. 2020. Evidence for a Growing Population of Eastern Migratory Monarch Butterflies Is Currently Insufficient. Frontiers in Ecology and Evolution 8:43. doi.org/10.3389/fevo.2020.00043.
Filed under Monarch Population Dynamics | Comments Off on Is the eastern monarch population continuing to decline?


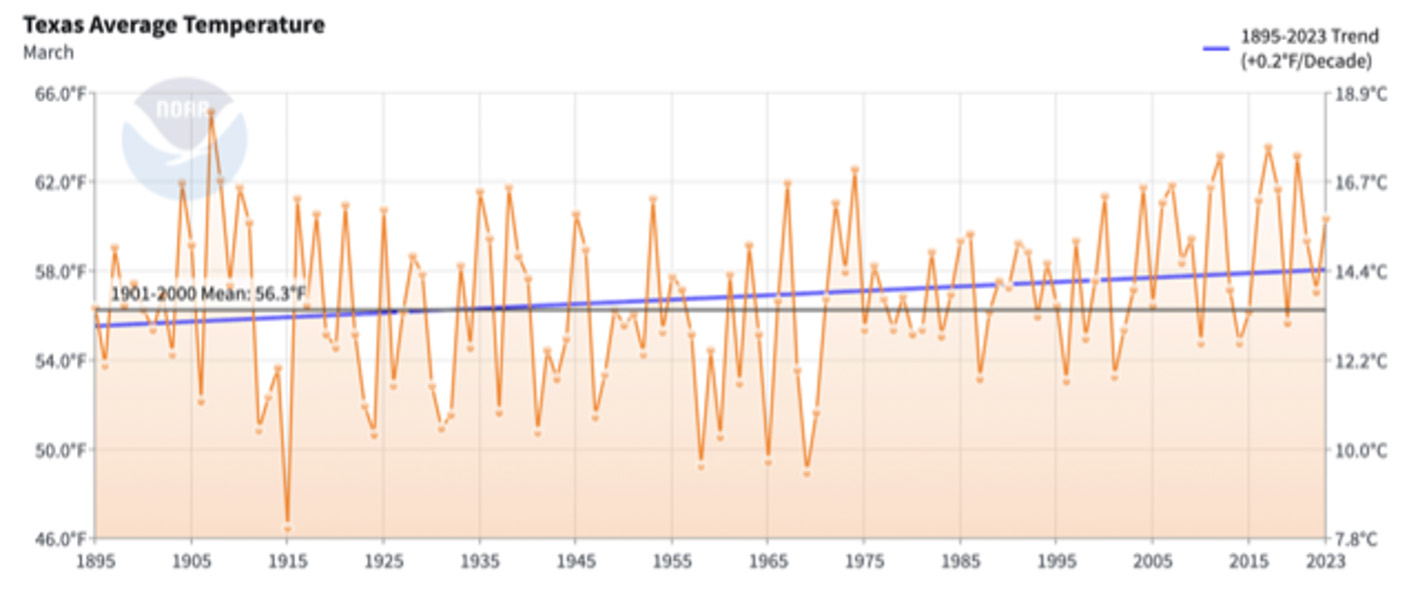
 You are an important part of our team as well. Your interest shows that you are aware of the need to sustain the monarch migration, and that means advocacy for all measures that can be taken to increase monarch numbers. Stated simply, we need to get plants in the ground – specifically milkweeds and nectar plants that support the breeding population and fall nectar plants that support the migration. The challenge is substantial and difficult to navigate. The climate is changing; we can see that in the data. March temperatures in Texas are becoming too warm, allowing monarchs to fly too far north too soon. In addition, high September temperatures are slowing the migrations, leading to fewer monarchs reaching the overwintering sites in Mexico. These sites also face threats due to droughts, beetle damage and illegal logging. While there is not much we can do to counter some threats, we can create Monarch Waystations, restore habitats, and inspire stewardship in the younger generations. These actions represent our mission at Monarch Watch, and we are grateful for your continued support.
 Monarchs have a remarkable annual cycle – a breeding season in the U.S. and Canada and a non-breeding season as they overwinter for 5 months in Mexico. In effect, every year is the same, yet every year is different due to weather and other factors that influence reproductive success. We have a similar rhythm at Monarch Watch. Winter is spent catching up, writing, and planning for the next season, including our Spring Plant Fundraiser. Late spring and summer we work with nurseries to distribute milkweeds. Fall is all about tagging and public events and later seed collecting and processing followed by planning the number of milkweeds to be grown the next year.
 So, while it might be said that each year is the same, they are all different – even more so this year. As you may remember, last year Founding Director Chip Taylor announced that he would be stepping away from the day-to-day operations of Monarch Watch to focus on writing and other projects. We are pleased to announce that the need for a new director has been met. Dr. Kristen Baum, known for her research on monarchs and pollinators, joined us at the end of October and we are still in the process of making the transition. Kristen’s first task as Director of Monarch Watch was to put together a five-year review of our activities. That took some time and a lot of digging into records and memories which enabled Kristen to get up to speed rapidly.
 Monarch Waystations. We added more than 4,200 Monarch Waystations, bringing the total to over 46,000 registered sites. Our minimal target for next year is 50,000. Supporters can help by encouraging others to register and display our signs. If you see a sign in a prominent place, send us a photo – and a photo of your own Monarch Waystation as well! Share via
 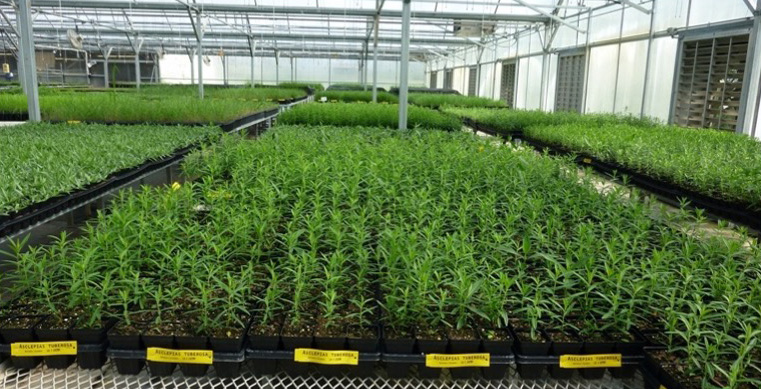 Monarch Habitat. We worked with five nurseries to produce and distribute 156,000 regionally appropriate milkweed plugs in 2023. Free milkweeds were sent to 200 schools and non-profits and to those managing restoration projects in the Midwest, Texas, and California. Many were also distributed through our Milkweed Market. We could do much more if there was additional funding to support milkweed production and distribution.
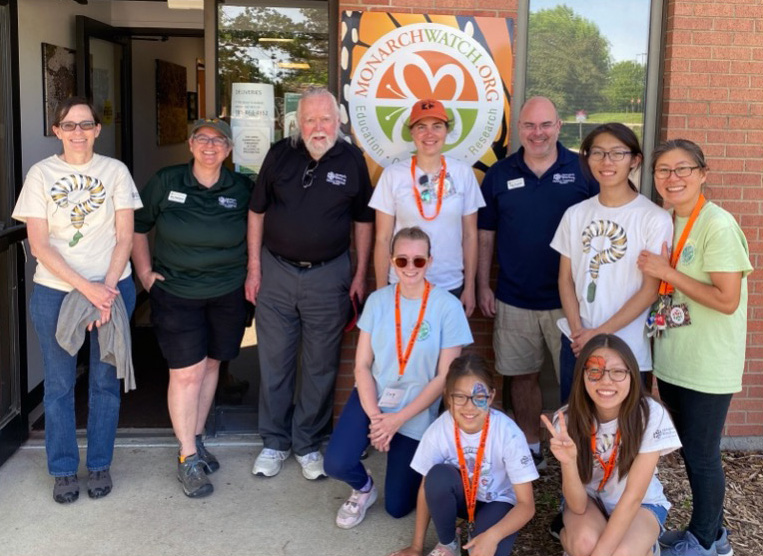
 Public Events. Thanks to everyone who joined us for our free public events in the spring and fall. These family events are both fun and informative. This year the tagging event at the Baker University Wetlands Discovery Center attracted over 400 people. It was a great day, and 577 monarchs were caught, tagged, and released. We hope you will join us when we hold these events next year – Spring Open House & Plant Fundraiser (May 11); Fall Open House (September 14); Fall Tagging Event (September 21).
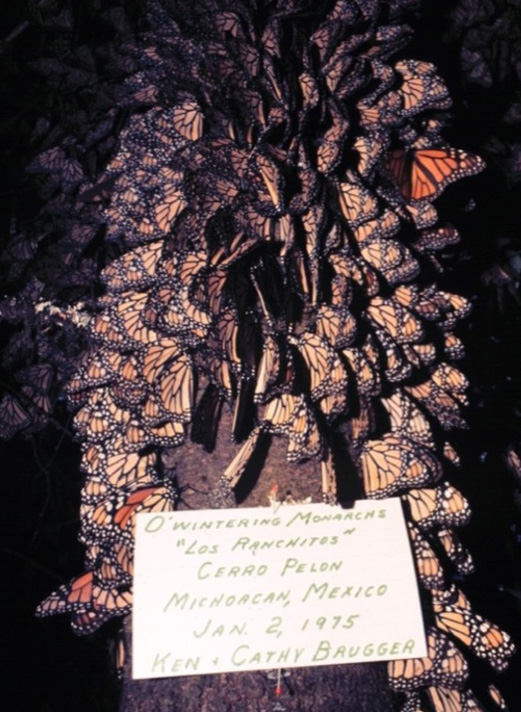 After the findings were announced, Fred and Ken were widely lauded for the achievement; however, it is now clear that Catalina played a significant role in these discoveries. The “one last thing” in this case is the magnificent feature on monarchs in the January 2024 issue of National Geographic. The article is something of a commemoration of the events in early 1975. The photography by Jaime Rojo is extraordinary and the text by Michelle Nijhuis provides a glimpse of the diverse ways many scientists, conservationists and thousands of individuals are engaged with monarchs. It’s a far cry from the singular efforts by Fred and Norah Urquhart to answer a question that had lingered since the days of C. V. Riley and others in the 1860s. The question for more than 100 years was where and how monarchs spend the winter. Now, a mere fifty years later, the question has become How can we sustain the monarch migration?
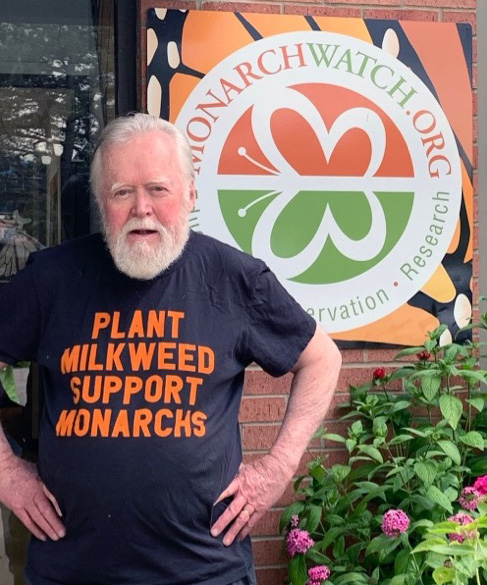 In 1992, I started a small monarch tagging project with the help of Brad Williamson, a local high school science teacher. That project attracted the attention of the public and led to the creation of Monarch Watch. Although we characterized Monarch Watch as focused on education, conservation, and research, in the early years, most of our efforts involved educational outreach and research. My thought at the time was that conservation would take care of itself. I was wrong. That became apparent when I received an email from a farmer in Nebraska in 2004 who informed me that the new genetically modified crop lines he had adopted were leading to the loss of milkweeds in his corn and soybean fields and that in turn was reducing the number of monarchs on his farm. Alarmed at this news, I knew we had to shift our emphasis to conservation. Although struggling financially at the time, we decided to start the Monarch Waystation program in 2005. The program has grown, and we now have over 46 thousand registered sites. Once we became more financially secure, we began to work with nurseries to produce milkweeds that could be used in these Monarch Waystations and for restoration.
 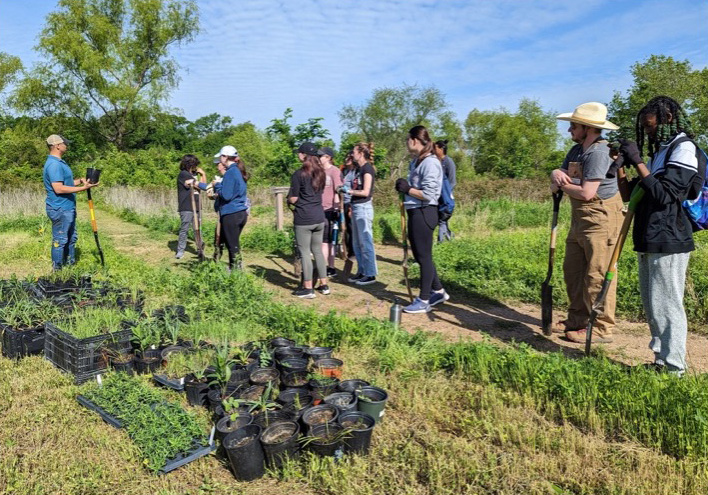 Although educational outreach and research continue, our main focus has become monarch and pollinator conservation. Over the years, we have facilitated the growth and distribution of over 1 million milkweed plugs. We were the first organization to step into this role and are proud of these efforts.