Monarch Population Status
Wednesday, January 4th, 2023 at 11:35 am by Chip TaylorFiled under Monarch Population Status | Comments Off on Monarch Population Status
Status of the eastern monarch population (as of December 2022)
I’ve said it before, but it bears repeating. Monarch numbers each season are largely due to the timing and numbers from one stage in the annual cycle to the next. Habitat availability, which comes down to the abundance and distribution of milkweeds as well as the nearby sources of nectar, sets the upper limit for monarch numbers. More habitat means more monarchs if the temperatures and rainfall throughout the year are close to the long-term averages. However, the conditions are seldom, if ever, optimal. So, the task, for those of us developing stage specific models for wildlife, is to determine how birth rates and death rates are affected within each stage that determines the number entering the next stage.
The monarch annual cycle can be broken down into six stages: overwintering from November to April, migrating back to the US late February to April, breeding from March to May by returning monarchs, first generation recolonization of the summer breeding areas north of 40N, summer breeding from May to September and migration from August to December.
The area of the forests with monarchs this winter is going to be low – probably one of the all-time low numbers – close to, if not below, 1 hectare (2.47 acres). I could see that the numbers would be down this year as early as late May and nothing happened through the rest of the season to change that assessment.
So, what happened from stage to stage this year? I’ll give you my interpretations with the caveat that the information available on what happened during several stages is either non-existent or inadequate.
Overwintering – November-April.
While the number of hectares of trees with monarchs at the overwintering sites has been recorded every year since 1994, there is no comprehensive understanding of the mortality that occurs each winter. It is known that colonies decline in size through the winter, but whether these declines are associated with offsite mortality or the movement of overwintering colonies is not clear. The only times mortality has been estimated for the majorities of colonies is following major catastrophic events after winter storms (2002, 2004, 2010, 2016). One might think that tag recovery rate would be a good measure of winter mortality. That is surely the case for years with strong winter storms and may apply to other years as well, but overall winter mortality does not appear to be a major determinant of population size from one year to the next.
Migrating North – February-April.
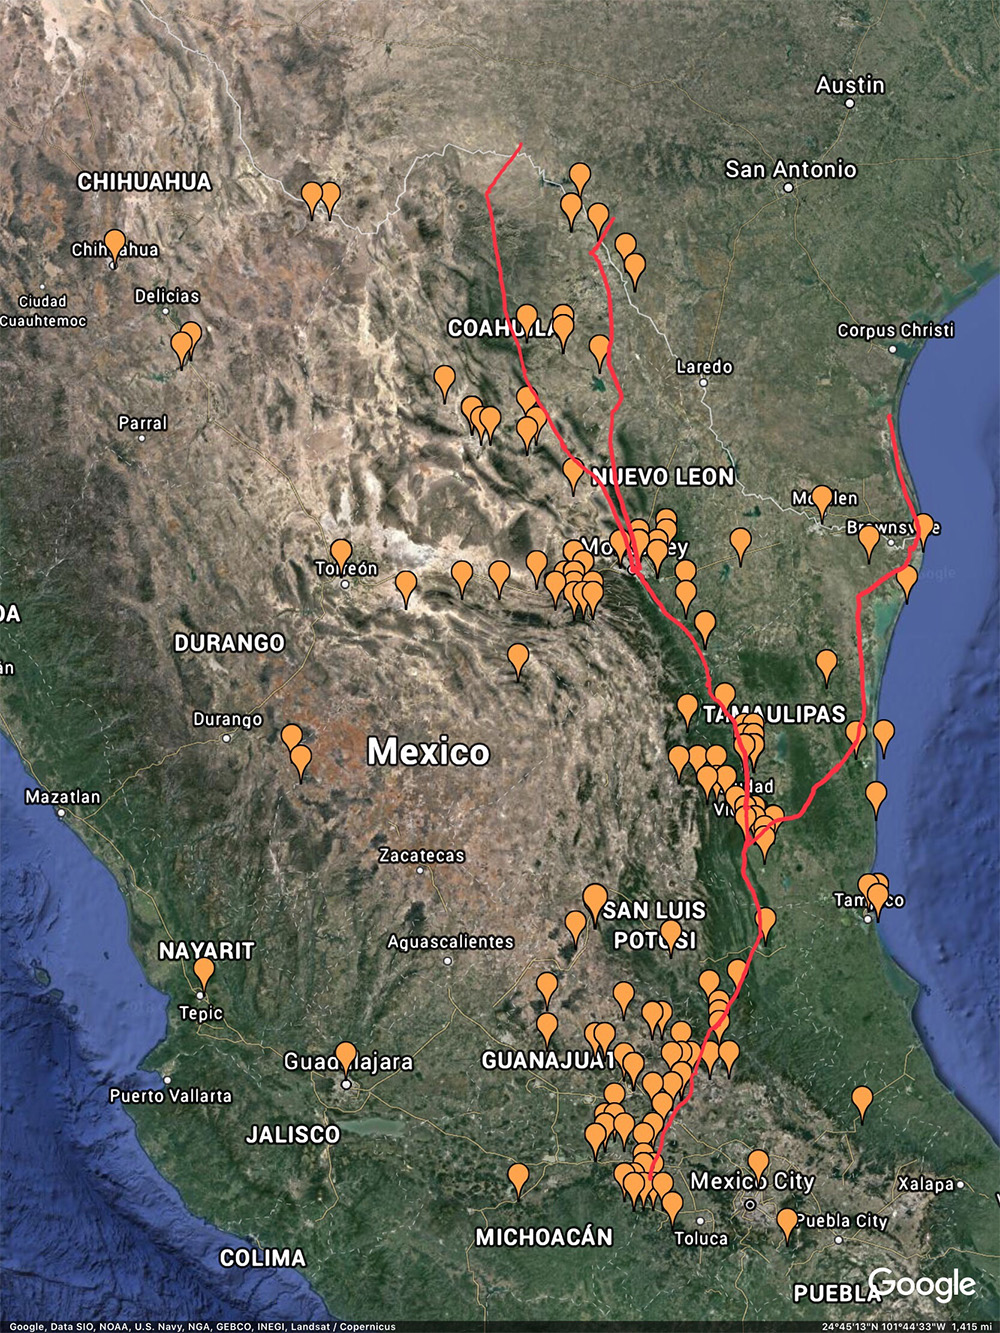
The mortality during the traverse from the overwintering sites to Texas could vary substantially from one year to another due to droughts, excessively high temperatures or a lack of nectar. Monarchs utilize two routes to reach Texas, Figure 1. One, a coastal route of about 600 miles used early in March when temperatures are moderate. This route appears to shut down when the temperatures in Tamaulipas are in the 90s and higher, which is often the case by mid-March. The second, and cooler, route follows the mountains to the north toward Ciudad Victoria and then NW toward Monterrey with a crossing into Texas that takes the monarchs through the Edwards Plateau into central Texas. This route is about 800 miles and essentially duplicates the route of most of the fall migrants. Unfortunately, there is no systematic monitoring of the conditions along these routes. So, what happens from year to year along these pathways and how those conditions impact the proportions of the returning monarchs that reach Texas is unknown.
Figure 1. Spring first sightings reported for Mexico to Journey North. These records suggest monarchs use two pathways to reach the breeding grounds in Texas and beyond.
Fortunately, there is a record of first sightings for the last 23 years thanks to the reporting to Journey North and the leadership of Elizabeth Howard and Nancy Sheehan who have managed that project. To determine if the first sightings tell us something about the timing and number of monarchs arriving from Mexico in the spring, we have compiled all the first sightings from 1March through 30 April for each year. The medians range from 13 March to 2 April and both high and low overwintering numbers followed these early and late median arrivals. The overall, mean is 22 March and the median for 2022 was 25 March.
The numbers recorded each year are also hard to interpret since the number of first sightings reported in Texas has increased over the years from 37 in 2000 to 343 in 2021. Again, there are years when low and high numbers of arrivals are followed by increases and decreases in monarch numbers. Although more digging in the data is warranted, the results suggest that the timing and number of monarchs arriving from Mexico is not a major factor in determining the numbers in most overwintering periods.
Reproduction by returning migrants – March-April.
So, if the timing and numbers of monarchs from Mexico is seldom a factor, that suggests several things. First and second, overwintering mortality is also not a driver in most years nor is the traverse from the overwintering sites to Texas. There are probably years (e.g., 2004) when one or the other or both are important, but that appears to be uncommon relative to other factors that determine end of year numbers.
The temperatures in Texas in March and April have significant impact in determining the size of the population at the end of the cycle. Of the 22 years in the record, the population increased in 10 years and decreased in 12. In 9/10 years with increases, the mean temperatures for Texas were less than +2.5F above the long-term average. The exception to this trend was 2006, a year with a mean temperature for March and April of +5.3F. The number of hectares the following winter increased from 5.92 to 6.87. The explanation for the increase appears to be due to two things: the earliest arriving cohort from Mexico (median = 13 March) and the highest temperatures for April (+5.8F above average) in the entire record from 1895 to the present. The Journey North map of first sightings for the spring of 2006 suggests that early arrival combined with egg laying concentrated in Texas and southern Oklahoma, followed by high April temperatures, led to the rapid development of the larvae and a large cohort of first-generation offspring. These offspring effectively colonized the summer breeding range north of 40N with >75% of the sightings recorded from 21 to 30 May. In contrast to the increases, the population decreased in 6/7 years in which the mean temperatures were in excess of 2.5F. The exception being 2006. For the other 6 years, other factors account for the decreases. For example, decreases followed the two coldest June-August periods (2004, 2009) and late recolonizations north of 40N account for low numbers in 2013 and 2019. The declines of 2002 and 2007, which should have been increases based on March/April temperatures, remain unexplained.
First generation colonization of the summer breeding range north of 40 North
First generation monarchs, mostly originating from eggs laid by monarchs returning from Mexico in Texas and Oklahoma, begin migrating north in the last week of April. This migration appears to continue until the difference in daylength from one day to the next drops below one minute per day at each latitude (https://monarchwatch.org/blog/2022/04/22/monarch-puzzle-wrap-up/). This result indicates that the migration northward stops progressively from south to north with the last of the migration stopping on or about 12 June at 50N.
Applying the dictum that it is timing, numbers and weather that mostly determines the number of monarchs transitioning from one stage to another produced some interesting results. We summarized all the first sighting for longitudes north of 40N latitude. I’m going to refer to the areas defined by 100-90W and 90-80W bounded by latitudes 50 to 40N. These two areas account for about 90% of the recoveries of tagged butterflies in Mexico. The interval for these first sighting is from 1 May to 9 June, a 40-day period divided into 10-day intervals. When we tallied the first sightings for the 23-year interval, two years stood out: 2012 and 2013. In 2012, 92% of the first sightings occurred from 1-20 May while in 2013 only 5% of the first sightings occurred during that interval. The numbers of sightings in 2012 was >2x the number in 2013. The expectation therefore was that the population in 2012 would increase, but it declined. The starting numbers in 2013 also resulted in a decline leading to the conclusion that arriving in the northern breeding areas too soon (2012), perhaps before milkweed is available, or too late (2013), resulting in a delay in starting the summer breeding, can both result in a decline in the size of the migration and the overwintering population. Looking at these two extremes, it seemed appropriate to ask whether there is an optimal time of arrival in the northern breeding areas. Perhaps there is, but that is not evident in the data. There are at least two complications: the phenology of the milkweeds and nectar sources varies from year to year, and the weather after arrival can have a strong impact on the outcome. That’s what happened this year. Fifty-four percent of the first sightings were recorded from 1-20 May, and the numbers were good. Most of the monarchs were sighted during a warm period from 8-20 May. Cold weather followed for 4-7 days over a broad area during which the temperatures were too low most days for egg laying, mating or foraging for nectar. Once I became aware of that, I knew the population would be lower at the end of the season. Populations grow best when egg laying is not interrupted. Delays result in attrition of adults and the ability to continue producing eggs declines with age.
In putting this summary together, I looked for other factors that could explain why the numbers in the migration were low. Although there were a number of complaints of high temperatures and drought conditions from a number of places in the Midwest, scans of the temperatures and rainfall amounts failed to confirm either were extreme. Nor were there other explanations for the low numbers. So, the best I can offer is the likelihood that the interrupted reproduction in the 4th week of May accounts for the low migration and what seems certain to be a low overwintering population.
The Fall Migration – a traverse from 50N to 19.5N beginning in early August and ending in early December.
To assess the success of each migration, I try to determine the lateness of the migration, the numbers tagged, the number and sizes of the roosts reported to Journey North and whether there are drought conditions along the route. I also monitor weather conditions since extremes determine migratory success.
Monarchs tagged late in the season have a much lower chance of reaching the overwintering sites than those tagged early. The same applies to entire migrations. Migrations can be delayed by extremely high or low temperatures, strong headwinds and delayed development of the last generation due to late arrival of monarchs colonizing the breeding areas in May and June.
We also know that the numbers tagged is correlated with the size of the overwintering population. The number of roosting sites and estimates of the numbers per roost can also be useful. Extreme high or low numbers are informative, but intermediate numbers may or may not predict overwintering numbers. We also know that droughts contribute significantly to monarch mortality.
We will have to wait until the tagging data is analyzed to determine if there was more late tagging than usual this year, but that seems unlikely given how the season progressed during June through August. Also, although the temperatures were higher than the long-term averages during September in the Midwest Region and October in the South Region, there are no indications the migration was substantially delayed by the weather.
The temperatures in the vicinity of the overwintering colonies for the last 4 days of Oct, a period during which monarchs are usually spotted in the area, were quite cold and evidently delayed the arrival of the leading monarchs. However, some monarchs appeared near El Rosario on the first of November just in time for the Day of the Dead on the following day. Monarchs were slow to form clusters through November and remained quite scattered in the El Rosario area until late in the month. Whether this scattering will affect the measurements of colonies in early December remains to be seen.
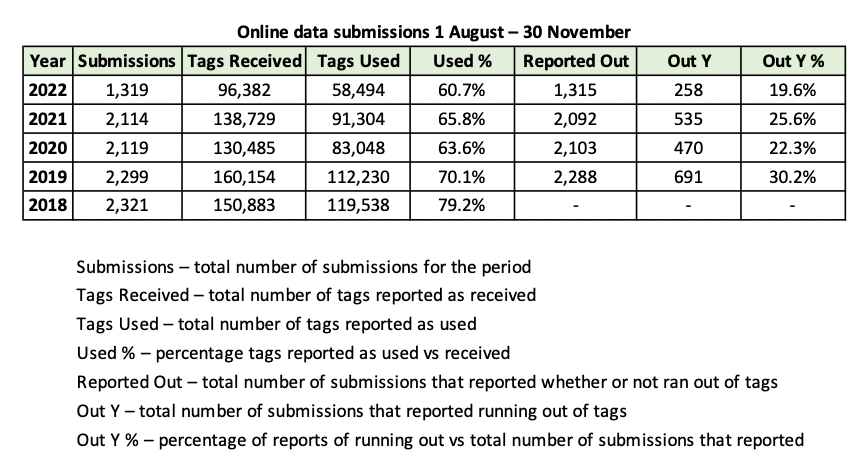
The numbers tagged from 1 August to the end of the season and submitted by 30 November 2022 were only 64% of the number tagged in 2021 (54K/91K), Table 1. This figure could change as more data are received, but since numbers tagged are correlated with overwintering numbers, this result suggests that overwintering numbers will be substantially lower than those of the previous 4 years.
Table 1. A summary of the number of monarchs tagged from 1 August to the end of the season for records submitted by 30 November.
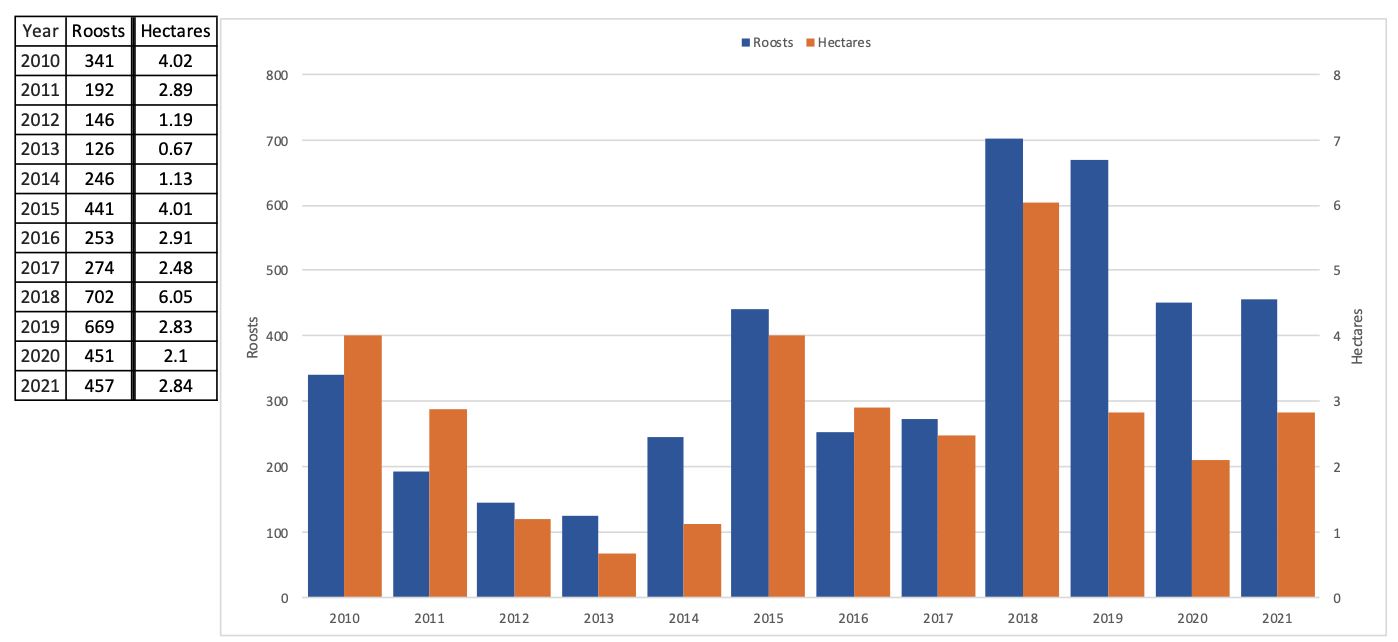
The number of temporary roosts reported to Journey North was also the lowest of the last 5 years, again suggesting lower numbers this winter, Table 2. Although roost numbers and colony numbers appear to be correlated p=0.01, a deeper dive into these data that eliminates roosts west of the continental divide and Mexico, as well as the roosts with single butterflies, or an analysis of roosts by latitude and longitude could produce different results. The numbers per roost could also affect the interpretation.
Table 2. Fall roosts as reported to Journey North, (maps.journeynorth.org/map/?map=monarch-roost-fall&year=2022).
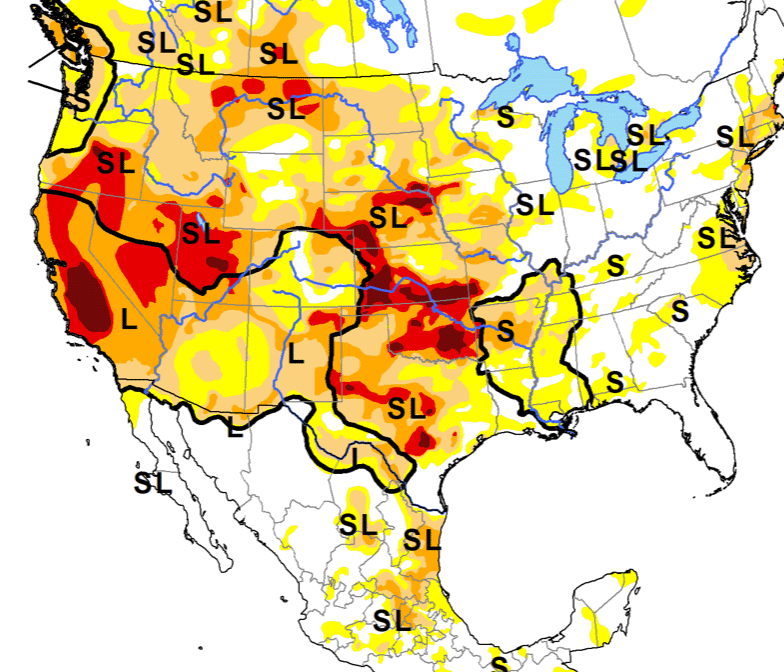
Droughts, such as those of 2000 and 2011 that limit the amount of flowering and therefore nectar available to migrating monarchs, can have a significant impact on the number reaching the overwintering sites. There were areas of exceptional drought in portions of southern Kansas, Oklahoma and Texas and severe drought much of the migratory route in northern Mexico, Figure 1. How successful monarchs were in locating nectar under these conditions has yet to be determined, but all past measures of greenness suggest that the conditions this fall probably limited the number of monarchs reaching the overwintering sites.
The above is my rationale for saying at the outset that the area occupied by overwintering monarchs would be close to, if not below, 1 hectare (2.47 acres). As always, these predictions are a test of the value of the metrics and/or how they are applied to the question. This stage-specific approach reveals massive data gaps and shows us how little we know about monarch demography. This approach also allows us to see that not everything is linear. There are many optima to consider (see Why monarchs are an enzyme). For example, populations decline if the growing season temperatures are too high or too low and grow substantially when the temperatures are close to the long-term average. Arriving early in breeding grounds can get the population off to a good start (2006) or a bad start (2012) depending on the availability of milkweeds and nectar sources and the weather conditions that follow (2022). Lastly, a comprehensive demographic approach to the entire annual cycle will help us avoid interpretative leaps that are misleading or just flat-out wrong.
Figure 1. North American Drought Monitor 30 September 22
Acknowledgements
Much of this analysis is based on the use of the first sightings data assembled by Journey North. These data help define the timing of the stages and the variations from year-to-year help define how weather and the conditions from one stage to another determine population growth. Janis Lentz worked up the data on the first sighting for both Texas and the monarchs colonizing the summer breeding range. She also assisted with my grammar, punctuation and sentence structure. (She doesn’t like long sentences). Jim Lovett provided technical assistance.
Suggested Reading
Taylor, O.R., Lovett, J.P, Gibo, D.L., Weiser, E.L., Thogmartin, W.E., Semmens, D.J., Diffendorfer, J.E., Pleasants, J.M., Pecoraro, S.D., and Grundel, R. (2019). Is the timing, pace and success of the monarch migration associated with sun angle? Frontiers Ecology Evolution. published: 10 December 2019 doi: 10.3389/fevo.2019.00442
Taylor, O.R., Pleasants, J.M., Grundel, R., Pecorraro, S.D, Lovett, J.P, and Ryan, A. (2020) Evaluating the migration mortality hypothesis using monarch tagging data. Front. Ecol. Evol. | doi: 10.3389/fevo.2020.00264
Taylor, O. R. (2020). Why monarchs are an enzyme – Part 1
monarchwatch.org/blog/2020/02/10/why-monarchs-are-an-enzyme-part-1/


Sorry, comments for this entry are closed at this time.