Does tagging harm monarchs?
18 July 2025 | Author: Kristen BaumWe receive lots of inquiries about monarchs every year, and this is the time of year when we start receiving questions about tagging, including if tagging can harm monarchs. We conducted an experiment last summer to compare survival of tagged and untagged monarchs, and we found no difference in survival for males or females. A detailed summary of that project can be found below. We also wanted to take this opportunity to answer other frequently asked questions about monarchs and the tagging process.
Catching and Tagging Monarchs
We receive questions from people who are concerned about potentially injuring a monarch when catching it for tagging. Monarch Watch has hosted public tagging events for more than 20 years, and my research lab has tagged over 6,000 monarchs since 2015. Injuring a monarch while catching it is a rare occurrence, especially with the sweep/swoop-and-flip (also referred to as the swish/flick) method. If you use the flop-and-lift method, be careful not to pull the butterfly through vegetation when removing it from the net. If you catch a monarch that you are concerned about (e.g., damaged wings, small size), let it go without tagging it.
Transferring Ophryocystis elektroscirrha Spores when Tagging
We also get asked about the spore-forming protist Ophryocystis elektroscirrha and, in particular, the possibility of transferring spores during the tagging process. While it’s certainly possible that spores can be transferred between butterflies by handling an infected individual and then handling an uninfected one, monarchs can’t acquire an infection at the adult stage. Spores are the most heavily concentrated on the abdomen, but they’re also present on the wings and on other parts of the body.
Spores acquired during the tagging process would primarily be transferred from wings to wings, where spores are less concentrated. Furthermore, spores transferred during tagging would need to remain on the adults for the remainder of their fall migration to the overwintering sites in Central Mexico, through the winter, and through the return migration to Texas in the spring, and then come in contact with milkweed leaves (or the outside of monarch eggs, since newly hatched caterpillars typically eat their eggshells) that are then consumed by monarch caterpillars. Spring migrants are typically pale and tattered and have lost many scales, which would also likely result in the loss of spores.
While it seems unlikely that many infections would occur this way, it is possible, and this is a challenging question to address experimentally. Given the extremely small proportion of the monarch butterfly population that is tagged each year, it seems unlikely this would negatively impact the population.
The Value of Tagging Monarchs
We typically distribute approximately 300,000 tags each fall to thousands of participants who tag more than 100,000 monarchs during the migration. If one considers the monarch overwintering population size was 1.79 hectares this past winter, or 37,769,000 monarchs (assuming 21.1 million monarchs per hectare), and that a majority of monarchs that start the migration don’t make it to the overwintering sites, then the number tagged is likely much less than one-tenth of 1 percent. Thus, we think the value of tagging outweighs any potential negative impacts and that those negative impacts are likely to be minimal. Tagging has revealed new information about where the overwintering monarchs come from, the timing and pace of the migration, the differences among regions, the impact of weather on the migration, and many other factors.
There’s still much to learn about monarchs and their migration, especially as monarchs respond to shifting conditions related to climate change and habitat loss. We need more research to support monarch conservation and identify approaches for addressing current and future issues, and tagging is an important piece of that puzzle.
Tag Monarchs This Fall
As the 2025 tagging season approaches, consider joining us in tagging monarchs this year. A tagging kit, net, and other monarch supplies are available in the Monarch Watch Shop, and we’ll begin shipping tagging kits in late July.
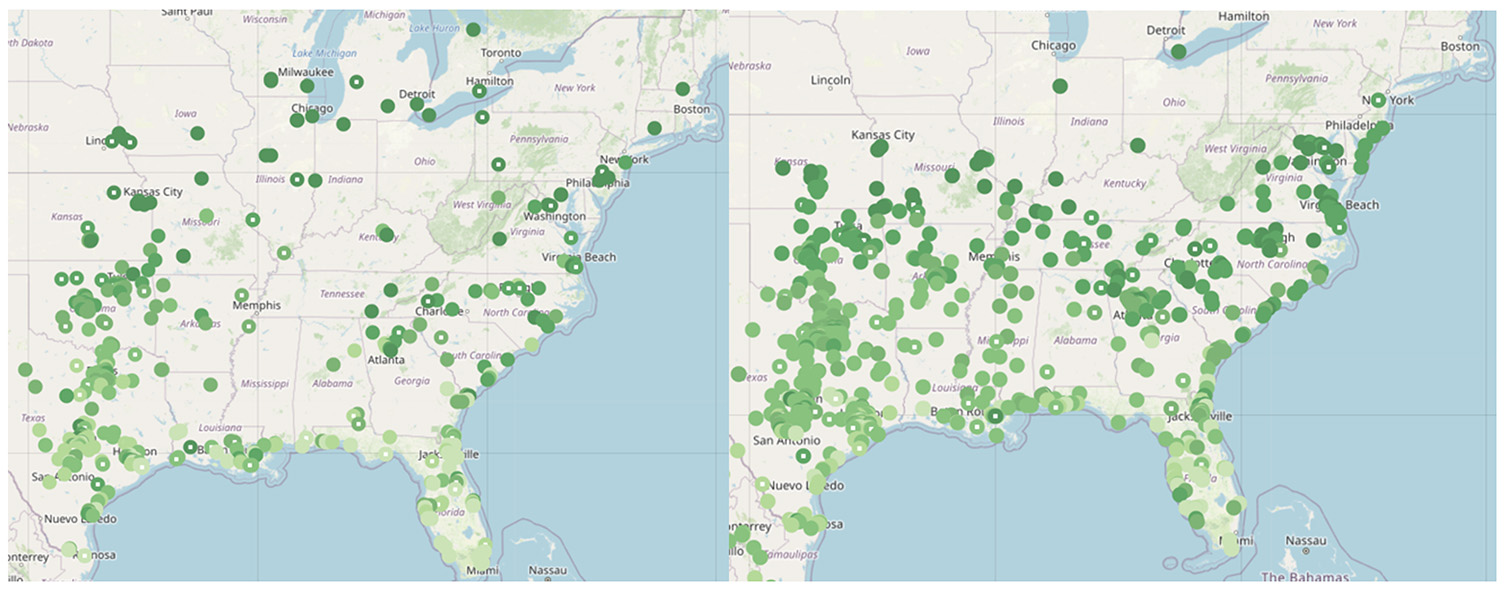
You can also report tag recoveries. “Domestic” recoveries are tagged monarchs that are observed during the fall migration in the United States, Canada, and northern Mexico. We receive pictures and tag codes to document these “domestic” recoveries, and this gives us information on how long monarchs are staying in an area or how far they travel during different time windows of the fall migration. Sightings of tagged monarchs may be submitted via the Monarch Watch mobile app or Tagging Program page. Sightings may include monarchs tagged by others as well as monarchs you tagged that are still around the next day or days later.
Every chance you get, share your passion for monarchs and their incredible fall migration with others!
Tagging Survival Experiment
Monarch Watch’s tagging program began in 1992, with the circular tags that we currently use adopted in 1997. Each circular tag contains a unique letter-and-number code printed with permanent ink on all-weather stickers. We ran out of combinations of our three-letter-and-three-number codes, so we added a fourth letter in 2019, at which time we also reduced the amount of text on the tag. Each tag is approximately 8.95 mm in diameter and weighs about 0.008 g. A monarch weighs approximately 0.5 g, so the tag is about 1.6% of its body weight. We occasionally receive questions about whether the tags affect monarch survival, so we conducted an experiment last summer to evaluate if survival differs between tagged and untagged monarchs.
The Set Up
We reared 266 monarchs using standard protocols for rearing individuals to maintain our monarch colonies at Monarch Watch. Monarchs eclosed (emerged from their chrysalises) between July 14 and July 21, 2024. The date that each individual eclosed was marked on the discal cell of the left hind wing with an ultra-fine felt-tip marker. One-half of each sex also received a Monarch Watch tag on the discal cell of the right hind wing, while the other half didn’t receive a tag. All tags were applied by me (K. Baum), with light pressure applied to the tag for a few seconds to ensure it adhered to the wing.
Monarchs were placed in one of two large walk-in cages (1.8 x 1.8 x 1.8 meters; Figure 1). One cage contained females and one cage contained males, with the sexes separated to reduce the impacts of mating activity on survival, although males will attempt to mate with other males. The cages were located in the Monarch Watch “bio house” on the University of Kansas’ West Campus in Lawrence, Kansas. The “bio house” is an open-air hoop house covered with 63% shade cloth.
Monarchs were misted with water once daily, except on days when there was already moisture in the cages from rain. Monarchs were provided with a 15% sucrose solution and allowed to feed as needed (Figure 1). Nectar was located in 10 dishes in each cage, which were elevated to increase use by monarchs. Each dish contained a plastic scrubber to allow the monarchs to easily feed. Nectar was replenished daily, as needed, and replaced every 10 to 14 days. Following rain events, the concentration of the sugar solution was checked to ensure it was at 15% or above and replaced if needed. Blooming potted plants (lantanas and pentas) were placed in each corner of the cages and watered as needed. Dead monarchs were collected daily between 8 a.m. and 10 a.m. CDT and the date of collection recorded. By the conclusion of the experiment, three tags were recovered from the male cage, and all other tags were accounted for on dead butterflies
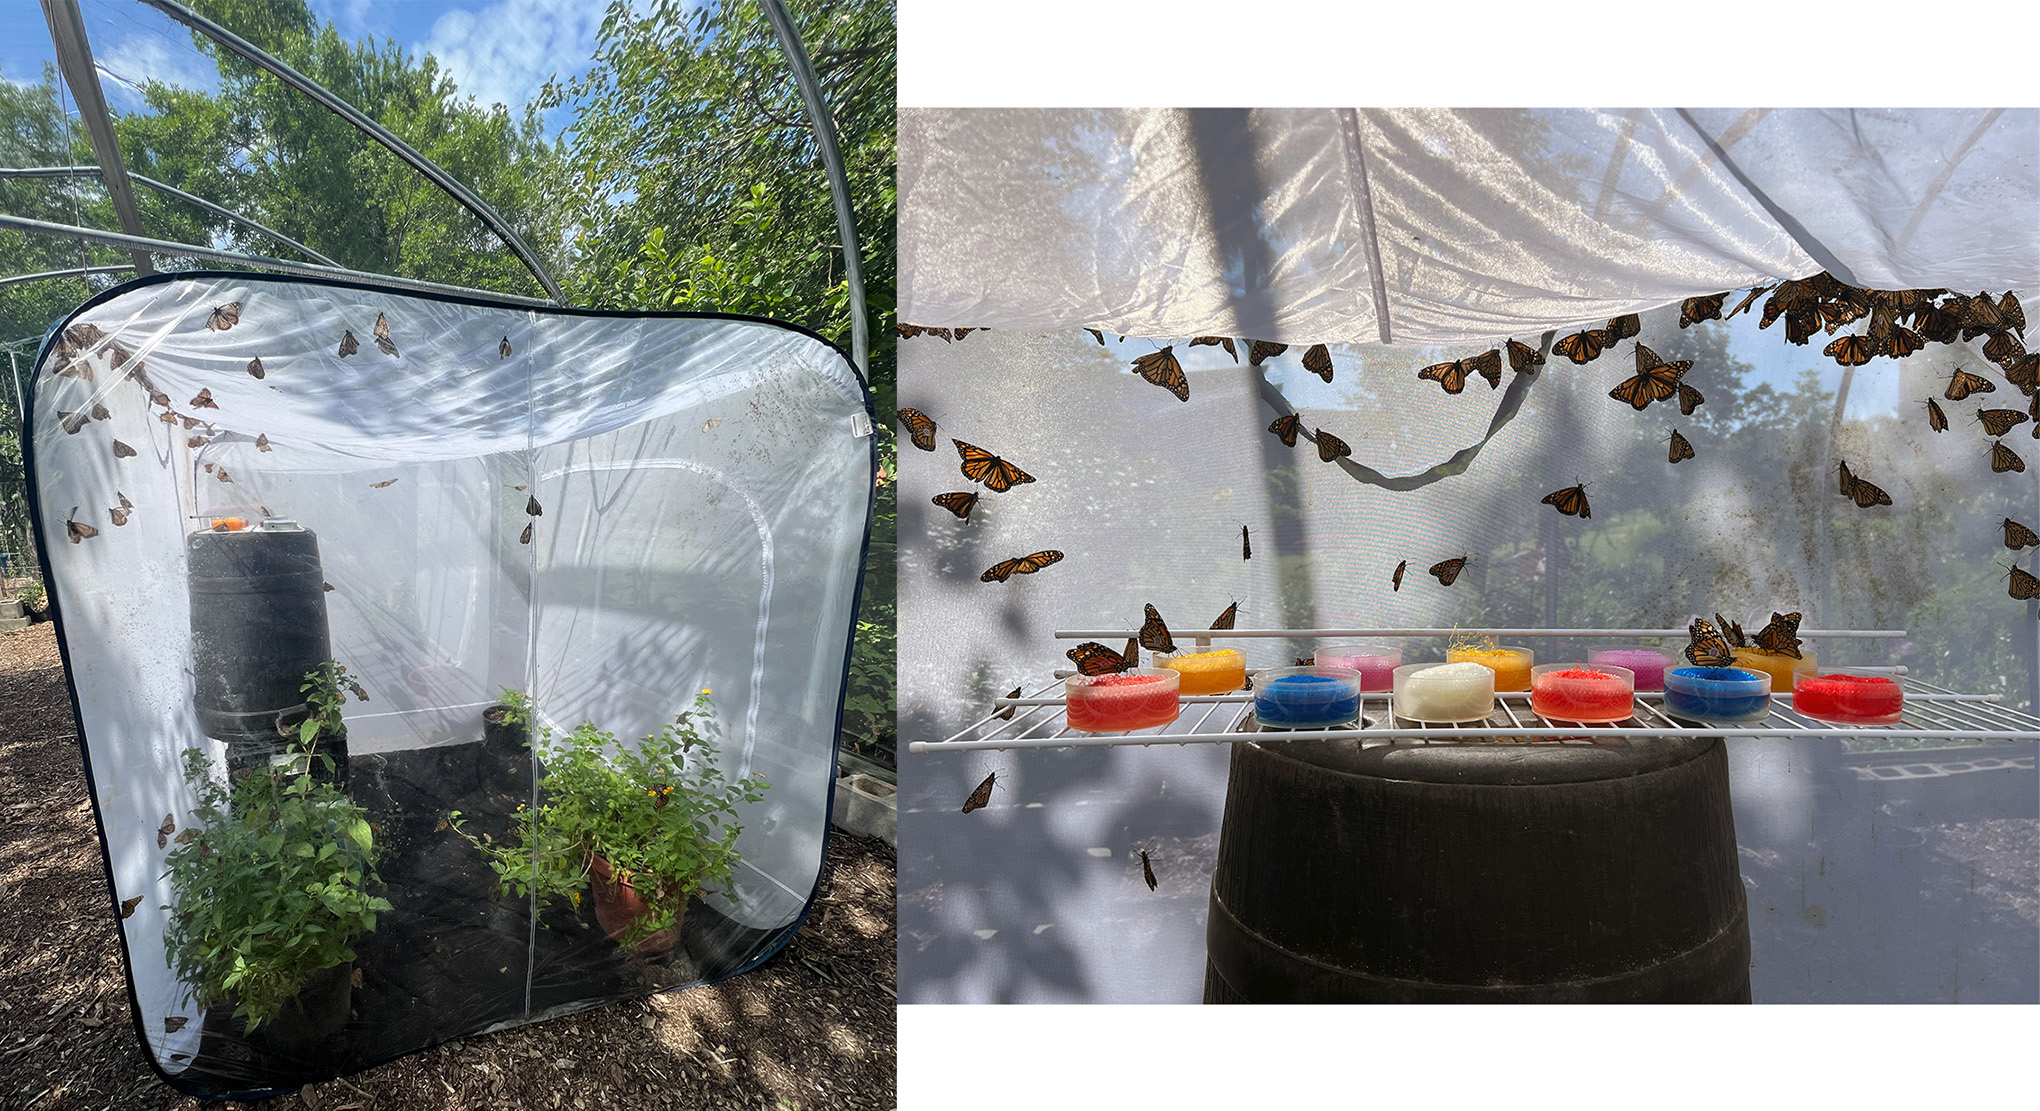
Figure 1. A view of one of the walk-in cages, with a close-up view of the nectar dishes. The dish in the center with the white plastic scrubber was used to assess rainfall and didn’t contain nectar.
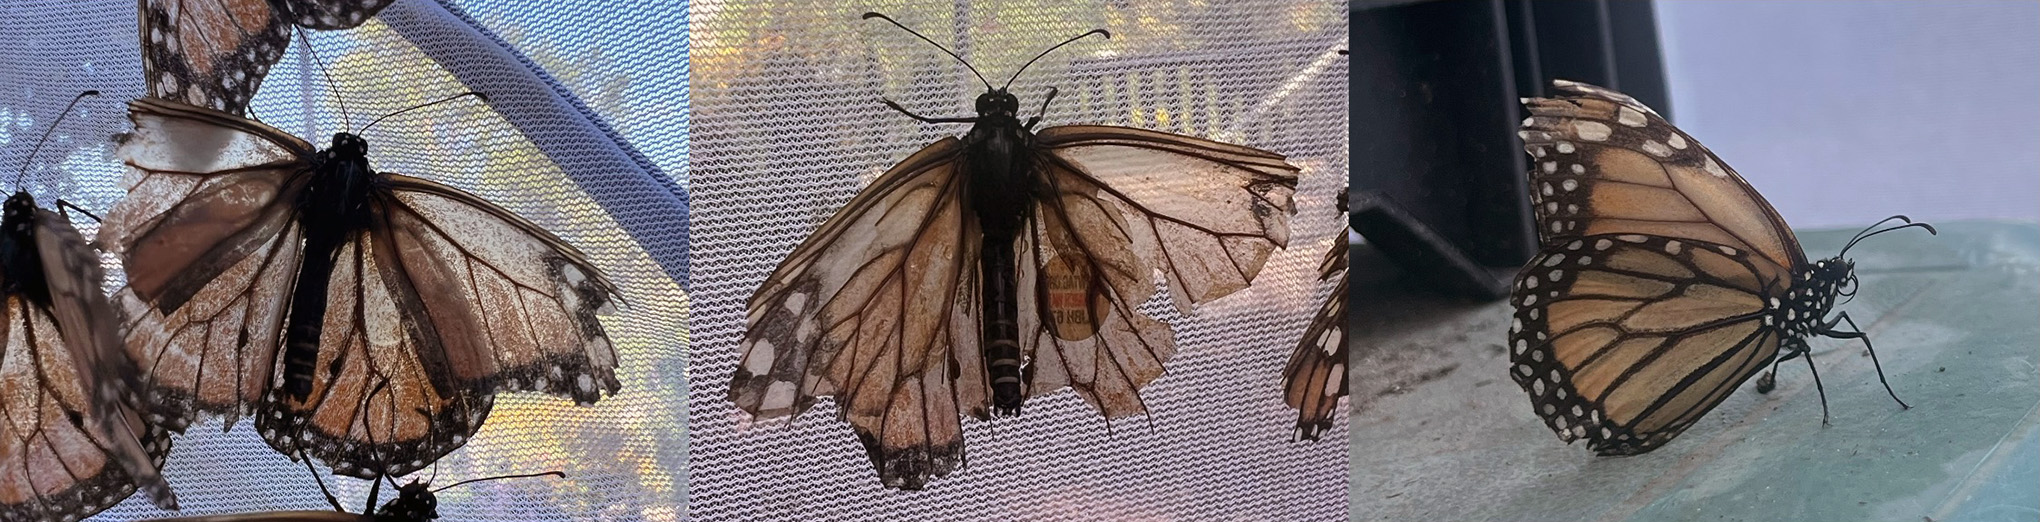
Figure 2. Pictures of monarchs from the experiment, including one of the three males that lost a tag (left), an older tagged male with extensive loss of wing scales (middle), and the oldest surviving female (untagged; right).
The Analyses and Results
Survival was calculated as the number of days between when a butterfly was placed in the cage and when it was collected as dead. We conducted two sets of analyses. For the first set, we only used monarchs where the number of days could be calculated based on the date written on the left hind wing (i.e., individuals where the date was no longer legible were excluded from the analysis). Forty-four individuals were excluded, including 27 females (14 tagged and 13 untagged) and 17 males (13 tagged and four untagged). For the second set, we included tagged individuals where the date could be calculated based on the tag, even if the date was no longer legible on the left hind wing. Seventeen individuals were excluded, including 13 females and four males.
We used t-tests to compare survival between tagged and untagged monarchs. For the first set of analyses, there was no difference in survival between tagged (27.64 ± 1.07; mean ± SE) and untagged (27.75 ± 1.48) female monarchs (t = 0.0581, df = 87, p-value = 0.95) or between tagged (26.40 ± 1.42) and untagged (25.89 ± 1.28) male monarchs (t = 0.2626, df = 131, p-value = 0.79). There was also no difference for the second set of analyses (females: t = 0.1164, df = 101, p-value = 0.91; males: t = 0.3902, df = 144, p-value = 0.70).
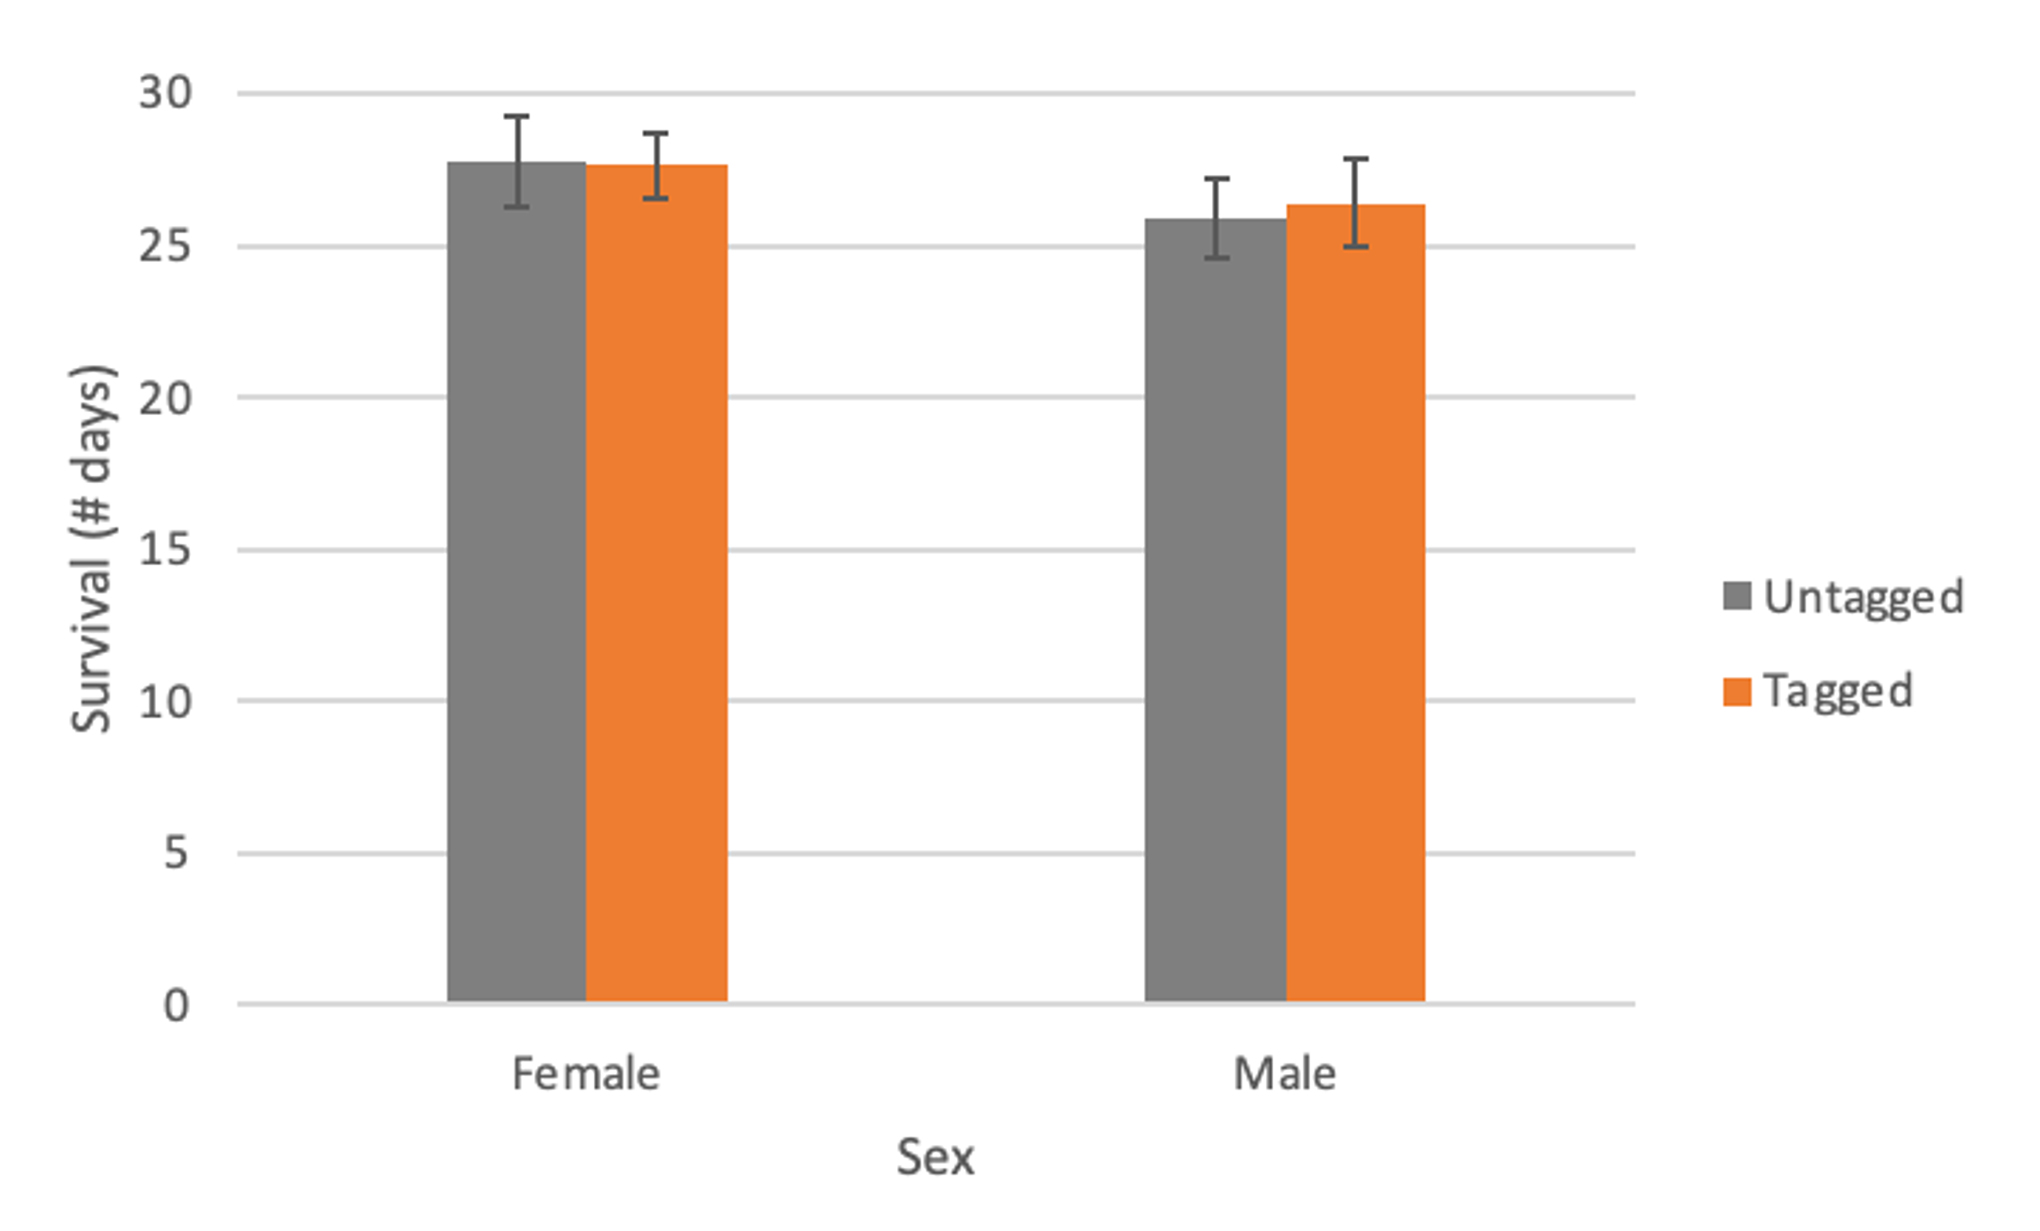
Figure 3. Survival (# days; mean ± SE) of tagged and untagged female and male monarchs, with individuals excluded if the date on the left hind wing was no longer legible.
We found no difference in survival between tagged and untagged monarchs held in outdoor cages, indicating that tags don’t affect survival under these conditions. This study was conducted during the breeding season, and results could differ for monarchs during the fall migration or those held under different conditions.
Filed under Monarch Tagging | Comments Off on Does tagging harm monarchs?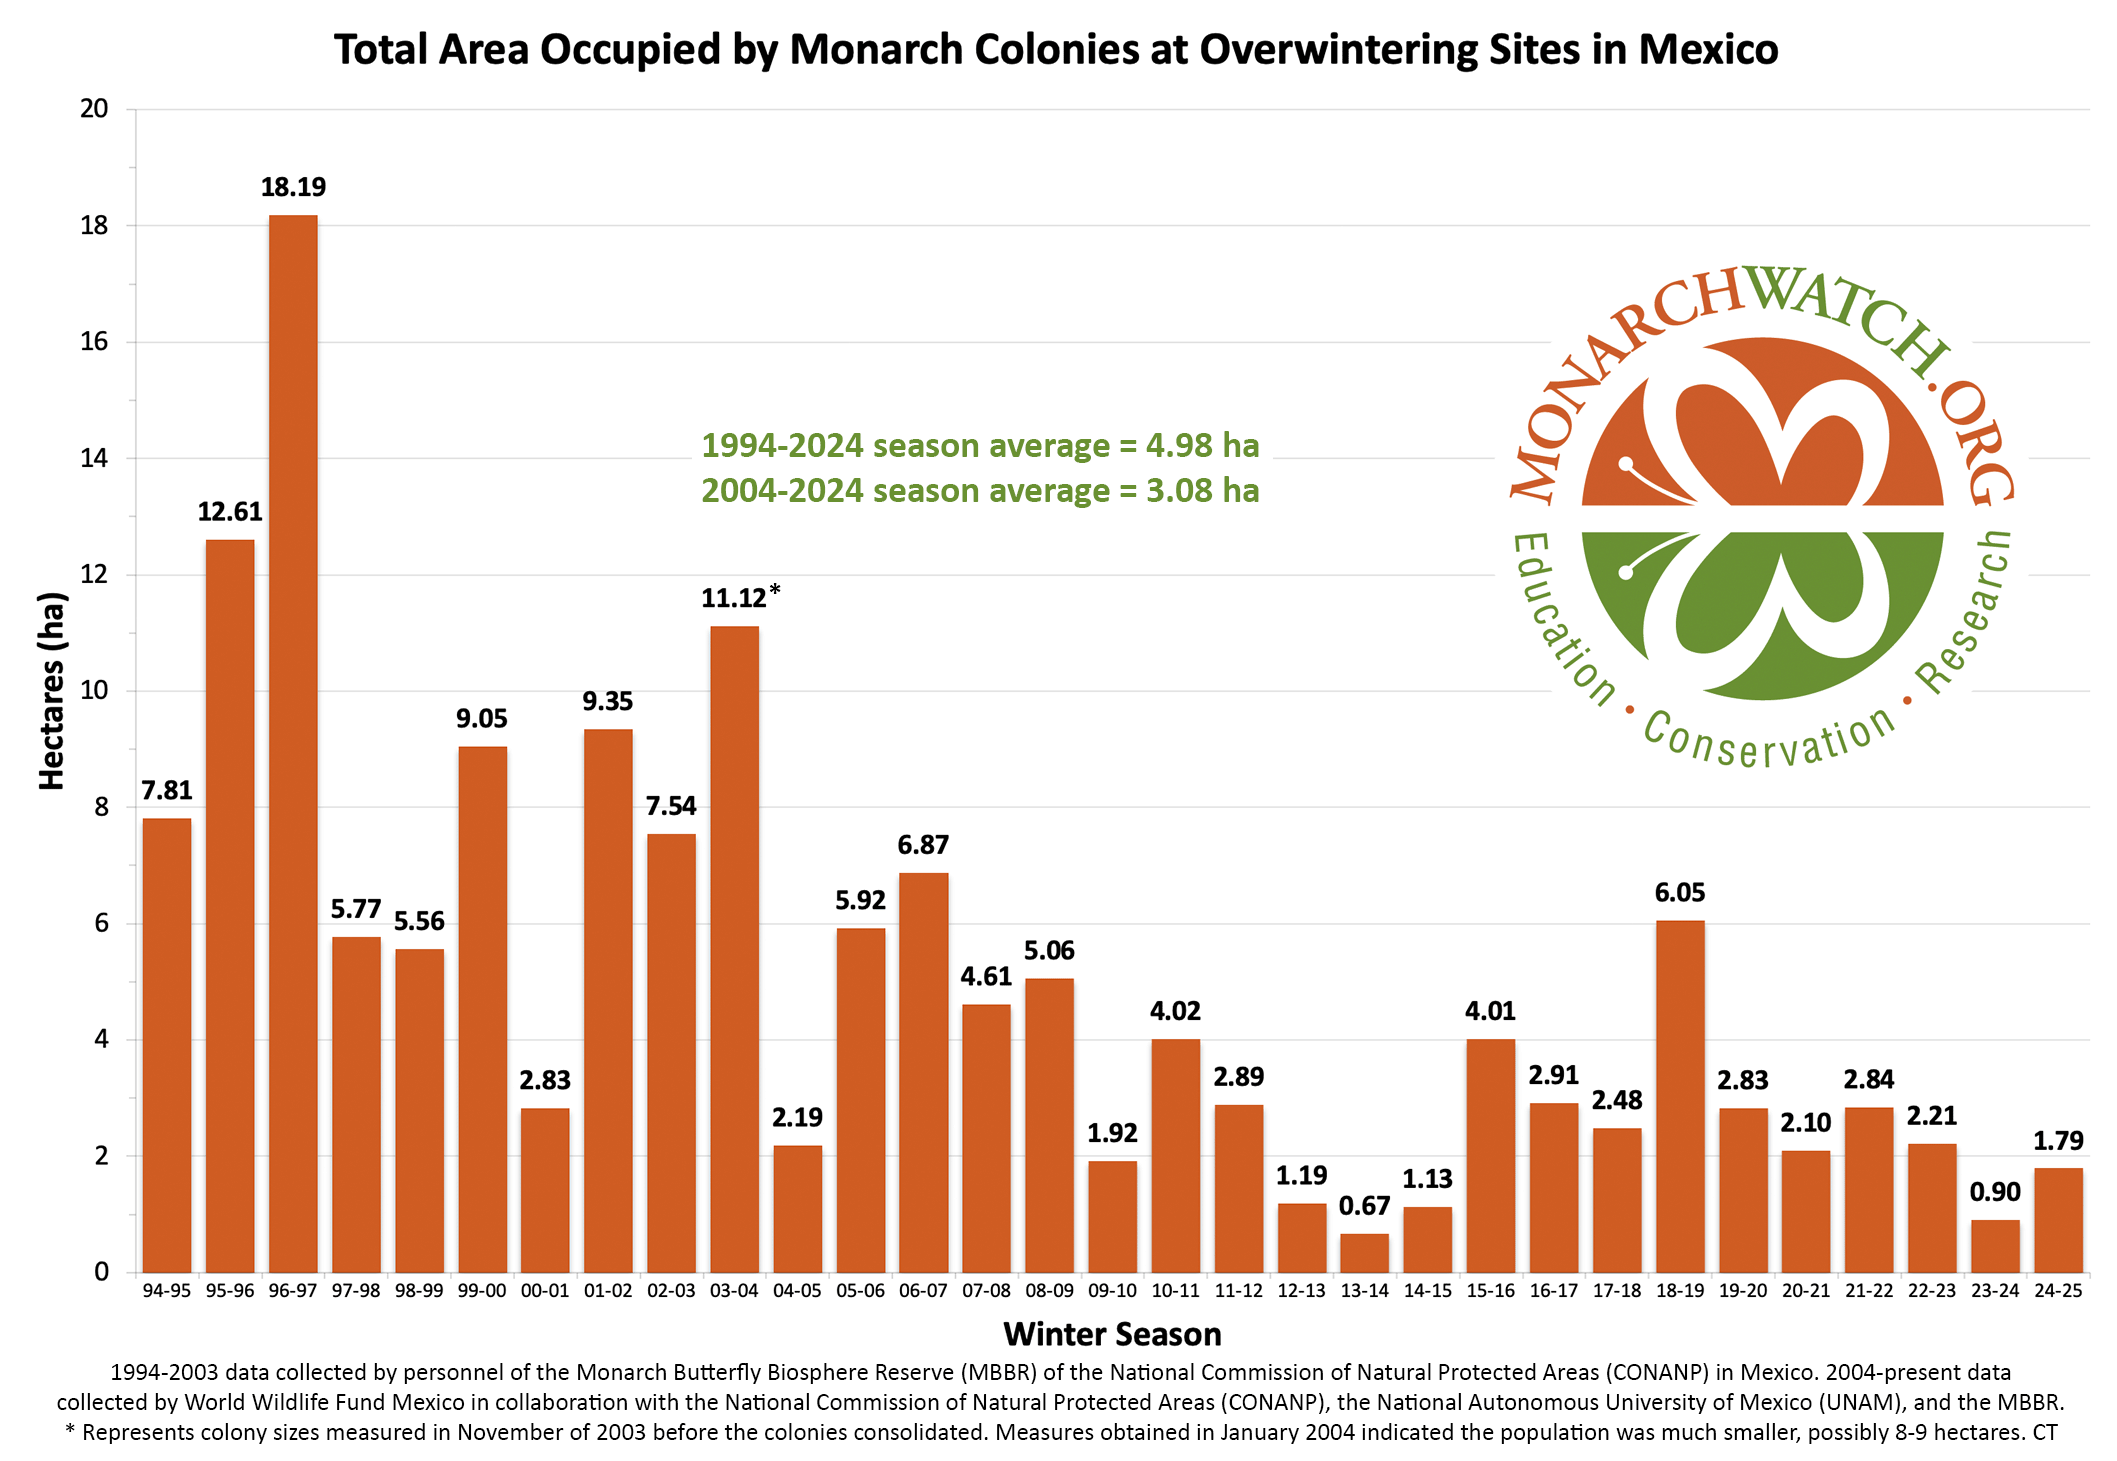
 Every year, thousands of paper monarchs fly south to Mexico alongside the real monarchs, though with a slightly different pathway. Monarch butterflies only weigh about 0.5 grams, and these paper ones are just as light. The paper butterflies are part of the