Monarchs: Weather and population sizes in the past
Friday, July 21st, 2023 at 3:25 pm by Chip TaylorFiled under General | Comments Off on Monarchs: Weather and population sizes in the past
by Chip Taylor, Director, Monarch Watch
If you have been reading about monarchs, you know they have declined in number. One account after another maintains that the population has declined 90% or, more conservatively, 80%. These declines are based on the first three years (1994-1996) in which the colonies were measured*. The populations increased from one year to the next in this short interval ending with the massive population in 1996 (18.19ha). The assumption has been that these three years are the standard – the average condition that might be expected year after year. No one has asked whether the populations were lower or possibly even higher in the past. Further, there has been no comprehensive analysis of why the sizes of the populations vary from year to year. A clue to what determines population numbers occurred in 1997. The number of hectares of monarchs dropped from 18.19 in 1996 to 5.77ha in 1997. There had to be an explanation for such a sharp decline. My pursuit for an answer for that decrease led to an analysis of the increases and declines over the last 29 years.
This quest has shown that the direction of change from one year to the next can be explained by single weather events in some cases and combinations of events in others. Extreme weather events such as late freezes (1997), cold or excessively warm summer temperatures and droughts account for a number of the declines. March temperatures in Texas as well as September temperatures in the Upper Midwest that are well above the long-term average, are also associated with declines. Extreme mortality during the winter months was a factor in several years. These changes can be seen in the data even though the population declined during a period of significant habitat loss from 1998-2012 due to the adoption of herbicide tolerant crop lines and the initiation of the Renewal Fuel Standard in 2007. Since 2012 or so, the rate of habitat loss has declined with the populations varying from year to year without a clear sign that the decline is continuing. In this text, I’m going to apply how monarchs responded to extreme deviations in temperatures in the last 29 years to years in the past to determine if conditions were similar or different from those in the present.
The Premise
Monarchs have optimal temperatures at which they function and therefore temperatures either too low or too high relative to these optima have negative effects. Since these optima are not well defined, we can only estimate how monarchs respond to ranges of physical conditions. Still, since populations develop well when temperature ranges and precipitation amounts are near the long-term averages and develop less well when these values substantially exceed these means, we can identify both favorable and unfavorable conditions for population growth. The goal is to use these criteria together with a stage specific growth approach to create a narrative for each year that explains why the population increased or decreased. This exercise has been used to explain population growth for the last 29 years (in prep.). In 27 of those years, the metrics were consistent with the outcomes. In two cases, both involving the last two years (2021, 2022), the metrics predicted lower numbers of hectares than were reported in Mexico.
In this exercise, I scanned the climatic record from 1895 to 1994 for years with extreme conditions for each of 8 metrics. The extremes for each metric were used in combination with the other metrics for those years to assess the likelihood that each population would decrease or increase.
Criteria
The first step was to define “average” conditions for temperatures and precipitation i.e., to define the ranges of values that appeared to only result in positive outcomes. For temperature, the range for “average” conditions was >-3.3 to +2.5F. In other words, temperatures less than -3.3F and more than 2.5F were deemed as having a negative impact on population growth.
Since an abundance of precipitation contributes to plant growth, nectar production, and the availability of water for monarchs, while the lack of precipitation can lead to all the negative consequences of drought, deviations from long-term means were included in the metrics. While there is no way to associate above average rainfall amounts with population growth, deviations of more than minus 2 inches were deemed as having a negative impact on population growth. This is a low standard, but since large areas are involved and precipitation is scattered, which can result in significant variation in soil moisture and a variable impact on plants and monarchs, this measure seems appropriate. Further, precipitation deficits ranging from -2 to -3 inches have been associated with low outcomes.
The ranges for both temperature and precipitation, while not precise or defined by experimentation, were informed by outcomes, i.e., deviations that appeared to have an impact on population growth.
Interpretations
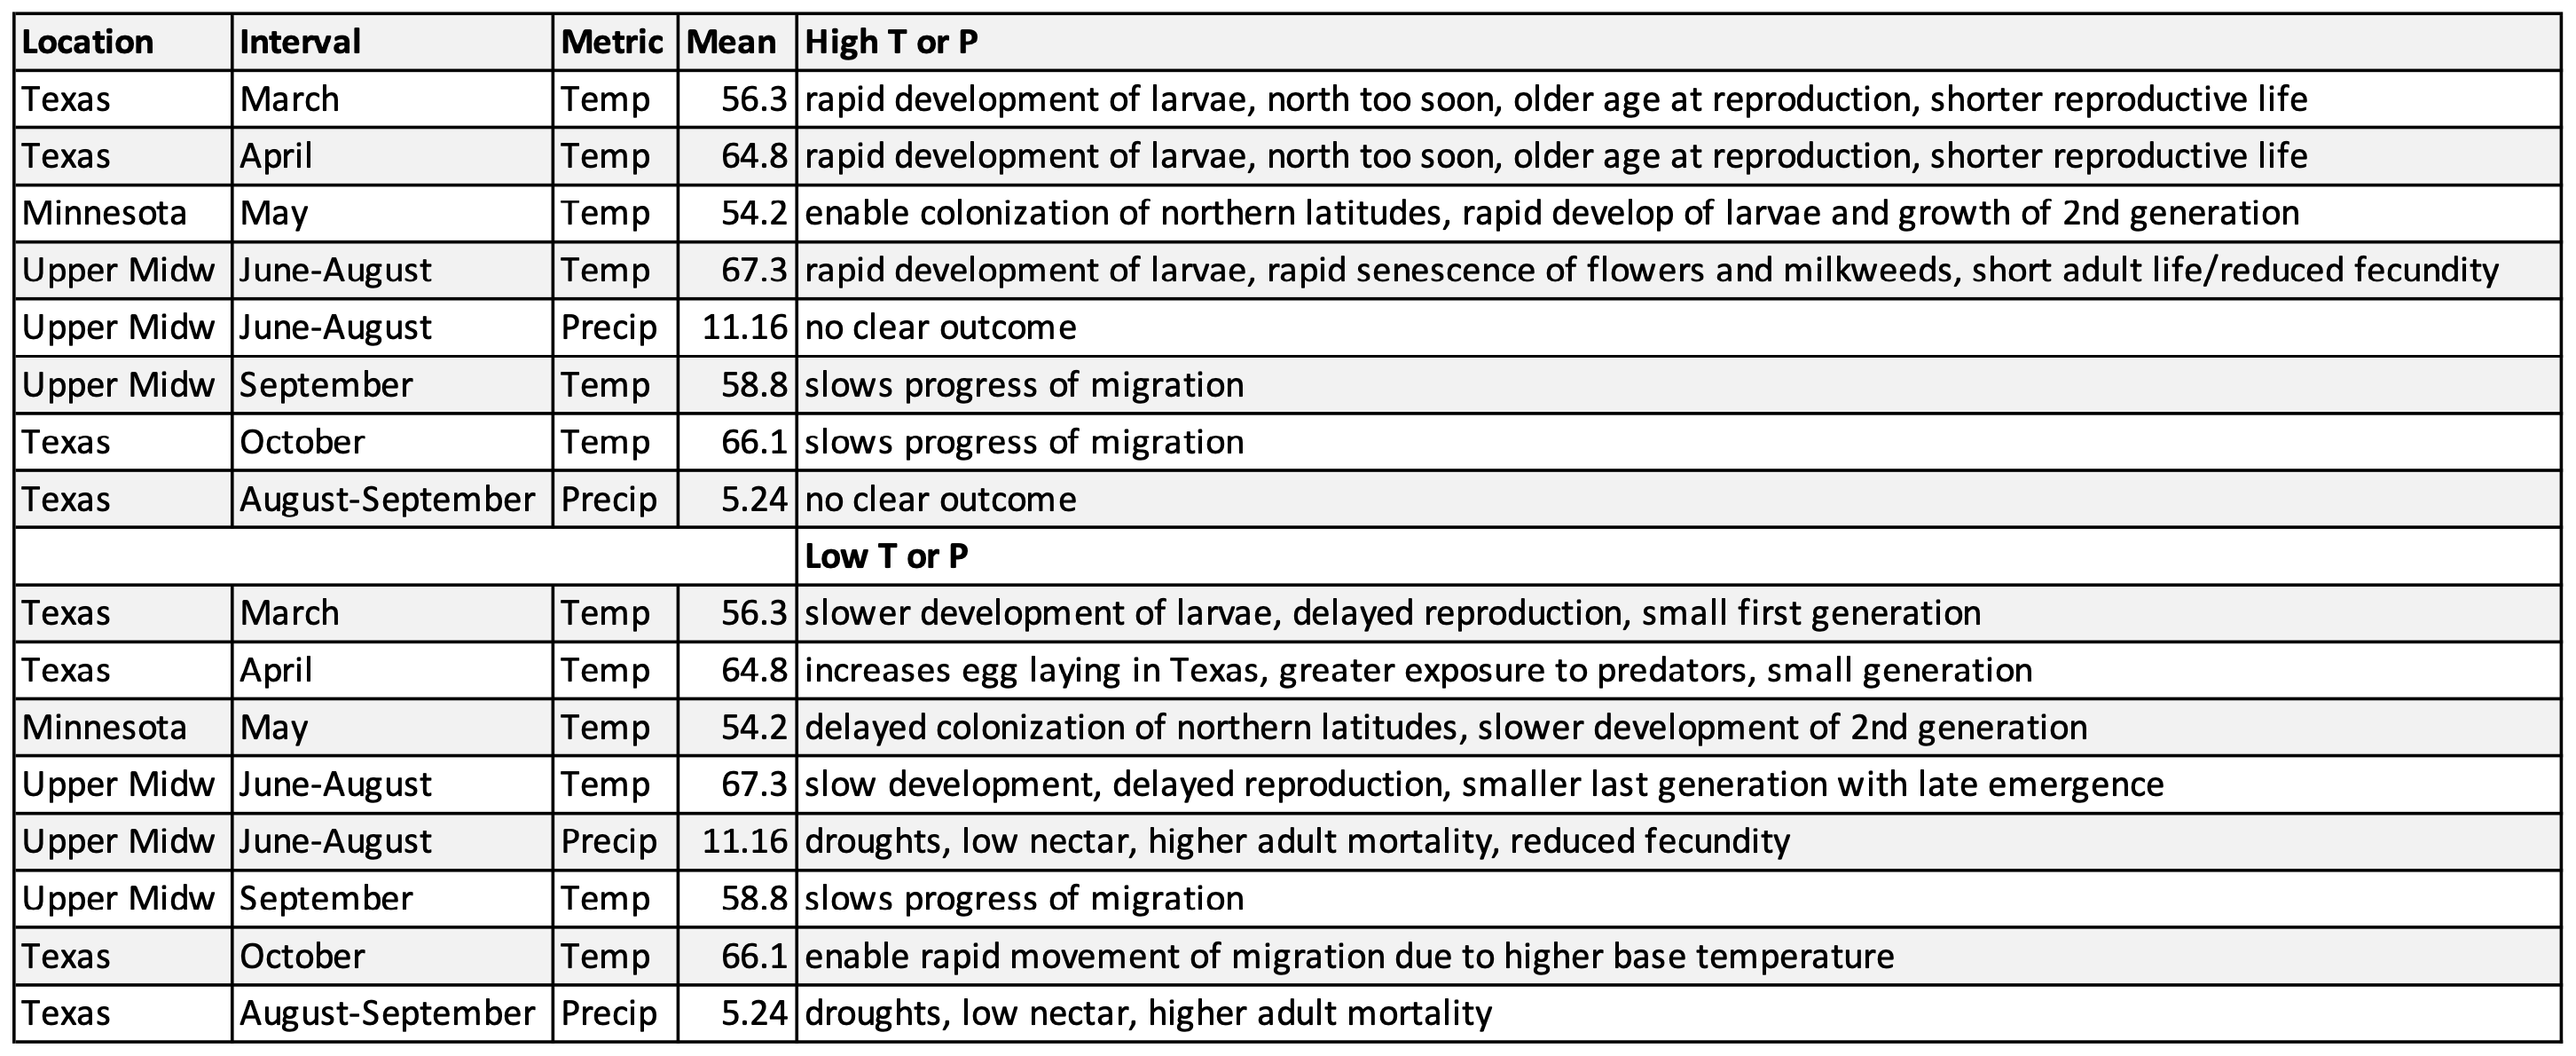
The interpretations for the effects of deviations that exceed the average condition are summarized in Table 1C. Most of these interpretations reflect expected responses to extreme highs or lows for insects. There is one special case that applies to monarchs. Monarchs returning from Mexico expand their distribution to the north at rates that are determined by temperature and southwesterly winds. When March and April temperatures are high relative to the long-term average, the returning monarch advance rapidly often getting ahead of the emergence of milkweeds. These advances often take them to latitudes in warm intervals that later become quite cold – sometimes freezing. Eggs and larvae distributed through these advances take longer to develop due to the colder conditions with the result that the overall mean age to first reproduction of the offspring of returning monarchs is greater. Older age to first reproduction by cohorts slows population growth. Said another way, if the returning females lay most of their eggs in Texas and southern Oklahoma, the populations will grow faster than if, in addition to Texas and Oklahoma, eggs are also laid in Kansas and Nebraska. In effect, there is an optimal egg distribution that varies from year to year with temperature. The most favorable outcome is for most eggs to be distributed in Texas and southern Oklahoma when March and April temperature are above the long-term mean. This scenario occurred in 2018. Monarchs were confined to Texas and southern Oklahoma due to a dip in the jet stream that blocked movement to the north. The result of this combination, and other factors later in the season, was an overwintering population of 6.05ha, the largest population since 2006 (6.87ha).
Discussion
The data and interpretive statements are summarized in Table 1A, 1B and 1C.
Table 1A. Deviations from long-term means for temperature and precipitation for 15 years with all-time extreme values for one or more metric. Orange = extreme value, pink = a negative value, yellow = average range and green = a positive outcome.
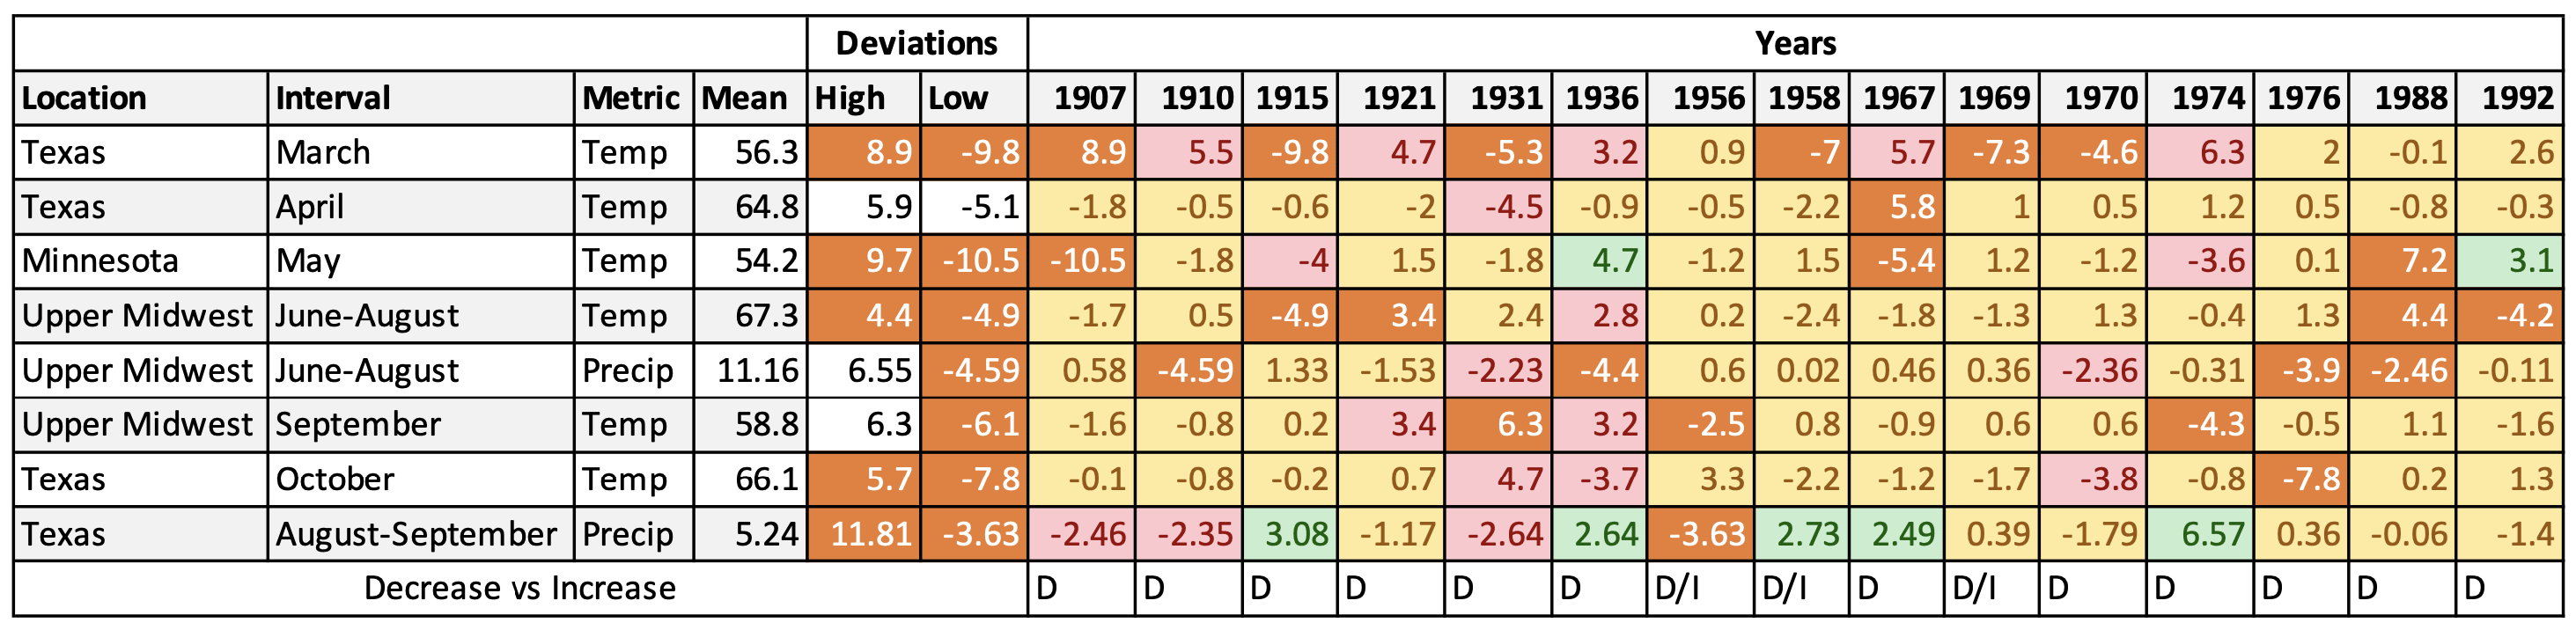
Table 1B. Highest and lowest deviations from long-term means in the last 29 years.
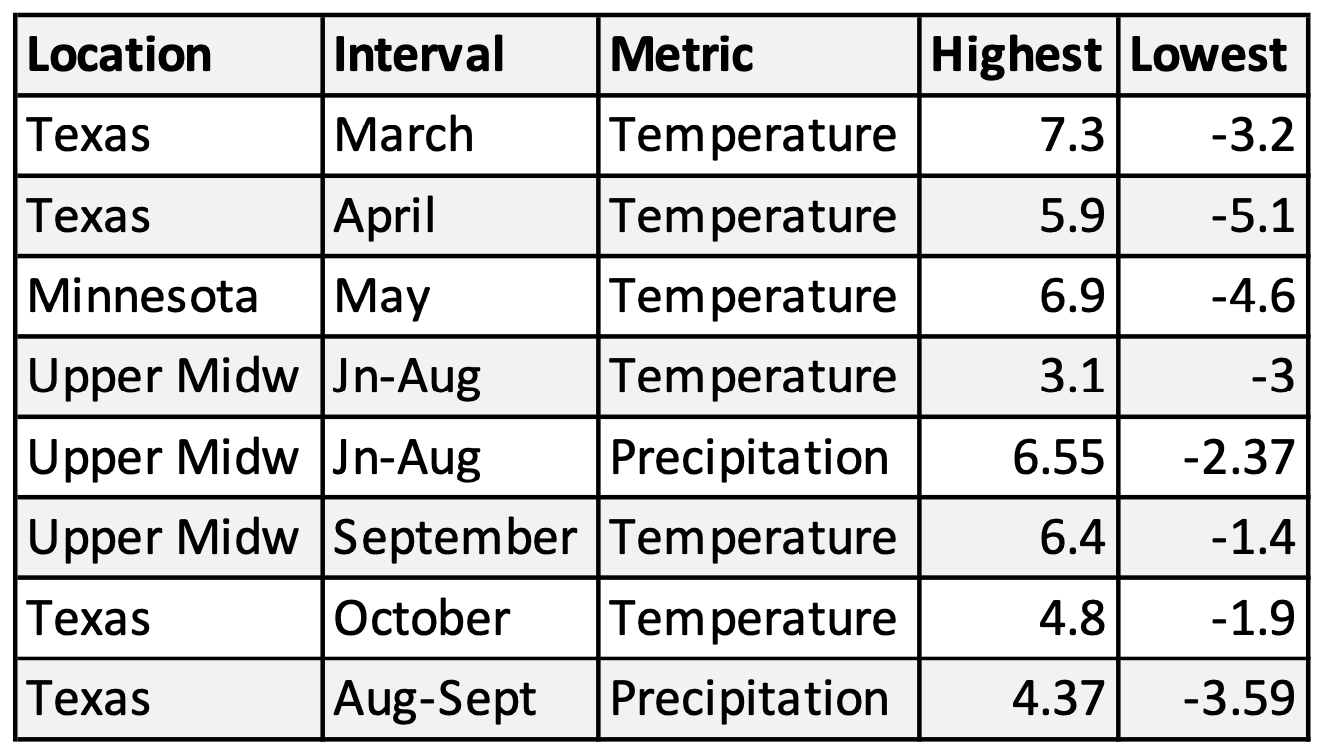
Table 1C. Interpretations of deviations that substantially exceed the ranges for “average” conditions.
The search through all records yielded 15 years (Table 1A) with one or more metric that exceeding the most extreme value seen in the last 29 years (Table 1B). The likely effects of these extremes are summarized in Table 1C. As part of this assessment, I looked at the record for each year that preceded the years in this summation. In each case, the prospects for growth were better than in the years in this record and it seems likely that the population decreased in all years with the possible exceptions of 1956, 1958 and 1969 which could have experienced modest growth. It is likely that substantial declines occurred in 1907, 1910, 1915, 1931,1936, 1988 and 1992 with more modest declines in all other years. Because the extreme values for 1969 and 1976 have no counterpart in the record for the last 29 years, assessing the effects of these measures is difficult. While it seems probable that the outcomes were negative, modest growth also is a possibility.
A comparison of the highest and lowest deviations from long-term means for the last 29 years (Table 1B) with those in the historical record (Table 1A) shows that most of the deviations in the latter far exceeded those of the last 29 years. It’s difficult to assess the effects of some of these extremes. There are 5 years in these records in which the mean March temperatures were -4.6F to -9.8F. These lows exceed the lowest March temperatures (-3.2) recorded in the last 29 years by a large margin. In fact, the mean lows ranged from 46.5F to 51.7F. These temperatures were too low for monarch activity of any kind and likely meant that the recolonization from Mexico was delayed an entire month or even more in 1915, 1931, 1958, 1969, and 1970. There is simply no way a population experiencing these conditions could increase relative to a more robust population the previous year. The decline in 1915 was likely to have been so severe as to taken many years to recover. That outcome was likely as well for the back-to-back declines in 1969 and 1970. Significant declines may have occurred in several other years such as those with significant droughts in the Upper Midwest in 1910, 1936, 1976, and 1988. The low summer temperatures in the summer of 1992 (the Mt. Pinatubo summer) surely led to a decline as well.
While declines were likely in all of these years, the sizes of these populations are unknown. Still, it seems probable that the number of hectares in many cases were as low or lower than lows during the worst period in the last 29 years: 2011 (2.89ha), 2012 (1.19ha), 2013 (0.67ha), and 2014 (1.13ha).
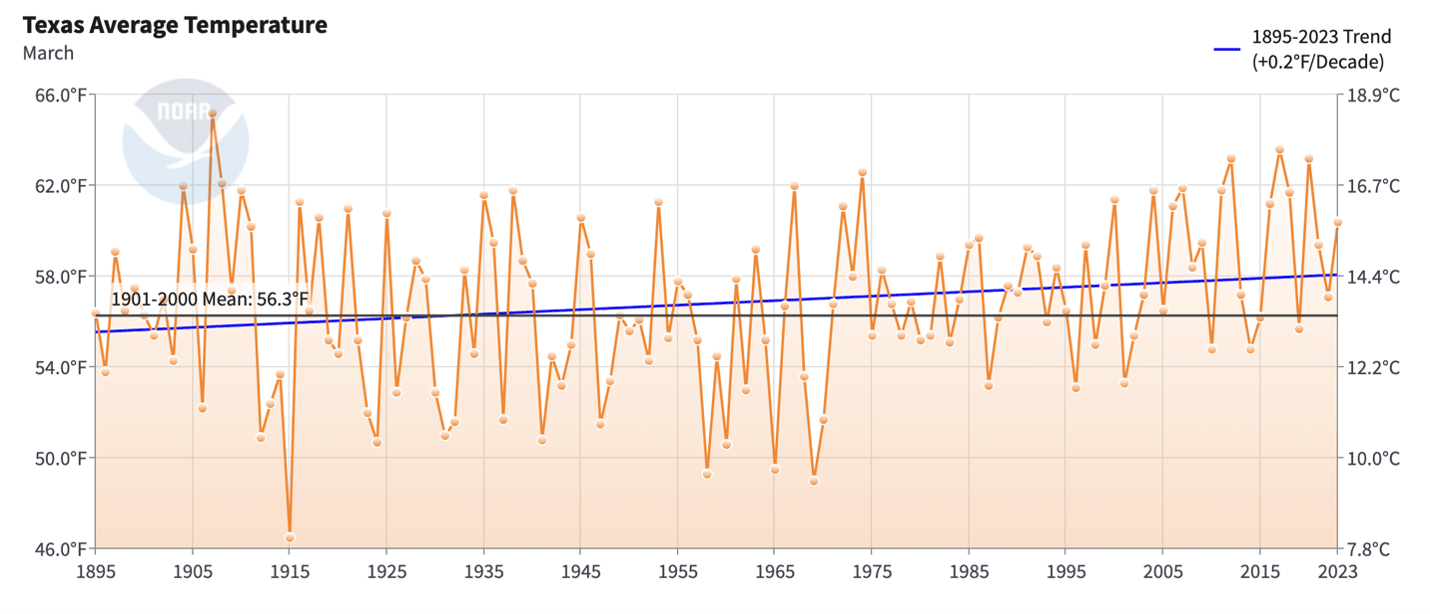
There are two general points to make about these results. First, that the physical conditions were much more variable and more extreme in the past than during the last 29 years (Figure 1). As a result, it is likely that there were many periods during which the monarch populations were quite low. Second, whether populations increase or decrease in a given year is determined by weather irrespective of the abundance of monarch habitat. In other words, even though habitat losses from 1998-2012 led to an overall decline in monarch numbers, the impact of those losses are not apparent in the data from one year to the next.
Lastly, this record only includes years with extreme deviations from the long-term means. There were certainly a number of other years from 1895-1994 in which the population declined due to an extreme event or combinations of conditions.
*It is generally not mentioned, but the 7.84ha cited as the total overwintering area was an undercount. The record shows that a number of smaller colonies were not measured that year (Garcia-Serrano, E and X. Mora-Alvarez. 1999).
Figure 1. Average March temperatures for Texas from 1895-2023. There are three trends in these records: the high variation in these records that ended in 1974, the damped variation from 1975 to perhaps 1994 and the progressive increase in temperatures from 1994 to the present. The average temperatures have increased 0.8F per decade since 1975 to 60.14 F vs the long-term average of 56.3F.
Reference
Garcia-Serrano, E and X. Mora-Alvarez. 1999. Monitoreo de las colonias de mariposa en sus sitios de invernacio en Mexico. 1997 North American Conference on the Monarch Butterfly, Morelia, Mexico.


Sorry, comments for this entry are closed at this time.