Monarch population development in 2024: Part 1
Tuesday, April 2nd, 2024 at 5:54 pm by Chip TaylorFiled under Monarch Population Dynamics | Comments Off on Monarch population development in 2024: Part 1
As most of you reading this know, the estimate of the number of monarchs overwintering in Mexico this past winter was a mere 0.9hectares, the second lowest in the record that began in 1994. Low numbers have again triggered concerns about the viability of the eastern monarch migration and given rise to a number of questions. Why did the population decline from 2022 to 2023? Will the population recover? How long might recovery take? What is the extinction threshold for the eastern monarch population? These are just a few of the relevant questions. In various posts to this Monarch Watch Blog, I have pointed out that monarch numbers have been low at many times in the past and have recovered. In fact, they are remarkably resilient due to their high reproductive rate and ability to find even scarce host plants and nectar sources. I have claimed that, as a species whose numbers are driven by weather, all that monarchs need in the coming months and years is favorable weather. Since we are in a period in which temperatures and droughts appear to be increasing, my assurances have not quieted concerns. To be sure, there is no way to control the weather, but I’m getting closer to understanding how weather influences the development of the monarch population each year. In the following text, I’m going to describe three data-based “tells” that I have been using to determine how well the population is developing each year. These indicators only suggest whether the population will increase or decrease. There is no precision here, but even knowing trends that provide an indication of outcomes is useful.
Early season indicators of population development
I use three indicators, the timing and number of monarchs reported in Texas from 1-30March, total monarchs reported in Texas in March and April and the total monarchs reported N of 40N for all longitudes from 100W to 65W. This report covers the first interval. The second report will follow in early May and the third in mid-June. The first two reports only feature sightings in Texas since the I-35 corridor is the gateway for monarchs to reach the Upper Midwest, the area that produces the majority of monarchs that reach the overwintering sites each winter. How the population develops in Texas in March and April has a significant impact on the size of the fall population.
About the data
The data represent sightings of adult monarchs from Journey North and iNaturalist data sets. In the case of Journey North, “vetting” the data required elimination of double and triple entries for what appeared to represent a single butterfly (N>10). iNaturalist records required the elimination of many images of eggs, larvae and pupae. Some images were not included in the counts since they appeared to represent reared monarchs. Records with good photo resolution indicated that 12-19% of the butterflies had recently emerged and surely had not originated from the overwintering colonies in Mexico. In the records for 2024, the origins of the newly emerged monarchs are not clear since few monarchs appeared to have survived the two January cold fronts with freezing conditions that swept into Texas and even northern Mexico. No attempt was made to eliminate these butterflies from the counts since it was impossible to assign a number of the images as either new or old. Duplicate entries appear to be a minor problem for both data sets. The data for Journey North are summarized in Table 1.
Table 1. The relationship between first sightings in Texas, total first sightings in March and April and the percentage of first sighting in March to the mean temperatures in March and the number of days with temperatures >70F.

The good news
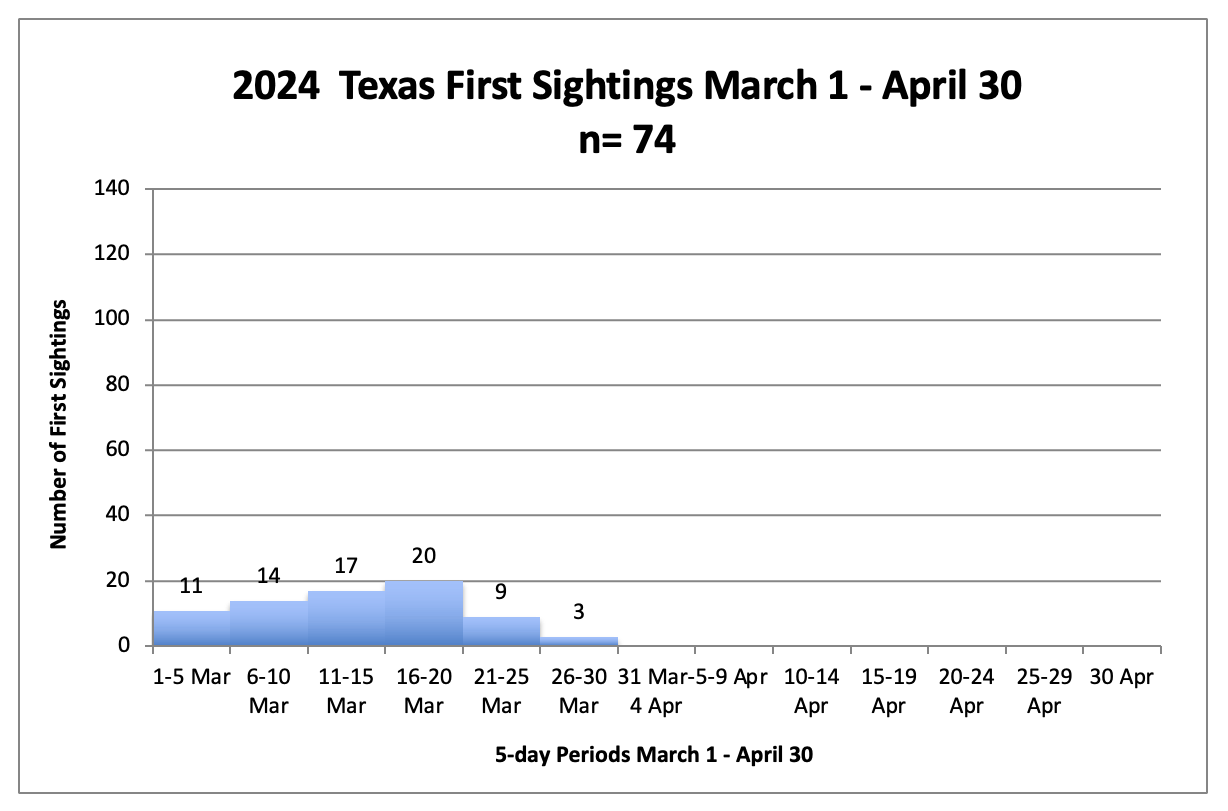
Let’s start with the good news. In the 1-30March period, 84% of the first sightings reported to Journey North occurred by the 20th (Figure 1). That’s early relative to all other years from 2010-2023, except 2012 (Figures 2 and 3). Early arrival favors population development since it assures, in most years, that there is a long oviposition interval before the monarchs push on to Oklahoma and beyond. The higher temperatures early in March also favor more rapid development of larvae and the possibility of outpacing the growth of the populations of the many parasites and predators that prey on monarch eggs and larvae.
Early arrival also favors a Texas-biased latitudinal egg distribution profile. Population growth is favored when the majority of eggs are laid at the lower latitudes where the temperatures are warmer, as pointed out above. You can imagine the egg distribution as a decay function where the tail of the distribution is long or short depending on the distance monarchs advance in March and April. In this case, population growth is favored when the tail on that distribution is short since the warmer temperatures assure that the first-generation cohort will have a lower average age to reproduction than a distribution that extends into colder regions and longer development times. That distribution has a short tail this year. There were only 4 first sightings in Oklahoma in the Journey North records as of the 28th of March and 9 during the following two days. March temperatures were closer to the long-term averages this year than in many recent years.

Figure 1. Distribution of March and April first sightings for 2024, in progress. Data from Journey North.

Figure 2. Distribution of March and April first sightings for 2013 and 2015. Data from Journey North.

Figure 3. Distribution of March and April first sightings for 2012 and 2023. Data from Journey North.
The latest rabbit hole
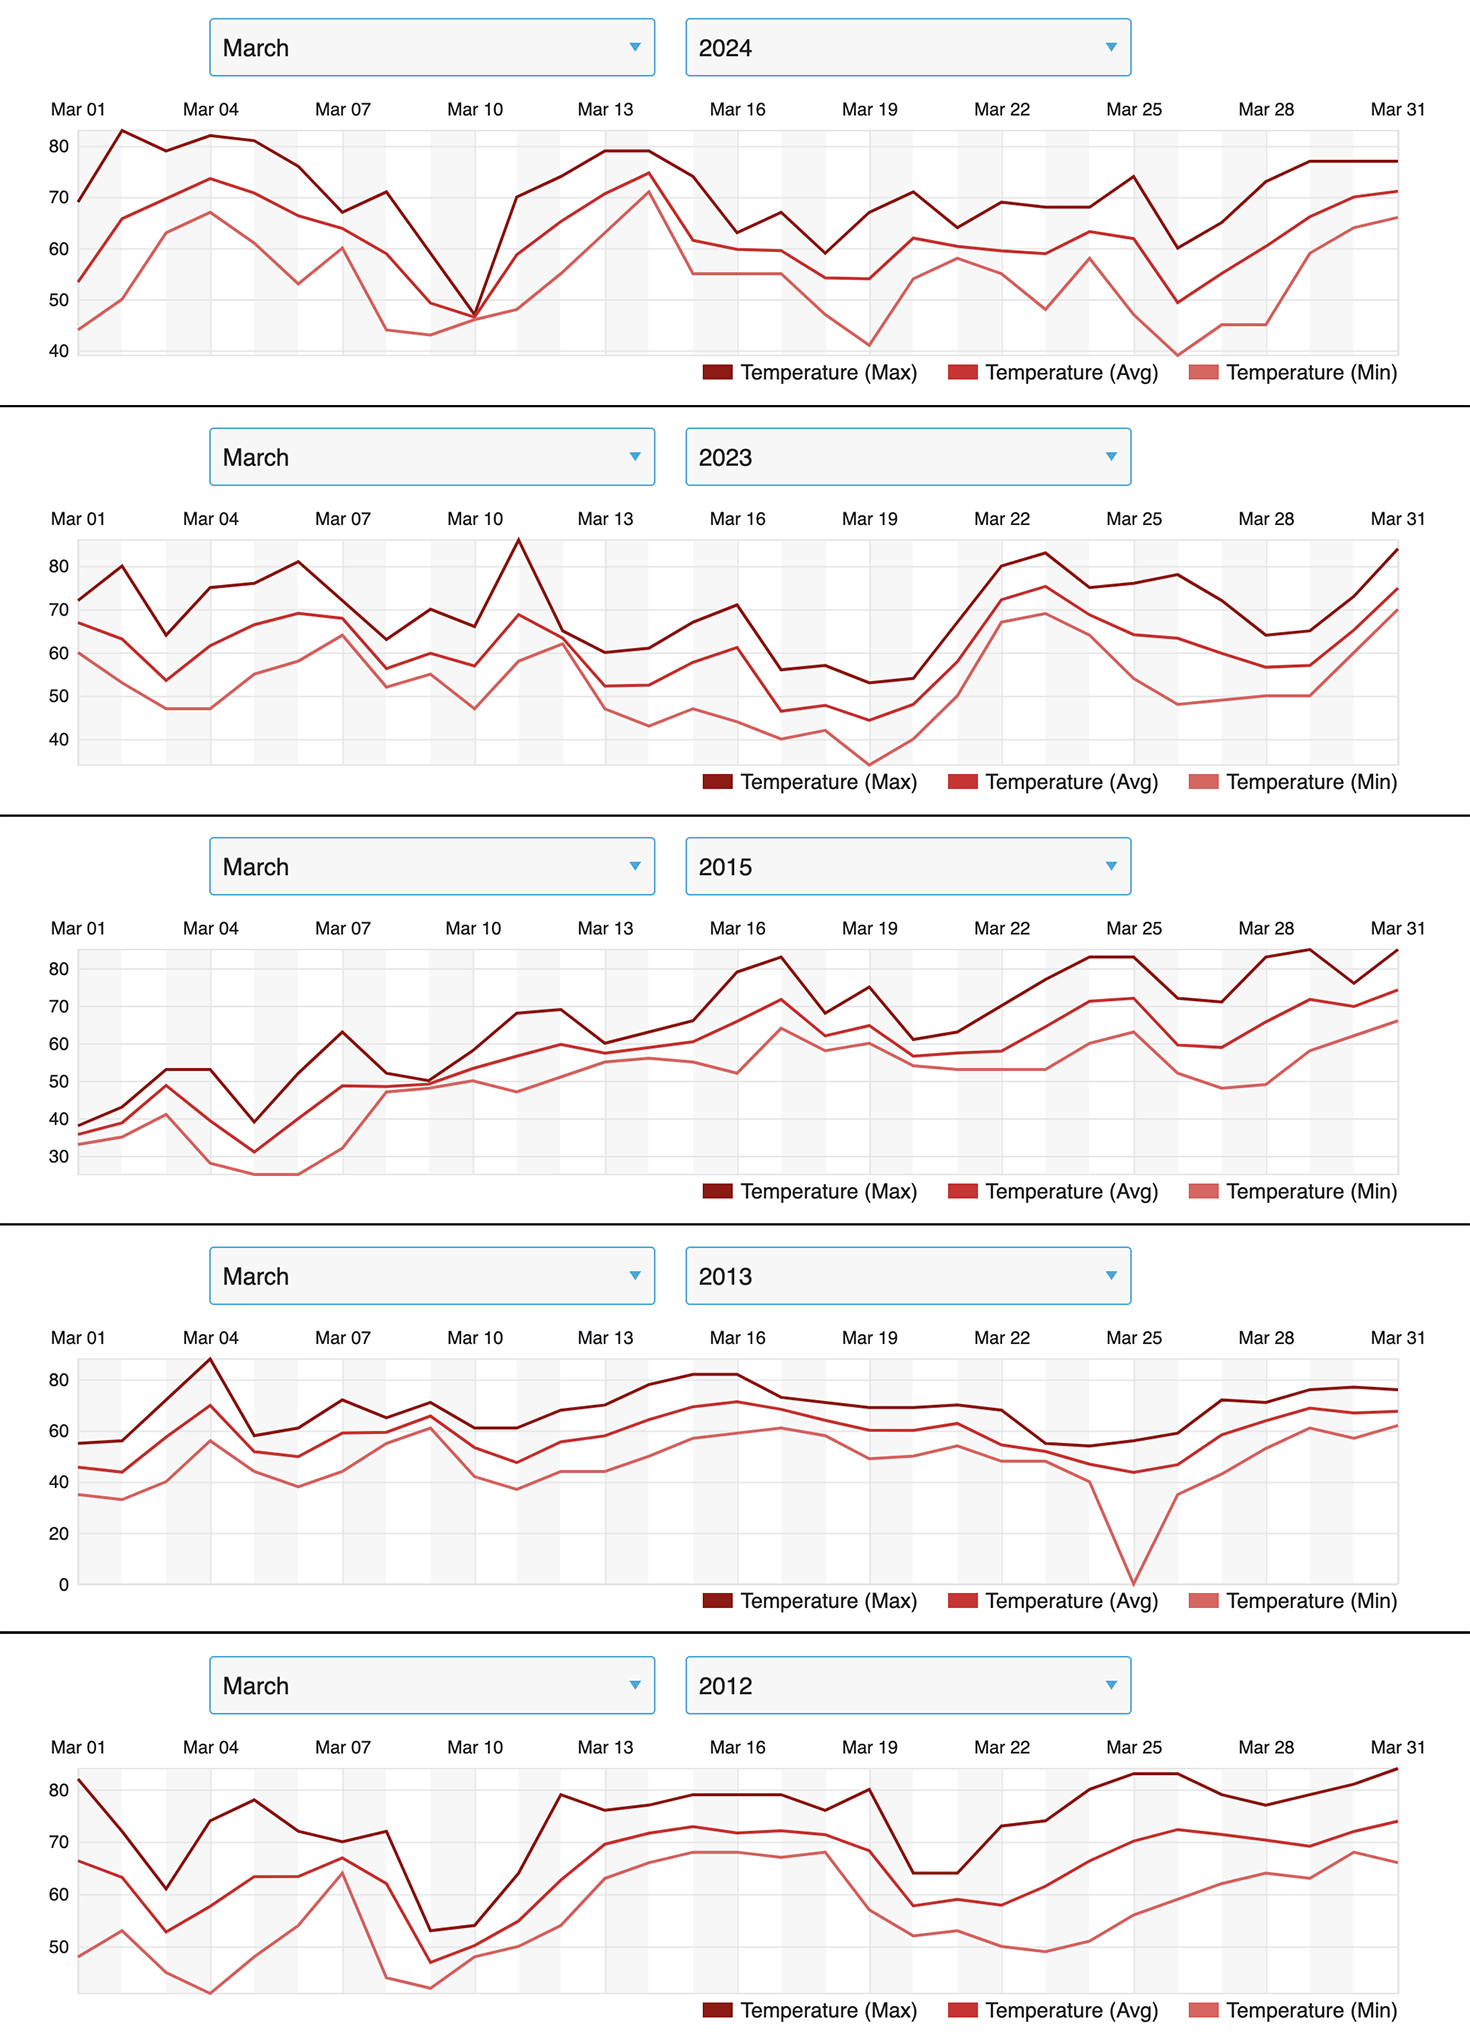
I have fallen into many a rabbit hole in the course of trying to understand weather and monarchs. Here is the latest one – the relationship of the sightings of monarchs returning from Mexico to temperatures, specifically to the number of days in which the temperatures reach at least 70F. The choice of 70F is arbitrary. I could have chosen any number between 68-72 and would have obtained similar results, but 70F works because that temperature and higher puts monarchs on the wing and visible to observers. The following graphs (Figure 4) represent the March temperature records for Dallas, Texas for the years indicated. The Dallas records were obtained from Weather Underground since that site provides daily and monthly records. The means shown for Dallas in Table 1 are similar to the monthly means for the state of Texas. The number of days with temperatures above 70F for the month and for just the first 10 days of March are also shown in Table 1. The differences between the years with higher-than-average March temperatures, 2012, 2023 and 2024, and those with lower-than-average temperatures, 2013 and 2015, are striking. Temperatures have an effect on the percentage of the March-April first sightings recorded in March (2012 and 2023 vs 2013 and 2015) Table 1.

Figure 4. Graphic representations for the March temperatures in Dallas for the years indicated (see Table 1). Source: Weather Underground: Historical Weather
The bottom line
Temperatures
As shown in the data assembled here, March temperatures are important for several reasons. First, they determine the timing of the recolonizations across the latitudes represented in Texas, they influence that rate of egg development and the growth of larvae and lastly, March temperatures retard or enable colonization of more northerly latitudes.
The numbers
There are two questions about the number of first sightings at this point: were fewer monarchs sighted in the first thirty days of March this year compared to last year? and how do the numbers compare with the first sighting to this point in 2013? It is reasonable to expect the numbers sighted this year vs last year to be lower due to the relative size of the respective overwintering populations (2.21ha vs 0.9ha). As expected, the numbers reported to iNaturalist are lower with 266 in 2023 and 199 in 2024 or 75% this year relative to last. The iNaturalist differences are much smaller than expected. Chuck Patterson of Driftwood, Texas reported similar results. Each of the last two years Chuck and his wife have counted each monarch seen and each egg found on their daily walks in March. The totals were 61 in 2023 and 34 (56%) this March and the egg count was 541 vs 461 (85%). So that’s clear, the numbers are down from last year, but are higher than expected due to the differences between the overwintering numbers. But how to the numbers this year compare to those of 2013, the year with the lowest overwintering numbers? To answer this question, we only have data from Journey North. Here the record is less clear because, as shown in Table 1 and in Figures 1-4, the first sightings in March are strongly influenced by temperature with high temperatures early in the month resulting in early sightings and colder temperatures, as in 2015, delaying the arrivals, or at least the sightings. If we compare the first sightings for 2024 vs 2013, it’s 74 vs 64, but that difference is so small it could simply be due to how temperatures influenced the number of sightings. We will have to wait to see if the number at the end of April is similar to the to the 113 total reported in 2013. Even if the final number is lower, the early arrivals this year and the longer oviposition period in Texas might offset the effects of lower numbers arriving from Mexico. Demography is complicated. Stay tuned.
Acknowledgements
This report would not have been possible without the assistance of the many citizens who have reported their sightings and visual records to Journey North and iNaturalist. The administrators and funders of both programs have done a marvelous job of providing data that can be used to answer the many questions that linger about monarchs and other wildlife. The Journey North records assembled by Elizabeth Howard and continued by Nancy Sheehan represent both stability and change over the last 26 years. It is a remarkable archive. iNaturalist is relatively new, but by virtue of photographs and a large number of qualified identifiers together with a remarkable website, it is destined to document much of the change that tracks the responses of wildlife, including many lesser-known species, to the coming changes in weather and climate.


Sorry, comments for this entry are closed at this time.