Monarch population development in 2024: Part 2
Thursday, May 23rd, 2024 at 8:01 pm by Chip TaylorFiled under Monarch Population Dynamics | Comments Off on Monarch population development in 2024: Part 2
Introduction
The report that follows is a rough attempt to assess the prospects that the monarch population will recover from the historically low number of hectares recorded for all the overwintering sites last winter (0.9ha). As you may recall, in Monarch population development in 2024: Part 1, there were no clear signs in the data that the population would increase, decrease or remain relatively the same. There were both positive and negative signs. The timing of the return from Mexico was early relative to most years. Early establishment of the population is favorable, and in this case, it led to a long oviposition period in Texas at a time when the temperatures favored rapid development of eggs, larvae and pupae. The negative signs were that the numbers returning to Texas in March were not only lower than those of last spring but were lower than those in the spring of 2013, a recolonization that resulted in the lowest overwintering number in the record.
We are now another month into the breeding season, and the picture is becoming a little clearer, and a bit more positive. In this report, I will examine more of the first sighting data for this spring and will compare these data with those from other years. In addition, I will illustrate one way of assessing how the movement of first generation into the northern latitudes over the next six weeks determines the size and geographic distribution of the fall migratory population.
The stage specific model I’m developing is based on the premise that the number and timing of adult monarchs entering a stage together with the weather and sometimes, but more rarely, the role of predators, parasites and pathogens, determines the number of adult monarchs entering the next stage (or generation). The challenge is to identify data that defines timing and number along with inferences about the effects of weather. Such inferences are derived from a less-than-ideal understanding of how temperatures and soil moisture affect monarchs and the plant resources they depend on. Comparisons of weather and outcomes over the last 30 years help define these relationships. Since seasonal dynamics often determine the abundance of predators and parasites that in turn affect monarch numbers, it is possible to infer greater or lesser monarch mortality due to these factors under some conditions. Data are always better than inference, but inference can be useful if an inferred cause and effect relationship is consistent through time.
The narrative that follows is based on the timing and number of monarchs returning from Mexico, the weather, and in this case, a real possibility the survival of monarch eggs and larvae was higher in March compared to most years due to a relatively low number of predators and parasites. The data for 2024 will be compared with those of 2013, a recolonization that was followed by the lowest overwintering number in the record and 2014, a year of recovery from the all-time low.
Timing, numbers and weather
The temporal distributions for first sightings in March and April are shown in Figure 1. The numbers sighted for 2024 are a bit lower than the number tallied for 2013 but, given the dependency of sightings on weather and probably weekends when more observations are made, these records are similar. The difference is the earlier arrival of monarchs in March this year than in 2013. Earlier arrivals should be beneficial for a number of reasons as discussed below.
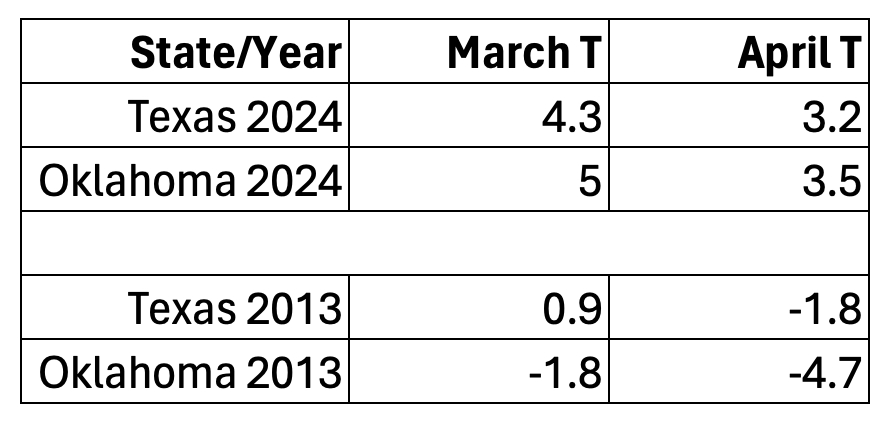
Weather, in this case temperature, is a factor in determining both the mean age to first reproduction for the first-generation cohort and the length of exposure to predators and parasites. Above average March temperatures in Texas can be favorable unless daytime highs and southwesterly winds enable monarchs to move too far north too soon as in 2012 and 2017. Moving into areas where the temperatures are lower in subsequent weeks, or before the milkweed has emerged, has a negative effect on population growth. The comparison of temperatures for March and April of 2024 and 2013 (Table 1) doesn’t explain the late arrival distribution in 2013 but does support the premise that lower temperatures slowed the growth of the population that year.
Figure 1. Distribution of first sightings in Texas in March and April by 5day intervals for the years indicated. 65% by 20 Mar 2024 vs 39% for 2013; Totals 96 vs 113.
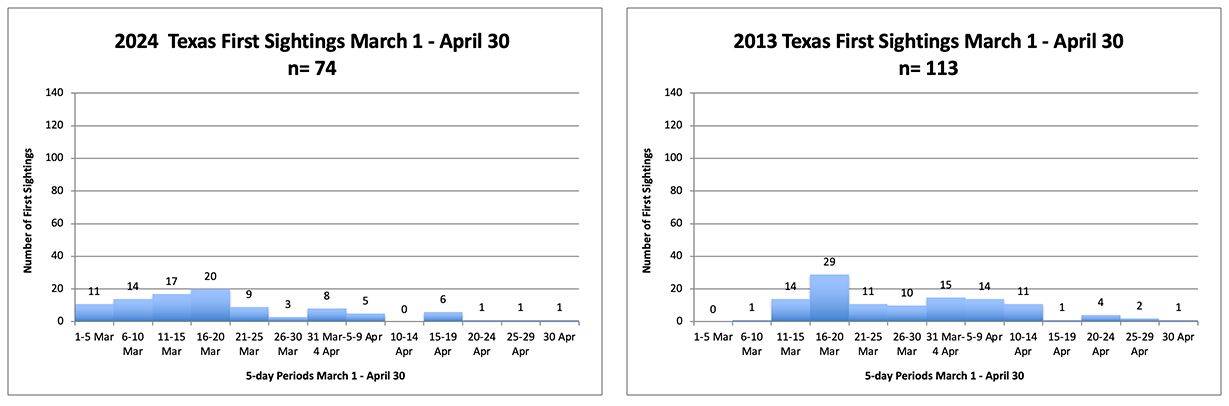
Table 1. Deviations from average temperatures (F) in March and April for Texas and Oklahoma in 2024 and 2013.
Temperature mediated latitudinal egg distribution
The concept indicated by this heading is based on the observation that temperature mediates the northward movement of monarchs and therefore the latitudinal distribution of eggs by females returning from Mexico. Whether the distribution of eggs into more northerly latitudes is beneficial or not depends on the temperatures that follow the interval during which most of the egg laying occurred. If the females advance too far north in April, as they did in 2012 and 2017, colder temperatures at higher latitudes can slow the development of immatures and slow the development of the population. In contrast, movement and egg laying by females into areas that experience warmer than average temperatures result in faster development of eggs, larvae and pupae and faster population growth. More rapid development also reduces exposure to predators and parasites and therefore higher average rates of reproductive success per female.
As you can see in Table 1, the temperatures in 2024 in March and April were higher for both Texas and Oklahoma while the comparable temperatures for 2013 were near or lower than the long-term average. The low temperature in April 2013 in Oklahoma likely lengthened the development of the first generation which contributed to the later colonization of the summer breeding ground north of 40N as seen in Figure 2. The influence of temperature on the latitudinal distribution of females and eggs is evident in the strong contrast between 2024 and 2013. The total March/April first sightings for Texas and Oklahoma was 159 and of these 40% were in Oklahoma. In 2013, the respective total was 122 of which only 4% were in Oklahoma.
Have monarchs benefited from a temporal disconnect between predator and parasite populations and their prey?
Surviving as a population, and sometimes even as a species, involves consistently producing more offspring than are lost to predators, parasites and sometimes pathogens – the consumer species. There is usually some sort of quasi balance between the prey and those that feed them such that the prey seldom attain outbreak numbers. But that does happen, and in the case of some butterflies, the cause appears to be a factor (or factors) that reduces the consumer numbers. Relative to the prey species, the consumer species tend to have longer breeding cycles, fewer generations and lower reproductive rates. Low numbers in the consumer populations mean that the prey lose fewer offspring, and with high reproductive rates, their populations can grow rapidly outpacing the growth of the consumer populations. These conditions can lead to massive “outbreaks” that often involve emigrations and migrations by species that are generally “held in check” by consumers. A clear example of this dynamic occurred in the spring of 2012 when 16 species of butterflies common to Texas disbursed or migrated northward through Kansas and beyond. In the case of red admirals (Vanesa atalanta), massive numbers created headlines along the path as they migrated well into northeastern Canada.
This multispecies outbreak in Texas followed the historic seven-month drought in 2011 that ended in Sept of that year. Seven months of rain followed. It’s likely that the drought knocked back the predators and parasites by the end of the drought and that they did not recover their numbers in the cooler months that followed. The rains, however, allowed the vegetation to recover including that of the host plants of a number of butterfly species such as false nettle – Boehmeria cylindrica – the main host for the red admiral in southern latitudes. Evidently the combination of lush host plants and low numbers of predators and parasites allowed the red admirals to build up rapidly in February and March leading to the migration in early April. Similar conditions, but less severe, and slightly different, occurred this spring. In January, two sweeps of freezing temperatures that extended well into Mexico probably reduced predator and parasite numbers over wide areas. Those events were followed by widespread rainfall and good plant growth, and once again, red admiral numbers soared leading to a rapid expansion of the population well into Canada and the northern states in the first three weeks of April.
Since many of the consumer species that attack red admirals also feed on monarch larvae, it’s reasonable to hypothesis that the welfare of the red admiral population is a positive sign that monarch larvae suffered fewer losses to predators in March than is usually the case. Further support for this hypothesis became apparent later in April through reports of three other Texas butterflies (buckeyes, American painted ladies and orange sulfurs) moving north in greater than typical numbers. Thus, it seems likely that monarchs have also benefited from a temporal disconnect between predator and parasite populations allowing the production of a larger than expected (based on first sightings alone) first generation – a generation that is rapidly colonizing the summer breeding areas north of 40N at this writing (3 May).
Colonization of the summer breeding area by first generation monarchs in May and early June
The offspring of the monarchs that return from Mexico start emerging and moving northward in mid to late April. This migration by first generation monarchs continues until the 12th of June at 50N. Directional flight ceases at that time (Note 1.). Once again, the timing and number of monarchs arriving at latitudes north of 40N (and across the longitudes from west to east) by the 10th or so of June largely determines the size of the migratory population in the fall. In 2013, few monarchs were sighted before the 20th of May across all longitudes and the overall number arriving was low (Table 2). This late start to summer breeding led to a small migratory population and the lowest overwintering number recorded to date (0.67ha). In 2014, the numbers returning from Mexico were higher and the conditions for the development of a large first generation were more favorable. These conditions led to a larger migratory population and a significant increase in the overwintering numbers (from 0.67ha to 1.13ha). As of the 2nd of May this year, the colonization of the northern latitudes is off to a good start with at least 22 recorded north of 40N relative to only 2 in 2013, 1 in 2014 and even 3 in 2018 – the year with the largest population in recent years (6.05ha) (Fig 3A, B, C, D). An additional 40 sightings were recorded through 7 May making the recolonization this year one of the three earliest in the 24year record. If the arrival of first-generation monarchs continues at this pace for the next two weeks, there is a strong possibility the overwintering population will more than double this coming winter (Table 3). Still, it’s early and there are a lot of “ifs” to consider.
Table 2. Distribution of first sighting in 10day intervals across longitudes quadrants (Q) from west to east for 2013, 2014 and 2018. The fourth quadrant (70W-65W) is not shown due to the low number of sightings. The timing and number of first sightings is critical. Low numbers and percentages in the first 20 days of May are associated with low migrations while high numbers sighted during the first 20 days of May usually signal large numbers of fall migrants.
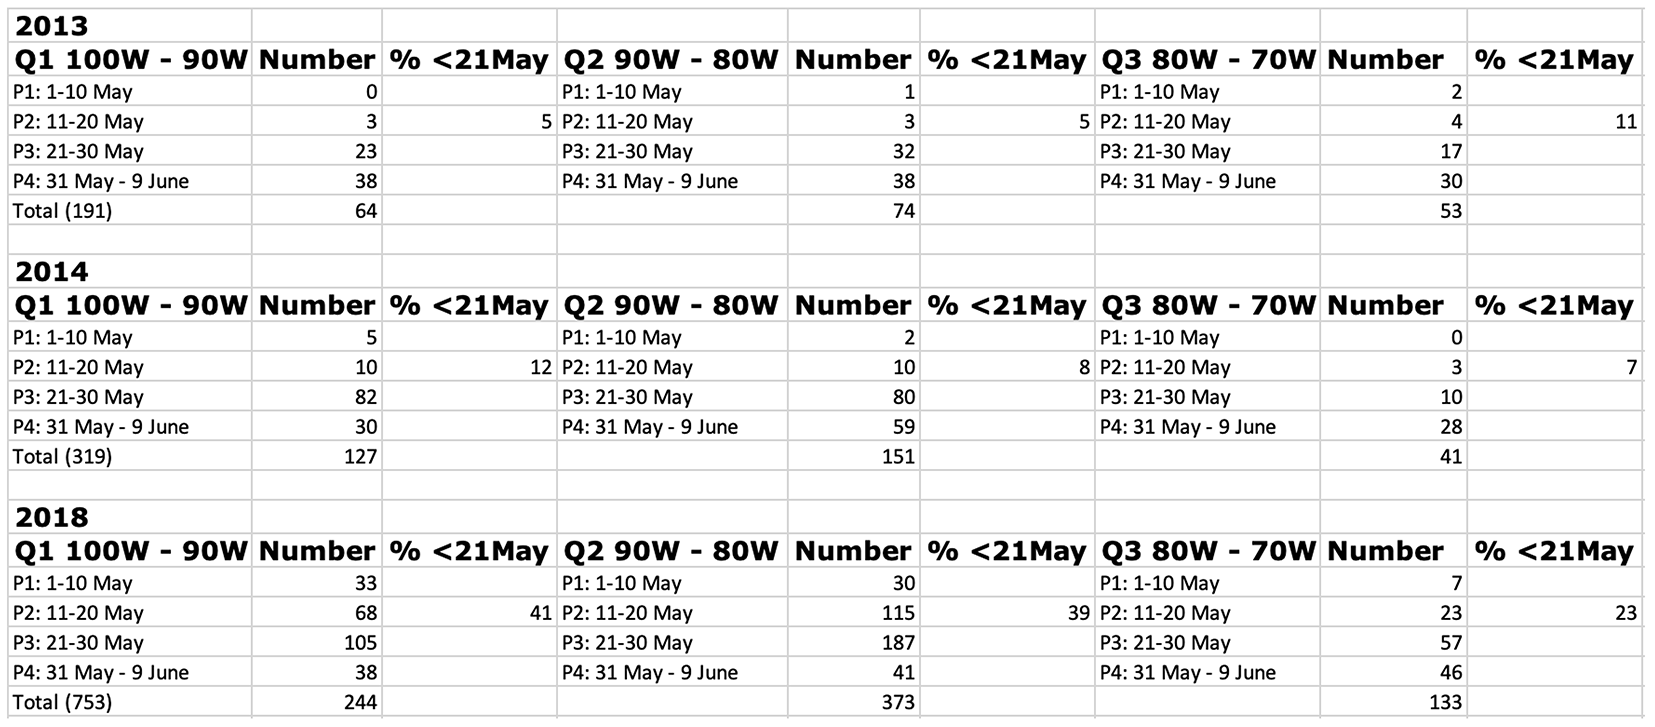
Table 3. Number of hectares in the previous winter for the year designated followed by the number of first sightings in Texas in March and April and the total first sightings for all areas as of the 2 of May. The number sighted north of 40N before 2 May along with the number sighted after 2May are indicated. The percentage of all sightings recorded for 1 May through 9 June are given for 2013 and 2014. The 62 sightings north of 40N for this year through 7 May represents an early recolonization by a relatively large number of first-generation females. These data were gleaned from Journey North. Where necessary, duplicate records and sightings from MX, CA and AZ and those with non-monarch images were subtracted from the raw totals.
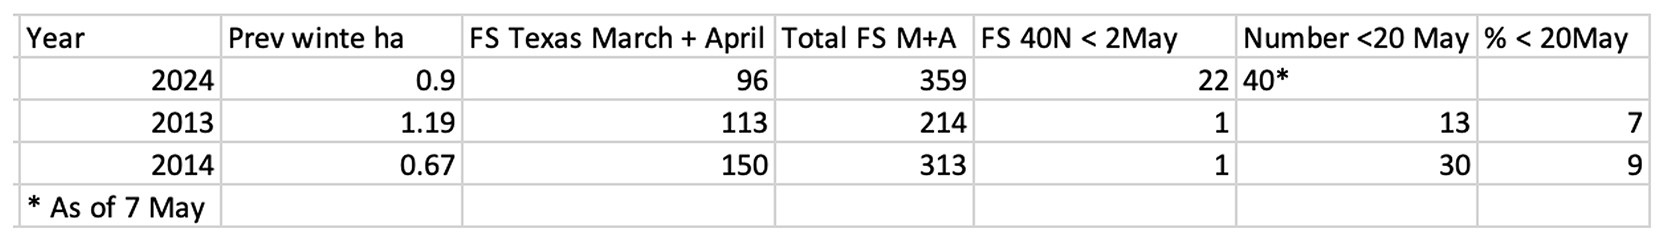
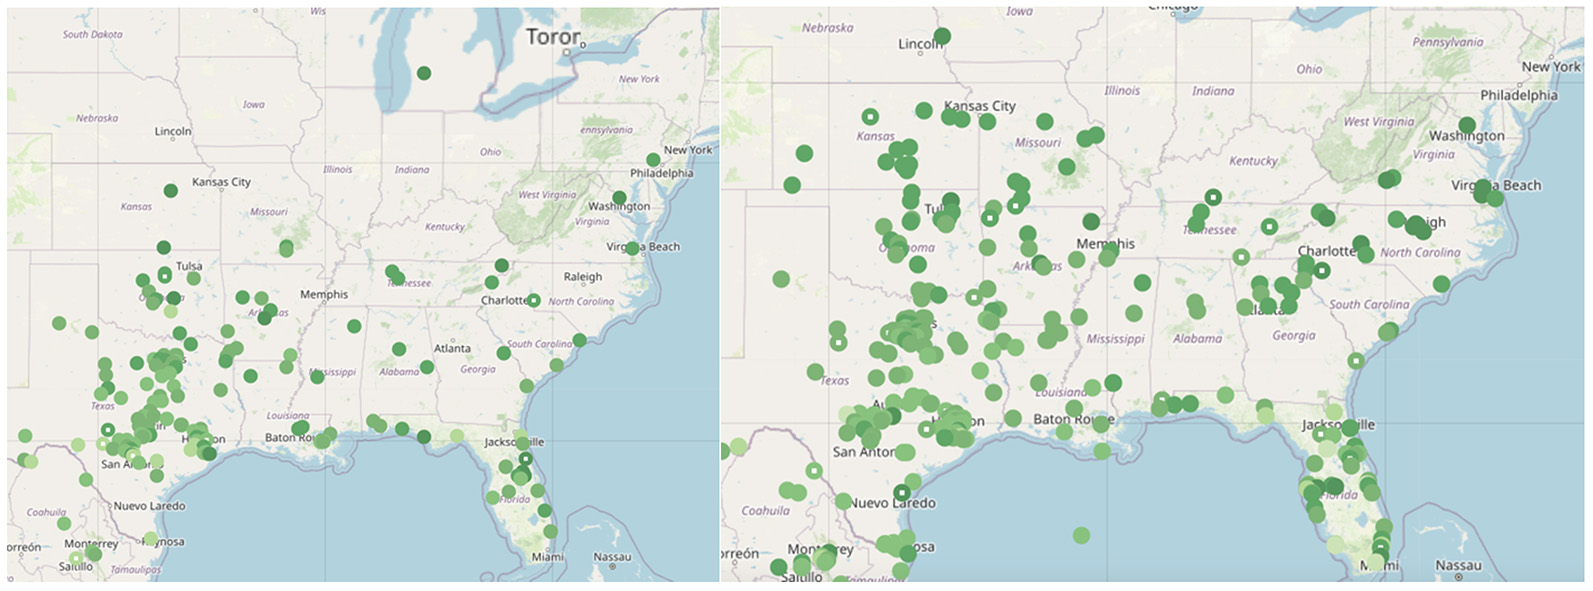
Figure 3. A. (below left) 2 May 2013 N=214 OW=0.67 B. (below right) 2 May 2014 N= 313 OW=1.13
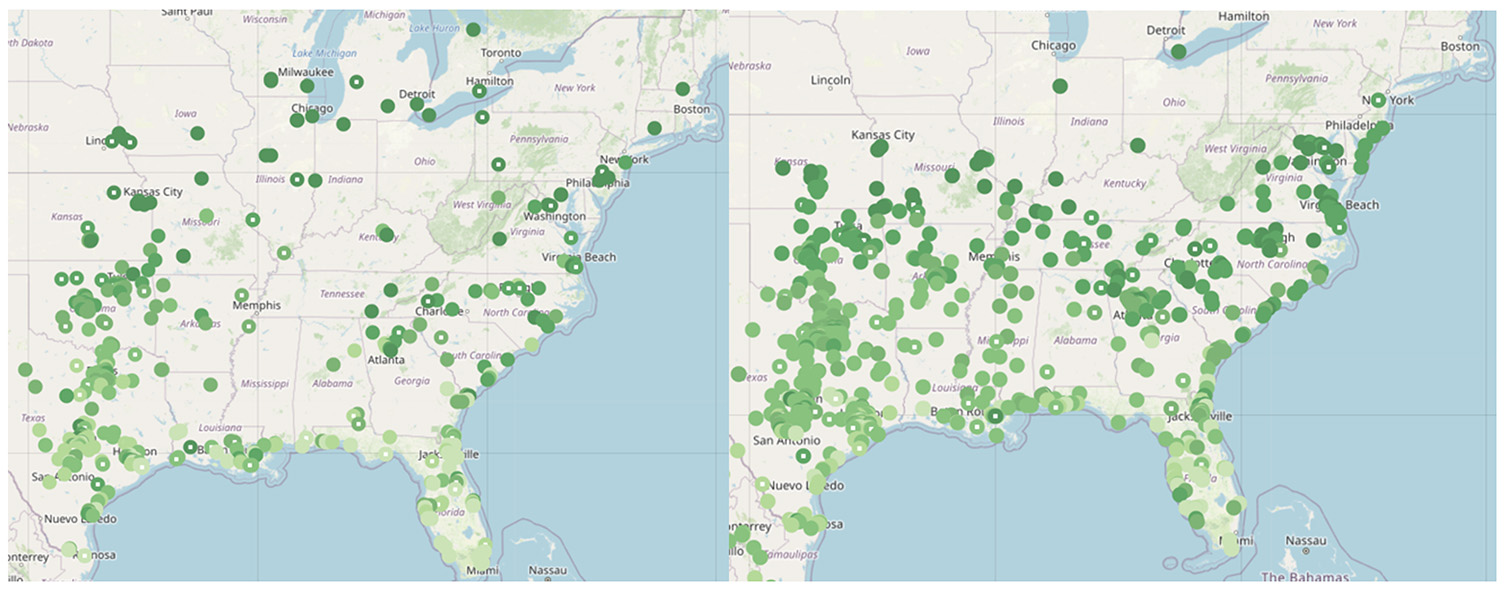
C. (below left) 2 May 2024 N=359 OW=? D. (below right) 2 May 2018 N=644 OW=6.05
What can go wrong after the spring migrations end in June?
I have examined the weather conditions for the breeding season and migration since 1994. During the last 30 years, the population increased from one year to the next during 14 years and declined in 16. Two factors during the summer breeding season appear to determine population growth while two factors during the migration appears to influence the number of monarchs reaching the overwintering sites in Mexico.
For the breeding season, the temperatures and rainfall during June through August for the Upper Midwest are usually close to the long-term averages (22/30 = 73%), but there have been extremes conditions that appear to have reduced the size of the fall migration and the overwintering numbers. These negative conditions and the years in which they occurred are listed below. The years tallied below are from a spreadsheet that is the basis for the next Blog article – “The curvilinear monarch”.
Droughts and or extremely high temperatures from June through August in the Upper Midwest: 1995T, 2003P, 2012TP, 2020T, 2023P.
Extremely low summer temperatures: 2004 and 2009.
During the fall migration, extreme conditions such as droughts in Texas and higher than average September temperatures are both associated with lower numbers of monarchs reaching the overwintering sites. These events are common having occurred in 18 of the last 30years (60%). There have been only 13 years in the last 30 in which neither of these extreme events occurred, the population increased in 9 of these years but declined in 4 apparently due to other strong negative events. The frequency of years with high temperatures in September appears to be increasing.
Droughts in TX in October: 1999, 2000, 2011, 2015, 2019, 2022, 2023.
Higher than average temperatures from the start of the migration in early August at 50N to the end of September as the migration enters OK: 1998, 2002, 2004, 2005, 2009, 2013, 2015, 2016, 2017, 2018, 2019, 2023.
Looking forward, there is a good chance the population will increase during this breeding season and migration from an overwintering population 0.9ha to over 2ha – if the conditions from June through October are close to the long-term average. Negative events occur in about 60% of the years and the incidence of such events is increasing. It is often the strength of a negative event that determines the difference between one year and another.
Acknowledgements
This report would not have been possible without the long record of first sightings reported to Journey North under the direction of Elizabeth Howard and later Nancy Sheehan. Janis Lentz assisted with the tabulation of the first sightings and Jim Lovett assisted with the layout and posting of this text.
Note 1. Those readers interested in why monarchs “appear” to abandon directional flight in the early summer might find the following post interesting and challenging:
https://monarchwatch.org/blog/2022/04/22/monarch-puzzle-wrap-up/
Note 2. For a discussion of how low temperatures in May and early June can limit the number of first-generation monarchs reaching Canada, please see:
https://monarchwatch.org/blog/2023/07/09/monarchs-reaching-50n-and-beyond/


Sorry, comments for this entry are closed at this time.