Monarch population development in 2024: Part 3
Friday, June 28th, 2024 at 4:07 pm by Chip TaylorFiled under Monarch Population Dynamics | Comments Off on Monarch population development in 2024: Part 3
The expectations were low at the beginning of this breeding season. The overwintering numbers were the second lowest in the record (0.9ha), and it was reasonable to expect low numbers of monarchs to return from Mexico in March. It was easy to envision that, like in 2013 (the lowest population recorded at 0.67ha), it would take several years for the population to recover. As expected, the early numbers of returnees were low, but they were early and that was a positive sign that the population might recover. That was followed by more positive sign of recovery in Part 2 and even more in the text that follows. At this date in the middle of June, it seems safe to say that the numbers indicate that the growth of the population this year is comparable to that of most populations since 2015. The recovery to this point is nothing short of extraordinary and is a testament to the monarch’s resilience. The question now is – what’s ahead?
We are 3.5 months into the breeding season at this writing (15 June). By my calendar, the breeding season starts on the first of March, the date the first monarchs returning from overwintering in Mexico cross the border into Texas. The breeding ends progressively southward in the fall as the declining angle of the sun at solar noon approaches and drops below 57 degrees. That means that reproduction all but ceases in the vicinity of Winnipeg (50N) in the first week of August but not until the first week of October at the latitude of San Antonio, TX. Since most of the monarchs that overwinter in Mexico originate from north of 40N, for the purpose of analysis, I use the first week of September as the end of the breeding season. So, in total, the breeding season is effectively 6 months in duration (7 months if we want to be more inclusive) and the monarchs are more than halfway through it with 2.5 months to go. This report is therefore all about the development of the population to this point as well as what we might expect in the next 2.5 months. In addition, because the migration begins at 50N in early August, and overlaps the breeding season until the first week of October, I will say a few words about what to expect during the migration.
Directional/migratory flight for this season has stopped based on our analysis of the link between day length and directional flight. That means colonization has stopped, it’s over and all sightings from here on are of monarchs that have already reached their northernmost latitude and easternmost longitude. So, how effective has this recolonization been and how does this year compare with others? There are several ways to judge these recolonizations. The spatial distribution is one feature, the numbers of sightings are another and the timings of the recolonizations are another. We might also look at the longitudinal distribution of all sighting through the colonization period. To all of those considerations, we can ask whether temperatures or other weather conditions influenced colonization. Let’s start with mapping.
Mapping
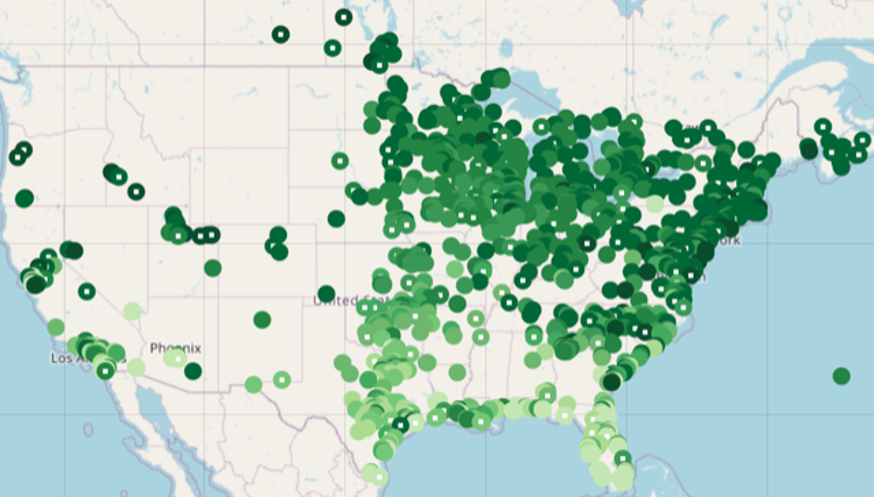
First sightings recorded by Journey North 11 June 2024.
First sightings recorded by Journey North 13 June 2018.
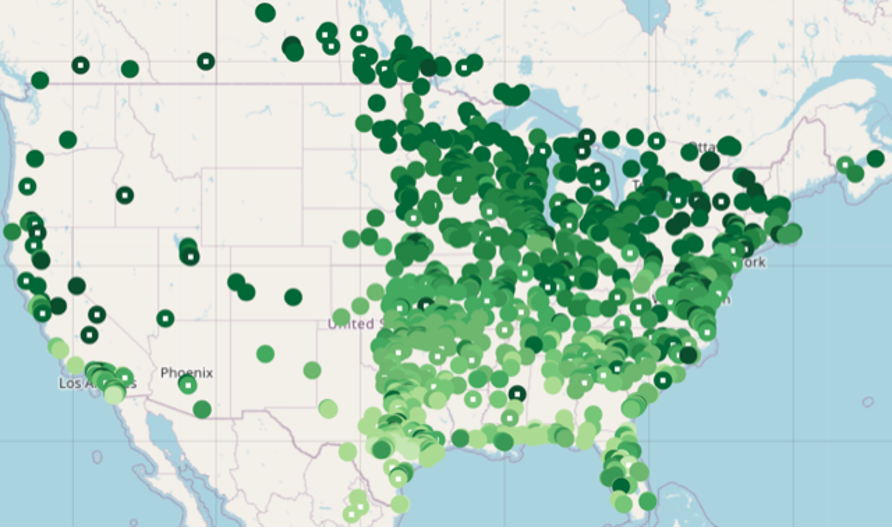
These two maps look similar. In 2018, there were more sightings in Manitoba but fewer in the Maritimes than in 2024. The more important comparison is the Upper Midwest where there appear to have been more first sightings in 2024. But, it’s hard to tell. We have to dig deeper. I’ve used 2018 to compare with 2024 since the population in Mexico in that winter was 6.05 hectares, the largest population since 2006. So, the similarity is promising indeed. However, if one scans through all the maps of past years, they all look very similar – until you get back to the maps for 2013, 2014 and 2015 all of which show poor recolonization. This was the time of the previous low mark in the population with only 0.67ha measured in 2013.
First sightings recorded by Journey North 13 June 2013.

The recolonization in 2013 was numerically the lowest and latest in the first sighting record and it foretold the overwintering number. One point to make here is that the first sightings map and numbers for 2024 are far better than those of 2013-2015.
Numbers of sightings from 1 March through 9 June
The numbers that follow are rough. The number of people reporting first sighting has increased in recent years and I did not scan the records to eliminate duplicates or records west of the Rockies. Nevertheless, the numbers are of interest since they show the low recolonization in 2013 (552) and a rough similarity between 2018 (1739) and 2024 (1397). If we add one more year, for example 2021 with 2429 sightings and 2.83 hectares at the end of the season, it becomes clear that the number of sightings is only part of the story.
If we refine the numbers a bit by limiting the counts to the total sightings in the summer breeding regions north of 40N, we get the numbers summarized in Table 1. Again, we can see some similarities and differences of interest.
The number for 2013 (107) is low as expected and 2024 is similar to a number of years when we just consider the total through 9 June (2019, 2018, 2017). If we compare all sightings north of 40N, 2024 is similar to both 2022 and 2018.
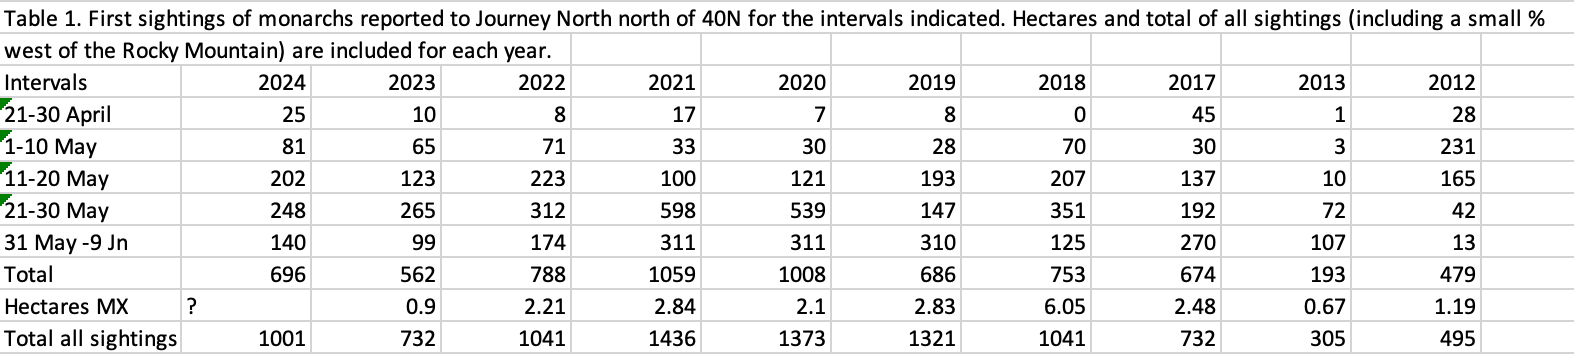
There are two points that can be made here. First, the first sightings in 2024 are comparable in number to those of other years with relatively good overwintering numbers and second, they are far better than expected for a population with the second lowest number of wintering monarchs in the 30year record – and much better than from 2013-2015.
Distribution and timing
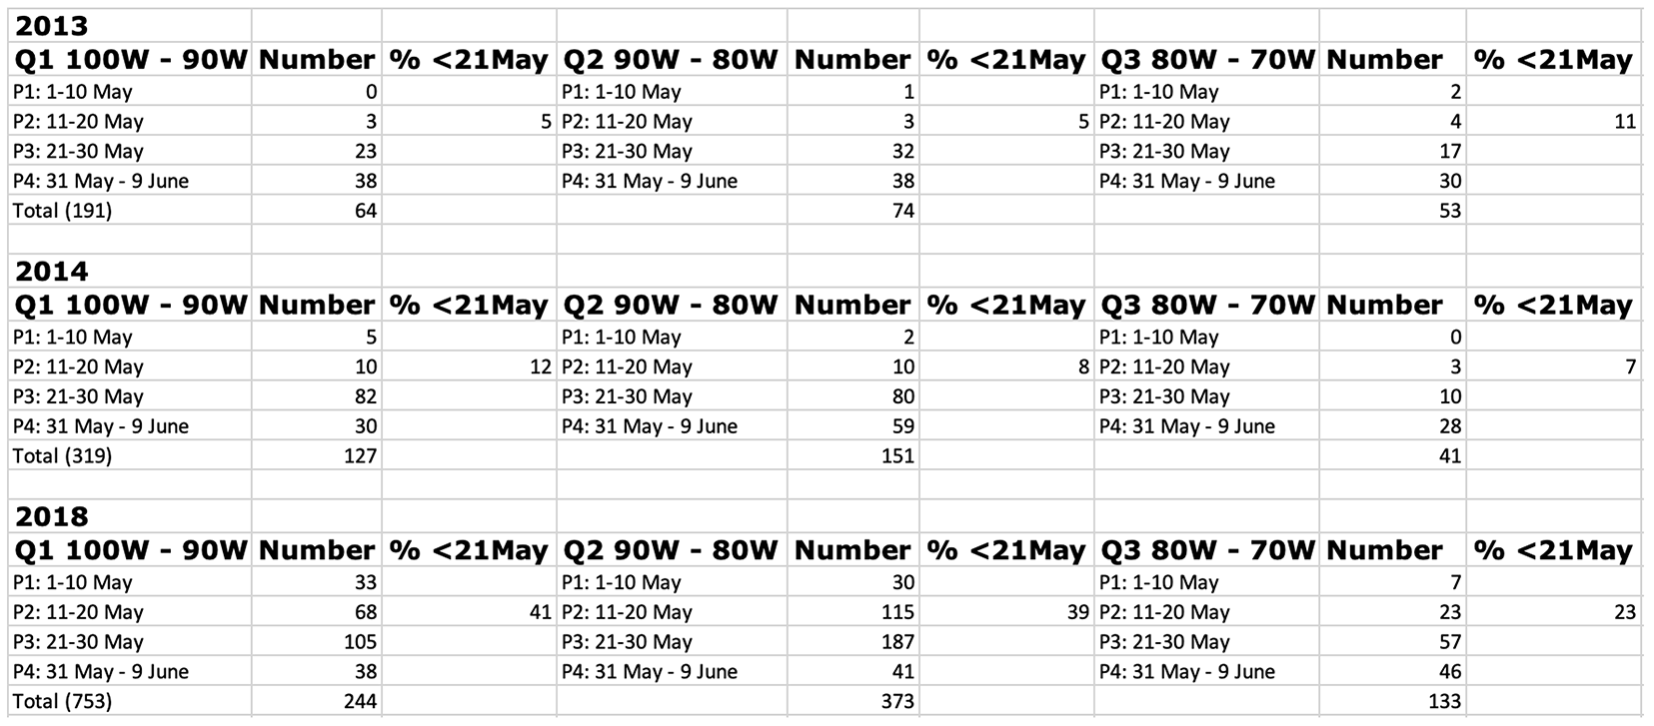
The connection between the distribution and timing of first sighting is summarized for 2013, 2014 and 2018 in Table 2. The overall pattern of colonization from west to east is similar for all years. The percentages of the first sightings before 21May were low for both 2013 and 2014 but much higher for 2018 (23%) and even higher for 2014 (55%). Low numbers and percentages in the first 20 days of May are associated with low fall migrations while the opposite hold for high numbers and percentages. This indicates that the timing and number of females starting the second generation has a role in determining the size of the third generation that becomes part of the migration. An early start to the second generation could, under the right conditions, lead to a fourth generation in some locations, and that could happen this year.
Table 2. Distribution of first sighting in 10-day intervals across longitudes quadrants (Q) from west to east for 2013, 2014 and 2018. The fourth quadrant (70W-65W) is not shown due to the low number of sightings. The timing and number of first sightings is critical. Low numbers and percentages in the first 20 days of May are associated with low migrations while high numbers sighted during the first 20 days of May usually signal large numbers of fall migrants. The third quadrant (Q3) tends to be colonized later than the first two quadrants as a result of the general movement of the spring migration to the northeast.
Weather
Monarch population development is largely a function of weather conditions that occur during the breeding season. That said, the upper limits to the size of the population are determined by the abundance, distribution and quality of the milkweed and nectar sources available.
With temperatures and precipitation, it is common to work with deviations from long-term means. However, a 4F deviation can be favorable or unfavorable to monarch development depending on the base. Generally, positive deviations in the spring favor rapid development of eggs, larvae and pupae, but, as I have pointed out elsewhere, high March temperatures can enable monarchs returning from Mexico to migrate too far north too soon. In this case, higher temperatures can have different effects on immatures and adults. However, during the migration northward in May by first generation monarchs, because the seasonal means are low, elevated temperatures during that month benefit the development of immatures and the northward migration by first generation adults. This May the mean temperatures favored growth and migration for the entire breeding range north of 40N (Table 3). These conditions contributed to an earlier colonization of the northern latitudes than seen in many years and an earlier start to the second generation.

Analysis
The dive into the first sightings data to create these reports, has given me a deep appreciation of the value and utility of this 25-year record. I’ve identified two statistically significant trends in these data.
First, May temperatures in Minnesota are correlated with the percent of first sightings that occur in the last 10-day interval in the 40 days from 1 March through 9 June, p<0.0001. In this case, it is clear that low May temperatures delay recolonization while high temperatures enable earlier recolonization. This result has implications for the recolonizations of the highest latitudes and eastern Canada. In years during which the May temperatures in Minnesota or the Upper Midwest are low, it is likely monarch numbers throughout the breeding season will also be low throughout Canada (Taylor, 2023). Second, the total first sighting of monarchs that return from Mexico recorded in March and April in Texas and Oklahoma is correlated with the total first sightings of first-generation migrants recorded north of 40N before 10 June, p<0.0001. This means the number of first sightings of returning monarchs are a reasonably good predictor of the size of the first generation.
Outlook
The weather conditions from June through August strongly influence the development of the second and third generations. In the Upper Midwest, the source of about 70% of the monarchs that reach Mexico (Taylor, et al., in prep), mean temperatures in excess of either +3F or -3F in July or August have a negative impact on population growth. High temperatures, especially if combined with low soil moisture, likely result in a reduction of lifespan, egg laying and larval survival, in effect, a reduction in what is known as realized fecundity. Low temperatures allow females to lay eggs over an extended interval but delayed development can expose immatures to predation for a longer interval and lengthen overall generation length. The overall effect is an older age to first reproduction for the next generation which would also tend smaller. These results are clear in the weather records for the last 30 years. The summers in 2004 and 2009 were too cold and the high mean temperature in July of 2012 (+5.3F) combined with drought conditions reduced the size of the migratory populations in those years.
The temperatures in the Upper Midwest this June have been close to the long-term average. Rainfall has been excessive in some areas of the Dakotas, Iowa and Minnesota which could have a negative impact. Excessive rainfall or intervals of more than three days that are too cold for feeding, mating and egg laying surely have a negative impact on growth but is difficult to assess.
The July forecast for the Upper Midwest is not as favorable and could be a problem since the mean temperature is projected to be +3F above the long-term average. This means the size of the third generation could pivot on the accuracy of this forecast. Temperatures substantially greater than +3F, could reduce the size of the fall migration. The conditions in August are seldom extreme, although there is often a carry-over from the conditions in July. July is crucial. We need to follow the conditions closely.
Once past July, the focus shifts to the temperatures and precipitation in August since they determine both the development of the third generation and start of the migration.
In recent years, high temperatures during the first 6 weeks of the migration from late August through September have slowed the pace of the migrations. These conditions are associated with lower-than-expected numbers of monarchs reaching the overwintering sites and that scenario could develop this year as well.
Droughts in Texas and Oklahoma in late September and October are always a concern. Last fall the extreme drought that extended from Oklahoma through most of Mexico had a strong impact on the number surviving the migration (Hobson et al., 2023). At the moment, drought is not widespread in Texas and whether a drought will develop by October is unclear, but it is something to watch for. Similarly, the conditions in Mexico are a concern since the drought that developed last year still persists along most of the path monarchs take to reach the overwintering sites.
Overall, the outlook is mixed. If the weather conditions in the Upper Midwest remain close to the long-term average through August, the migration could represent a remarkable recovery from a low overwintering population and a relatively small number of monarchs returning from Mexico. Further, if conditions are favorable through the migration, there is the possibility that the numbers this winter could represent the strongest recovery in the record. But, reaching that lofty goal will surely be out of reach if the drought conditions in Mexico persist into October.
References
Hobson, K., O. Taylor, M.I. Ramirez, R. Carrera-Treviño, J. Pleasants, R. Bitzer, K.A. Baum, B.X. Mora Alvarez, J. Kastens, and J.N. McNeil. 2023. Dynamics of stored lipids in fall migratory monarch butterflies (Danaus plexippus): Nectaring in northern Mexico allows recovery from droughts at higher latitudes. Conservation Physiology 11(1): coad087. https://doi.org/10.1093/conphys/coad087
Taylor, O.R, 2023. Monarch Watch Blog. Monarchs: Reaching 50N and beyond.
https://monarchwatch.org/blog/2023/07/09/monarchs-reaching-50n-and-beyond
Taylor O.R. Jr, Pleasants J.M., Grundel R., Pecoraro S.D., Lovett J.P., Ryan A., and C. Stenoien. (In prep) Geographic and temporal variation in monarch butterfly migration success.
Acknowledgements
This report would not have been possible without the long record of first sightings reported to Journey North (University of Wisconsin–Madison Arboretum) under the direction of Elizabeth Howard and later Nancy Sheehan. Janis Lentz assisted with the tabulation of the first sightings and Jim Lovett assisted with the layout and posting of this text.


Sorry, comments for this entry are closed at this time.