Monarch Watch Blog

The Western monarch puzzle: the decline and increase in monarch numbers

29 May 2023 | Author: Chip Taylor

Preamble

The first draft of the text that follows was written without consulting the literature. I wanted to work out my interpretations without the weight of the points of view of others. While I drew on my memory of the literature for the portions of the narrative dealing with demography, the behavioral interpretations were based on my experience. The idea was to add references later, and I have done so, but the list of relevant texts is surely incomplete. In my search of the literature, I came across a paper published in 2018 (Fisher, A., et al. Climatic Niche Model for Overwintering Monarch Butterflies in a Topographically Complex Region of California) that I should have remembered. It’s likely that prior knowledge of that paper would have changed my approach to the subject. As it stands, some of what follows validates the niche model outlined in that paper and it could be said, that the model, at least the portion that deals with overwintering, supports my interpretations. Just as there are no quantitative data to assess the validity of the model at this time, there is no way to validate my interpretation of what happened in the fall of 2020 and the 2021 growing season. Both are based on known properties of overwintering sites and conditions and known behavior of monarchs and both appear to be reasonable based on our current state of knowledge.

The Western monarch puzzle: the decline and increase in monarch numbers
by Chip Taylor

Introduction

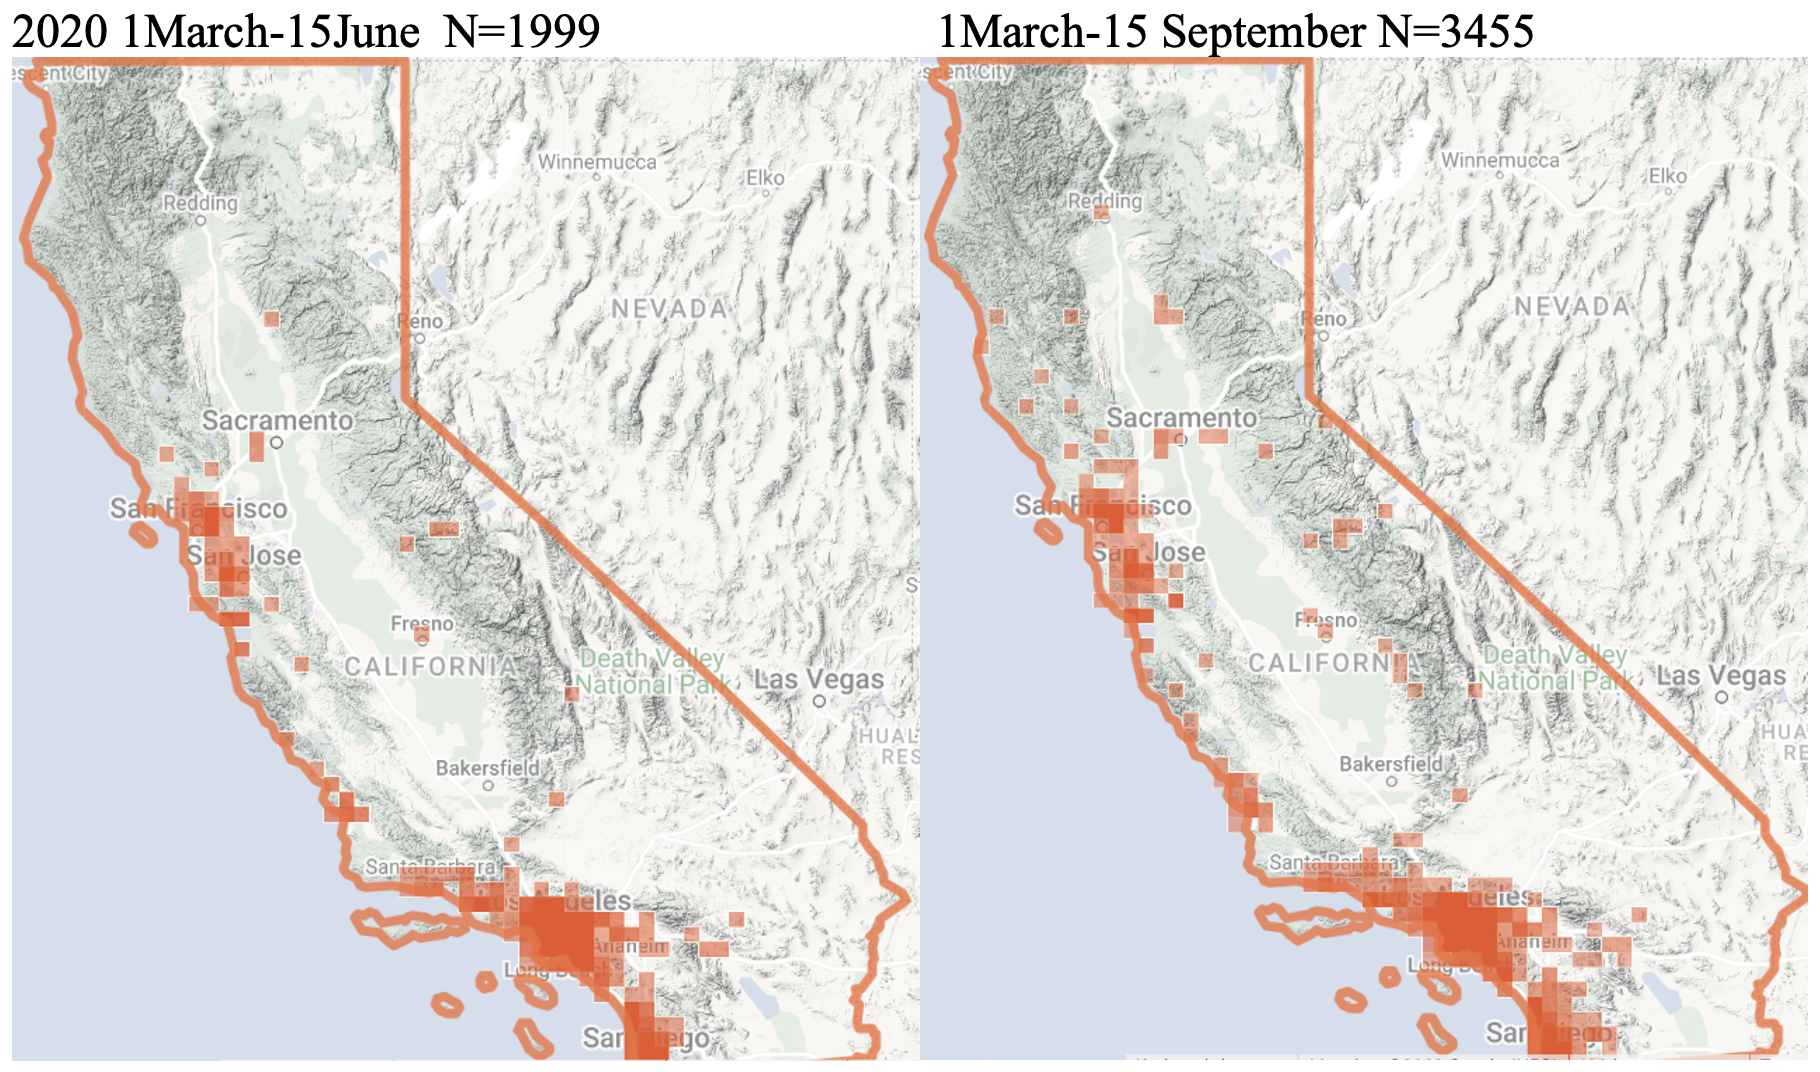
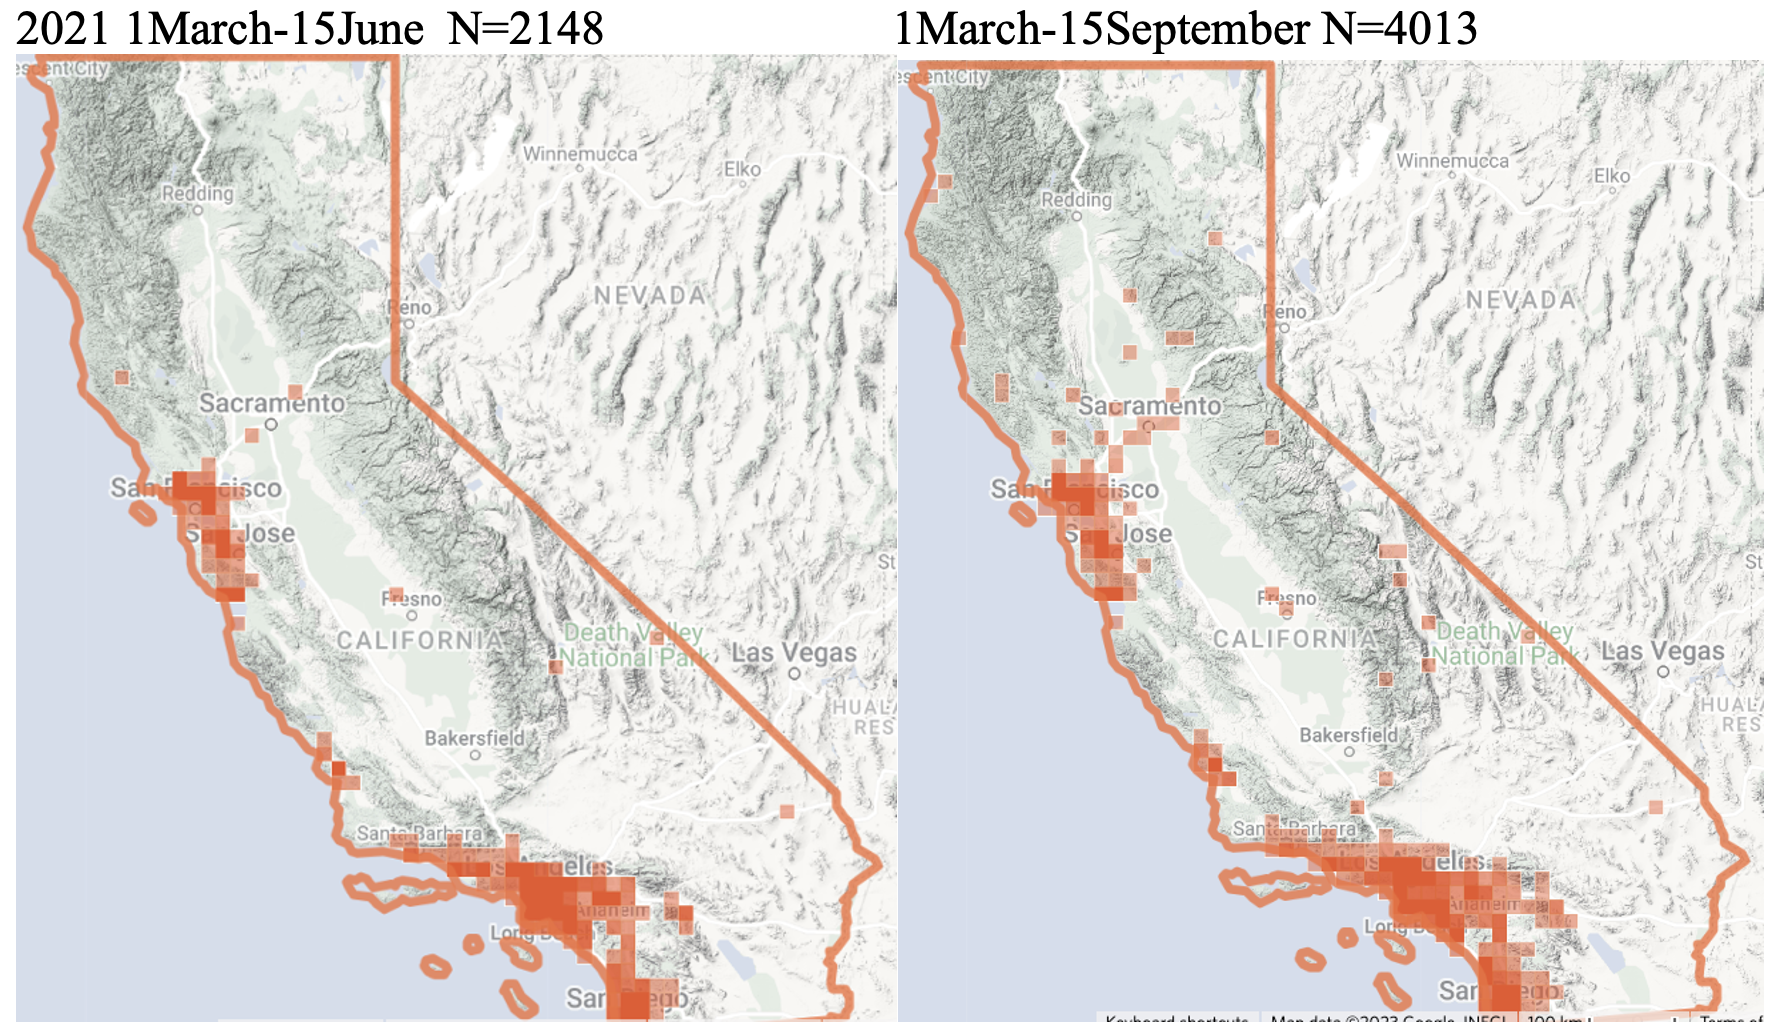
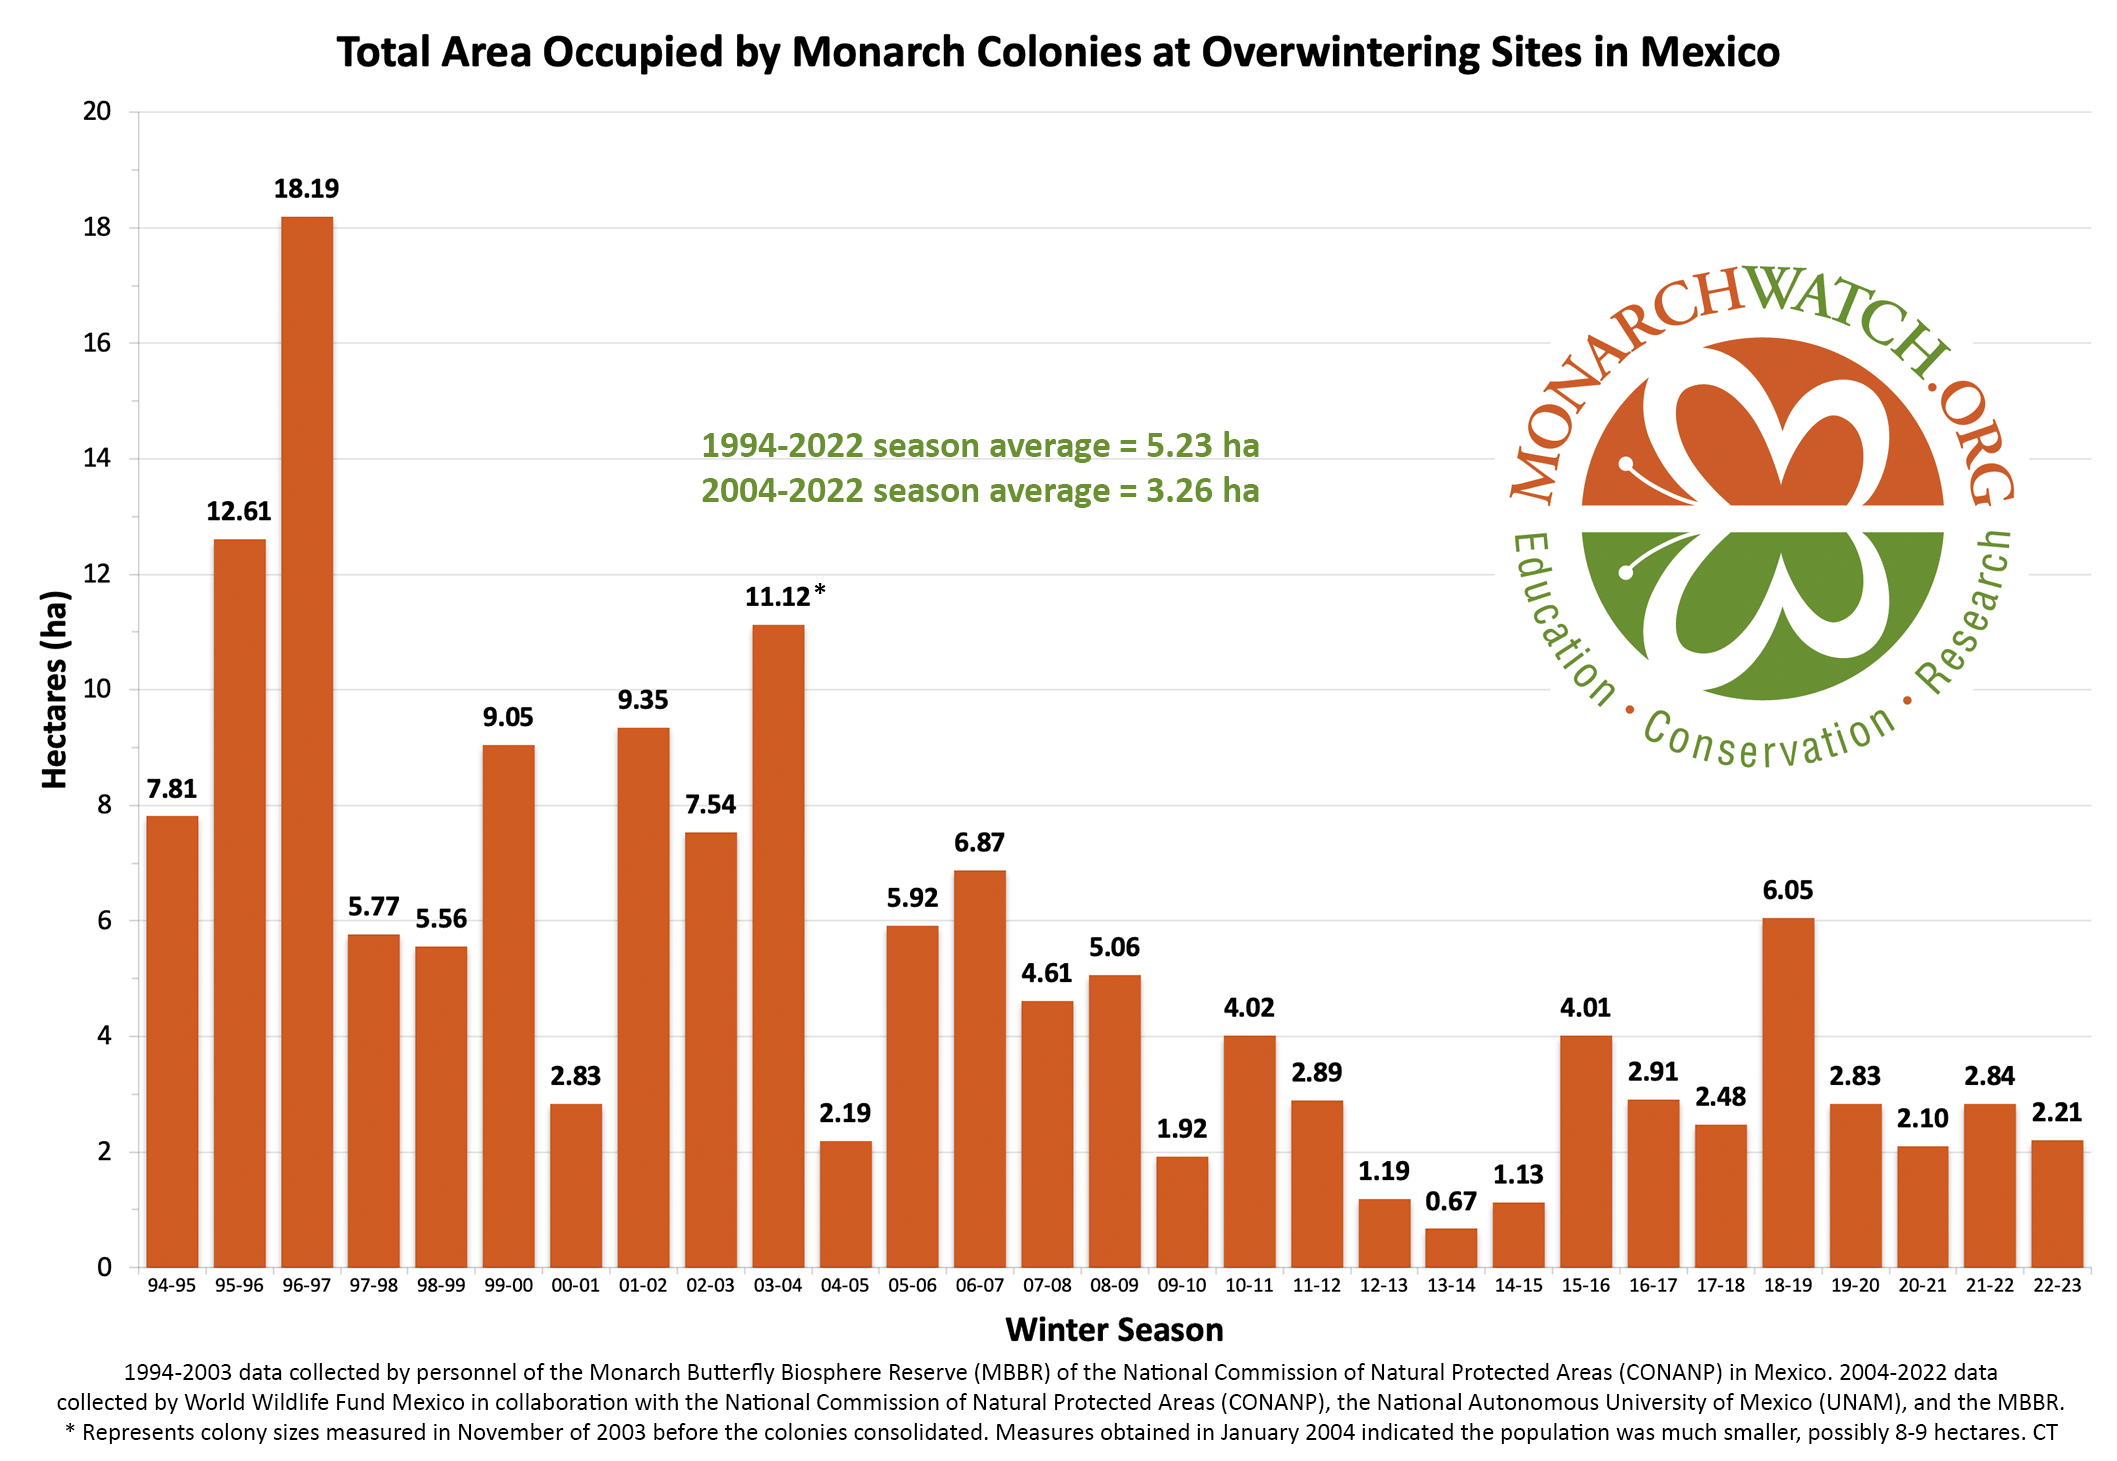
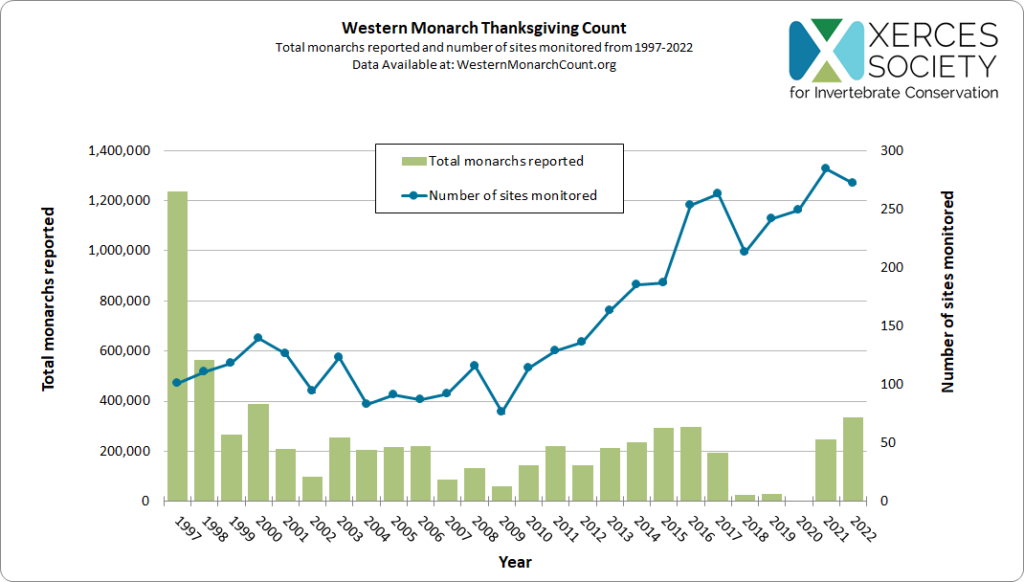
The Western monarch population declined sharply in 2017 followed by further declines in 2018 and 2019. Even more alarming, and yet perplexing, were the counts of 2020 and 2021. The Thanksgiving counts in 2020 yielded only 1849 monarchs at California overwintering sites from San Diego County in the south to Sonoma County in the north (Western Monarch Thanksgiving Count Data, 1997-2021). Of the 249 sites examined, the vast majority had zero to less than 20 monarchs, and there were only 5 sites with more than 50 (westernmonarchcount.org). These numbers were taken as a clear sign that the population was below the theoretical extinction threshold and that recovery from such a low number was problematic (Pelton, et al., 2020, Semmens, et al., 2016). Yet, the Thanksgiving count in 2021 yielded 246,253 monarchs at California sites – an over 100-fold increase – and the 8th highest count in the records since 1997 (Western Monarch Thanksgiving Count Data, 1997-2021). There have been many attempts to explain this rate of increase since it’s impossible for a cohort of 1849 overwintering monarchs to initiate a cascade of reproduction over 3-4 generations that would result in a large fall migratory population. This result is improbable since the number of surviving females would have been less than 600, and the known rates of mortality for all life stages indicate that rates of increase are strongly constrained. Clearly, the population growth in 2021 was initiated by thousands of females, perhaps 10s of thousands. The need to understand the increase leads to questions about where those females came from.

In the text below, I will make the case that, due to the all-time high temperatures along the coast in September and October in 2020, large numbers of non-reproductive monarchs overwintered inland from the coast in small scattered clusters and that these monarchs survived to mate in late February and March. The high temperatures during September-October may also have resulted in many butterflies terminating reproductive dormancy both before and after reaching coastal areas. Some likely dropped out of the migration and failed to reproduce in areas with few or no milkweeds. Others, especially in urban areas where milkweeds were available, continued breeding through the winter months (James 2021, James et al. 2021). The overwintered females, perhaps joined by some breeding monarchs from urban areas, mated and moved inland. These females laid a sufficient number of eggs to produce a large first generation that then migrated eastward to the Sierras and the inner mountain West where, in the course of 3, and in some cases, 4 generations, a migratory population of more than 300K monarchs progressed toward the California coast in September and October. Unlike in 2020, these monarchs encountered October temperatures that were slightly below or close to the long-term average all along the California coast leading to a resurgence in numbers at the overwintering sites.

This interpretation is based on the behavior of diapausing monarchs that seek moderate (60-75F) to cool (40s-60F) temperatures to maintain a non-reproductive condition through the migration and the winter months. Additional support for this hypothesis comes from the decline in monarch numbers since 1998 at overwintering sites in the three southern-most California counties. These declines appear to be related to both increases in temperature from September through December and a general decline in monarch numbers (see Addendum). The estimations of the number of reproducing females required to create a large first generation that migrated to breeding areas are based on data and estimations of mean number of eggs per female and the probabilities of surviving from one generation to the next.

Interpretation

In the narrative that follows, I will outline an explanation for why the overwintering Western monarch population appeared to be at an all-time low in 2020 yet increased in a spectacular manner in 2021. I will explain why the low numbers at overwintering sites in 2020 and the relatively high numbers in 2021 are rooted in the monarchs’ response to temperature that is based on their need to remain non-reproductive during the winter months. In effect, I will set forth a hypothesis based on the response of adult monarchs to temperature. Support for the hypothesis is based on observations of monarch behavior in Kansas, Texas and Mexico and the decline in the numbers of sites and monarchs as temperatures increased over the last decades in San Diego, Orange and Los Angeles counties.

The scenario I envision was foretold by Fisher, et al., 2018 in their niche model paper that predicts the tendency for wintering monarchs to move away from the coast to winter in cooler locations in the coastal foothills if coastal temperatures continued to increase. As they pointed out, “Our results suggest that estimating the size of the western overwintering population in the future will be problematic, unless annual counts compensate for a shift in the distribution and a potential change in the number and location of occupied sites.”

Let’s start with what we think we know about the influence of extremely high temperatures on monarch migrations and on monarch physiology and behavior. Three things are likely to happen when the temperatures are extremely high (>90F) during the migration. First, the start of a migration can be delayed. Late recolonizations in May and June can result in later migrations that can be further delayed due to high temperatures that stop the migration or reduce the number of flight hours per day (Taylor, et al., 2019). Second, some of the monarchs will become reproductive since high temperatures increase the production of juvenile hormone and ovariole development. Third, monarchs become highly dispersed and do not form high density clusters under high temperatures. The latter point is supported by observations of clustering behavior when temperatures are in the 90s in Kansas and Texas and the numerous observations of temporary clustering sites that form from mid-October into early November in many areas along the California coast. Next, we need to know how monarchs respond to temperatures while at overwintering sites. Surviving from late October to reproduce in late winter or early spring requires that monarchs remain non-reproductive – a state of low endocrine production, low metabolism and low energy expenditure. To stay non-reproductive, monarchs appear to seek low temperatures that help maintain this condition.

Based on these considerations and data on the conditions that favor population growth, I have been trying to develop a stage specific model for the Western monarch population. The premise of the model is that an analysis of the effects of both physical and biotic factors within a stage allows us to predict the numbers entering the next stage. By tracking the results through all stages, it should be possible to a predict the relative size of an overwintering population. There are five stages in the West: overwintering, reproduction by overwintered adults, migration by first generation monarchs to the inner mountain West and Northwest, summer reproduction and fall migration. The temporal sequence of those stages is reasonably clear and is similar to the same stages in the East. What is less clear is where the monarchs breed in the summer months that return to the coastal areas each fall. Sometimes, the main production areas seem to be in the NW, and in other years (such as 2021) the conditions in the inner mountain west to the east of California seem to be the more favorable for monarch production. As part of the model, I’ve developed a large matrix of the monthly and stage specific time periods for the years 1998-2021. The matrix includes the temperatures and rainfall amounts for each interval. The idea was to use these data to determine if the physical factors could account for the decreases and increases in monarch numbers. The one and only monarch data base in the mix was the yearly monarch counts – the Thanksgiving counts coordinated by the Xerces Society. The underlying assumption has been that these totals (or the totals each year from the 20 sites measured most consistently) are reasonable representations of the population and therefore serve as a measure of the size of the monarch population. Indeed, comparing stage specific temperatures, and sometimes rainfall, seemed to work, and there is a reasonable but not entirely satisfactory explanation for the crash in the population from 2016-2019 based on these values. Yet, there were inconsistencies. There were years in which the Thanksgiving counts were lower (2001) and others when they were higher (2014) than expected based on the temperatures and rainfall amounts from one stage to the next. Overall, the explanatory power of the assembled data, once promising, was rather weak. Something was missing.

I was stuck but still hopeful. There was a mismatch between the metrics and the overwintering numbers. I was either using the wrong metrics or the numbers weren’t adequately representing the size of the population and both could be off. The metrics were certainly off being too course to reveal the details of population growth. But what about the Thanksgiving counts?

One approach to getting unstuck is to write down all your assumptions and to detail all you know about each assumption. In the case of the Thanksgiving counts, there are several assumptions. First, all the teams making the counts are equally skilled at “estimating” the number of monarchs in each cluster they examine. Second, all, or nearly all, roosting sites are located each year and that all clusters at each site have been identified and counted. Third, all, or nearly all, the migratory monarchs cluster at the coastal sites. Indeed, Schultz et al., 2017, assume that the monitoring constituted “an independent index of the total abundance in that year.” Human error is expected since making the counts is extremely difficult, demanding and tiring. Kudos to all those who have engaged in these counts and doing their best to be accurate. Given the conditions, the number of sites, the coordination required and more, these counts are a significant achievement. So, as counts go, due to the difficulties, we can expect some over-counts and under-counts at various sites. It follows that another assumption might be that these counting errors cancel each other out with the result that the counts are reasonable estimates of monarch numbers at the end of each season. Ok, if we accept that premise, we can ignore the third assumption – that all the monarchs cluster at the overwintering sites. The numbers don’t lie, except when they don’t represent what we think they do. It’s reasonable to expect that the counts are accurate measures of the population. After all, the monarchs in Mexico represent all areas east of the divide, with the exception of peninsular Florida, and are consolidated into a small number of colonies each year. So, why shouldn’t that be true in the West? In Mexico, the colonies occur on massifs at 10,500’ or higher where the temperatures for most of the winter range from the 30s at night to the 60s during the day with the temperature rarely reaching the low 70s at the sites themselves. In effect, these are low temperature islands that are surrounded by areas with much higher temperatures at the lower elevations. Thus, in the winter months, to stay non-reproductive, the monarchs need to remain on these islands. Freezing conditions are more likely to be a threat to monarchs in Mexico than high temperatures. That said, warmer winters are expected in Mexico in the future.

Monarch behavior during the winter months along the California Coast is different. Rather than staying in one place, monarchs are on the move when temperatures allow movement. Initially, monarchs reaching the coastal areas settle in small to modest numbers in a large number of scattered sites as well as the well-known wintering sites. Most of these temporary sites are abandoned with the occupants moving to more permanent sites as the temperatures continue to cool in late October and November. The presumption here is that monarchs leaving temporary sites seek clustering locations that are both cooler and better protected from variable weather conditions. These movements generally end by late November. The clusters/colonies are thought to be at their seasonal maximum at that time hence the timing of the Thanksgiving counts. However, the numbers generally begin to dwindle following (but perhaps even before) the Thanksgiving counts such that counts in the following January indicate numbers that are lower by roughly 35 to 45 %. Further, a large proportion of the sites that had monarchs during the first count no longer have monarchs during the second count. In addition, there are locations where the numbers increase from Thanksgiving to January and sites where the declines over that 5-6week interval are quite low. The reasons for the declines are not clear. Mortality could be one factor, and it could be that monarchs are still moving in an attempt to stay in reproductive diapause by seeking cooler and more protected sites. The assumption by Schultz et al., that counts are a useful index of abundance is difficult to justify. Due to the continuous movement of monarchs in the early fall and whenever the temperatures allow through the winter season, the numbers appear to be a moving target. While there is no doubt these counts are of value, the fact that a hundred and fifty more sites are counted now than as recently as 2011 makes it difficult to assess current and historical trends and to associate those numbers with changing physical and biological conditions.

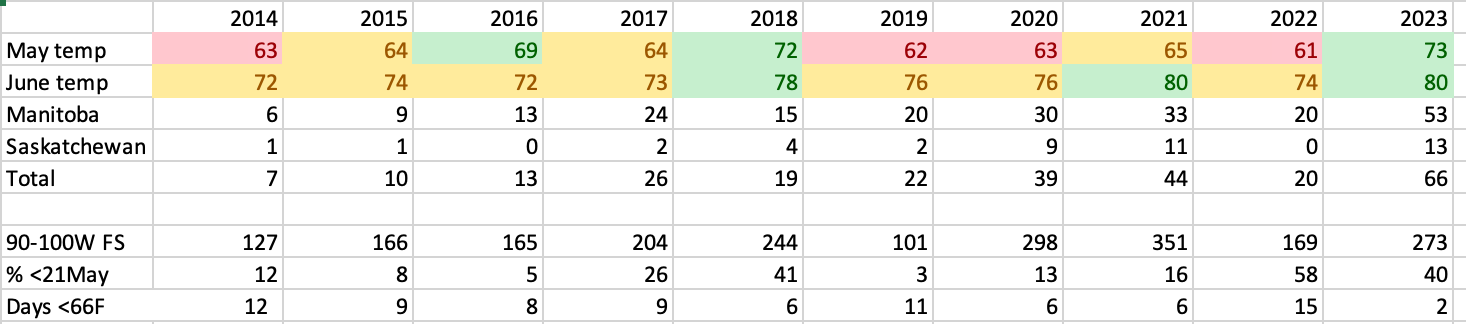
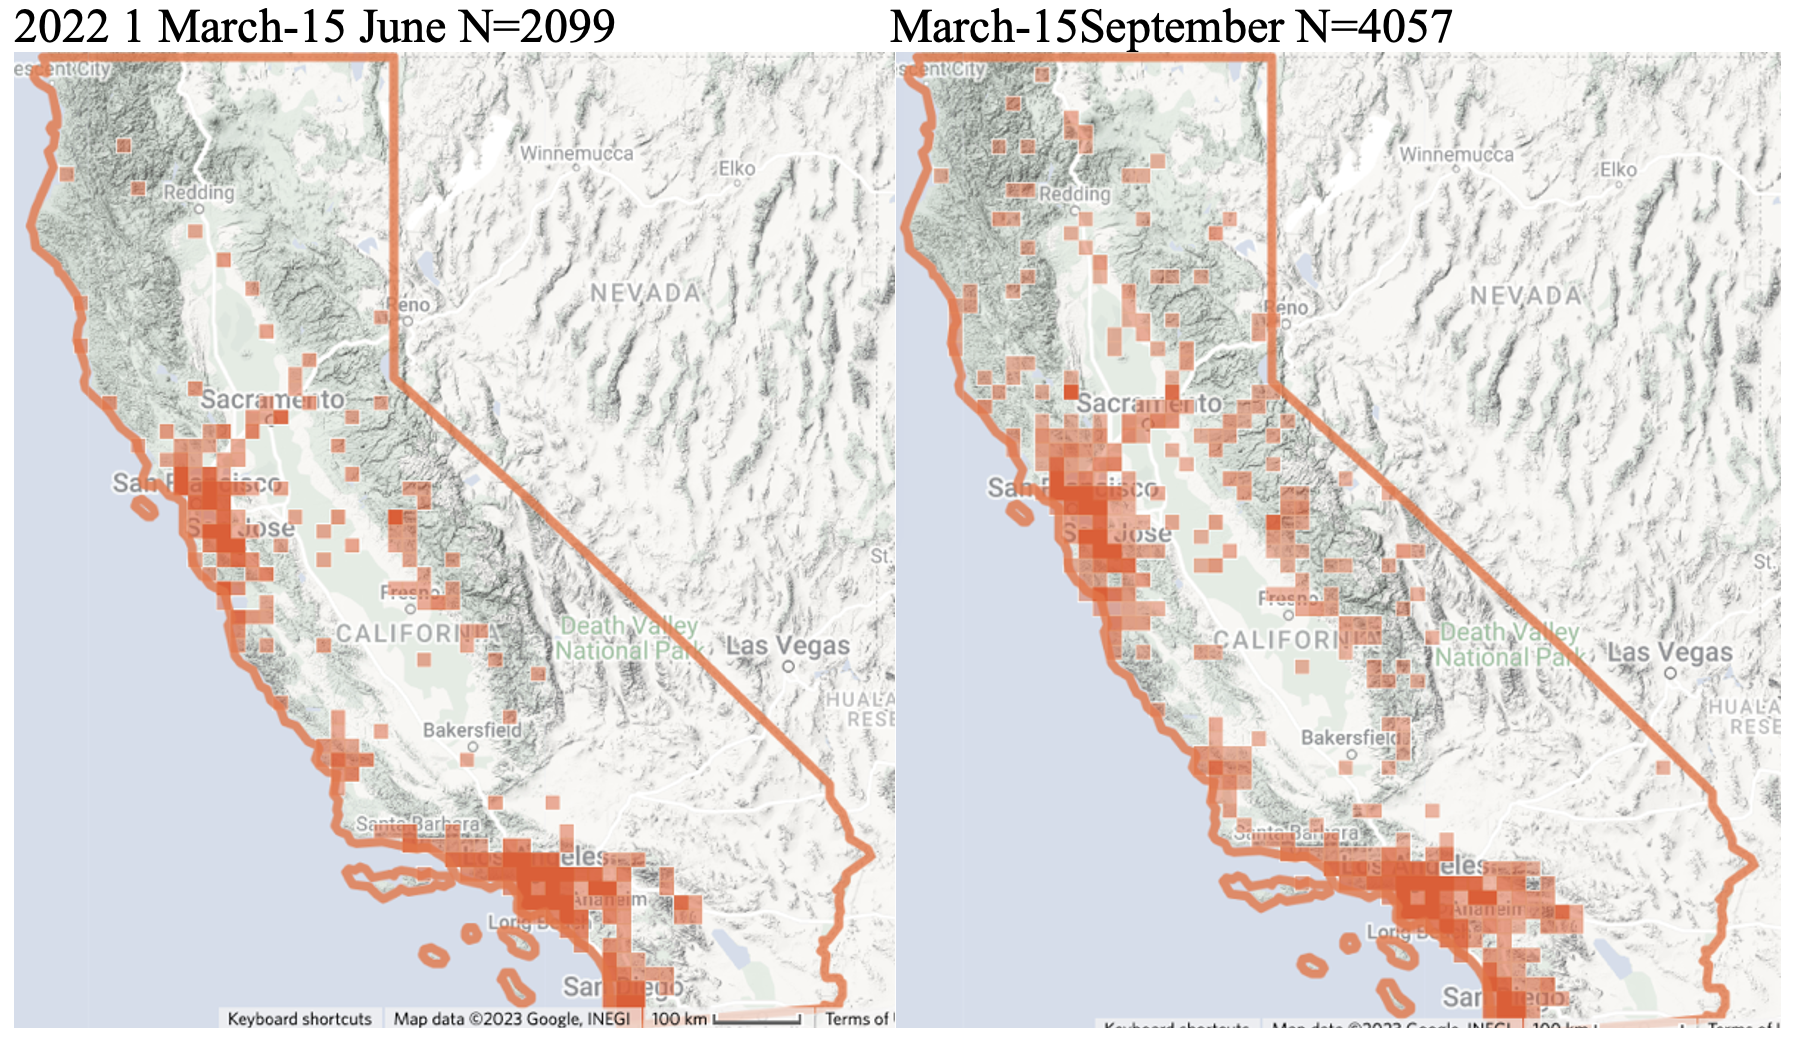
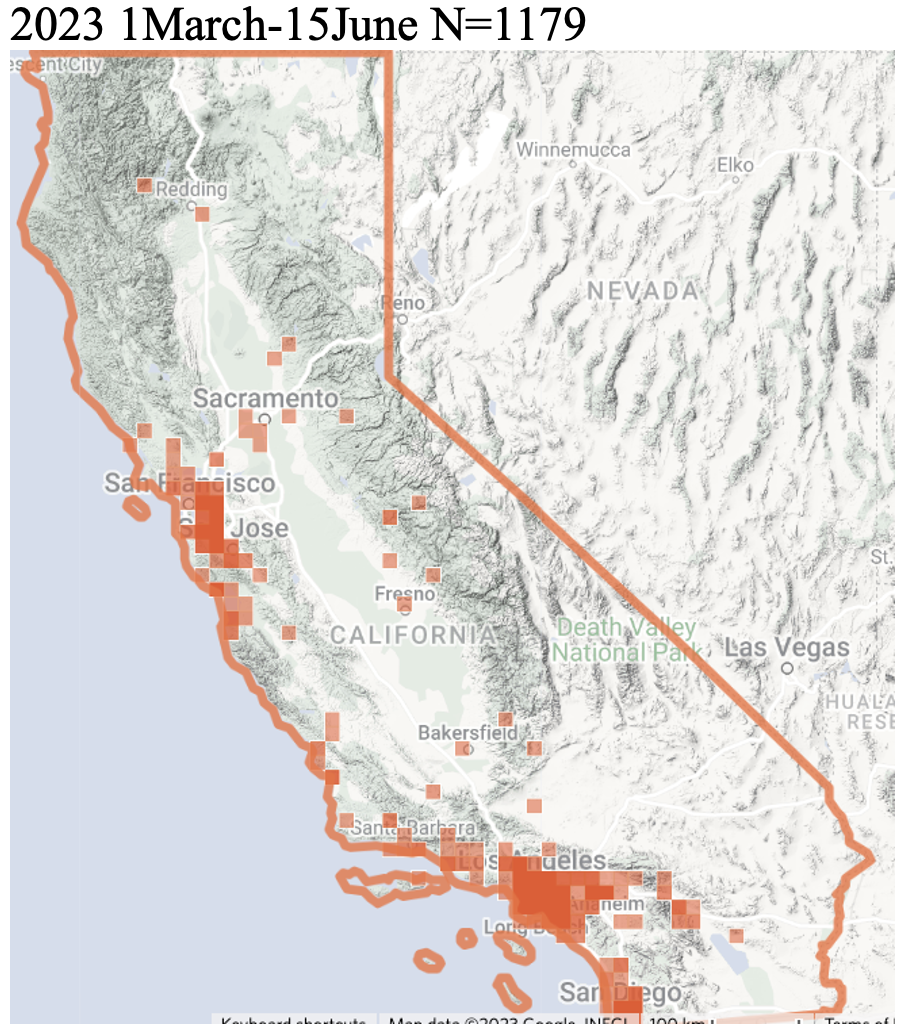
While temperatures along the coast have historically been cooler than the interior as the monarchs arrive in mid-October, as the season progresses, and the interior cools, it can actually become cooler in many locations away from the coasts (Table 1). That the temperatures along the coast have been increasing during the winter months and that monarchs have been leaving the coastal sites earlier over the last 20 years or more seems clear (Addendum, Figure 1). Monarchs which used to stay clustered at some sites until early March are now leaving sites in large numbers in late January and early February according to many accounts although actual data on this point are scarce. Unfortunately, we don’t know the fate of monarchs that leave overwintering sites. There seem to be three options – they die, they become reproductive, mate and search for milkweeds that are scarce to non-existent at that time, or they move inland to sites which are cooler and more suitable for maintaining a non-reproductive condition. It’s probable that all three happened with the latter being the most frequent outcome for monarchs seeking cooler temperatures. I’m assuming that some of these monarchs survive from January through mid-March singly or in small scattered clusters well inland from the coast, perhaps at 1500-3000ft.

Table 1. Mean temperatures for months indicated for Tempest weather stations close to overwintering sites, nearest airports and counties for 2021 and county temperatures for 2020. The latter show the extreme temperatures for September and October in 2020. Temperatures are generally lower near overwintering sites for September and October but are warmer than county means during November and December (except for November Santa Barbara). Overwintering site temperatures are closest to airport temperatures in December. Counties generally represent large areas inland from the coast with lower temperatures than coastal areas from late fall through February.

western_table1

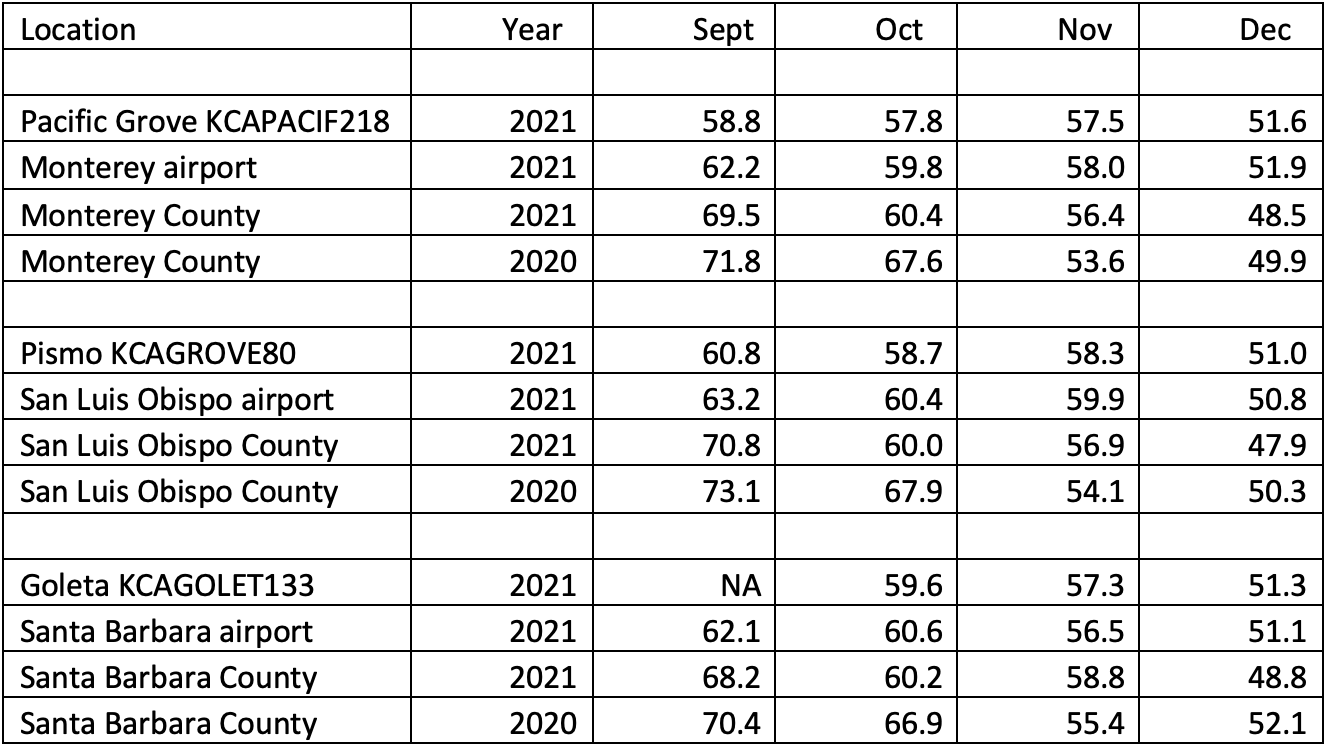
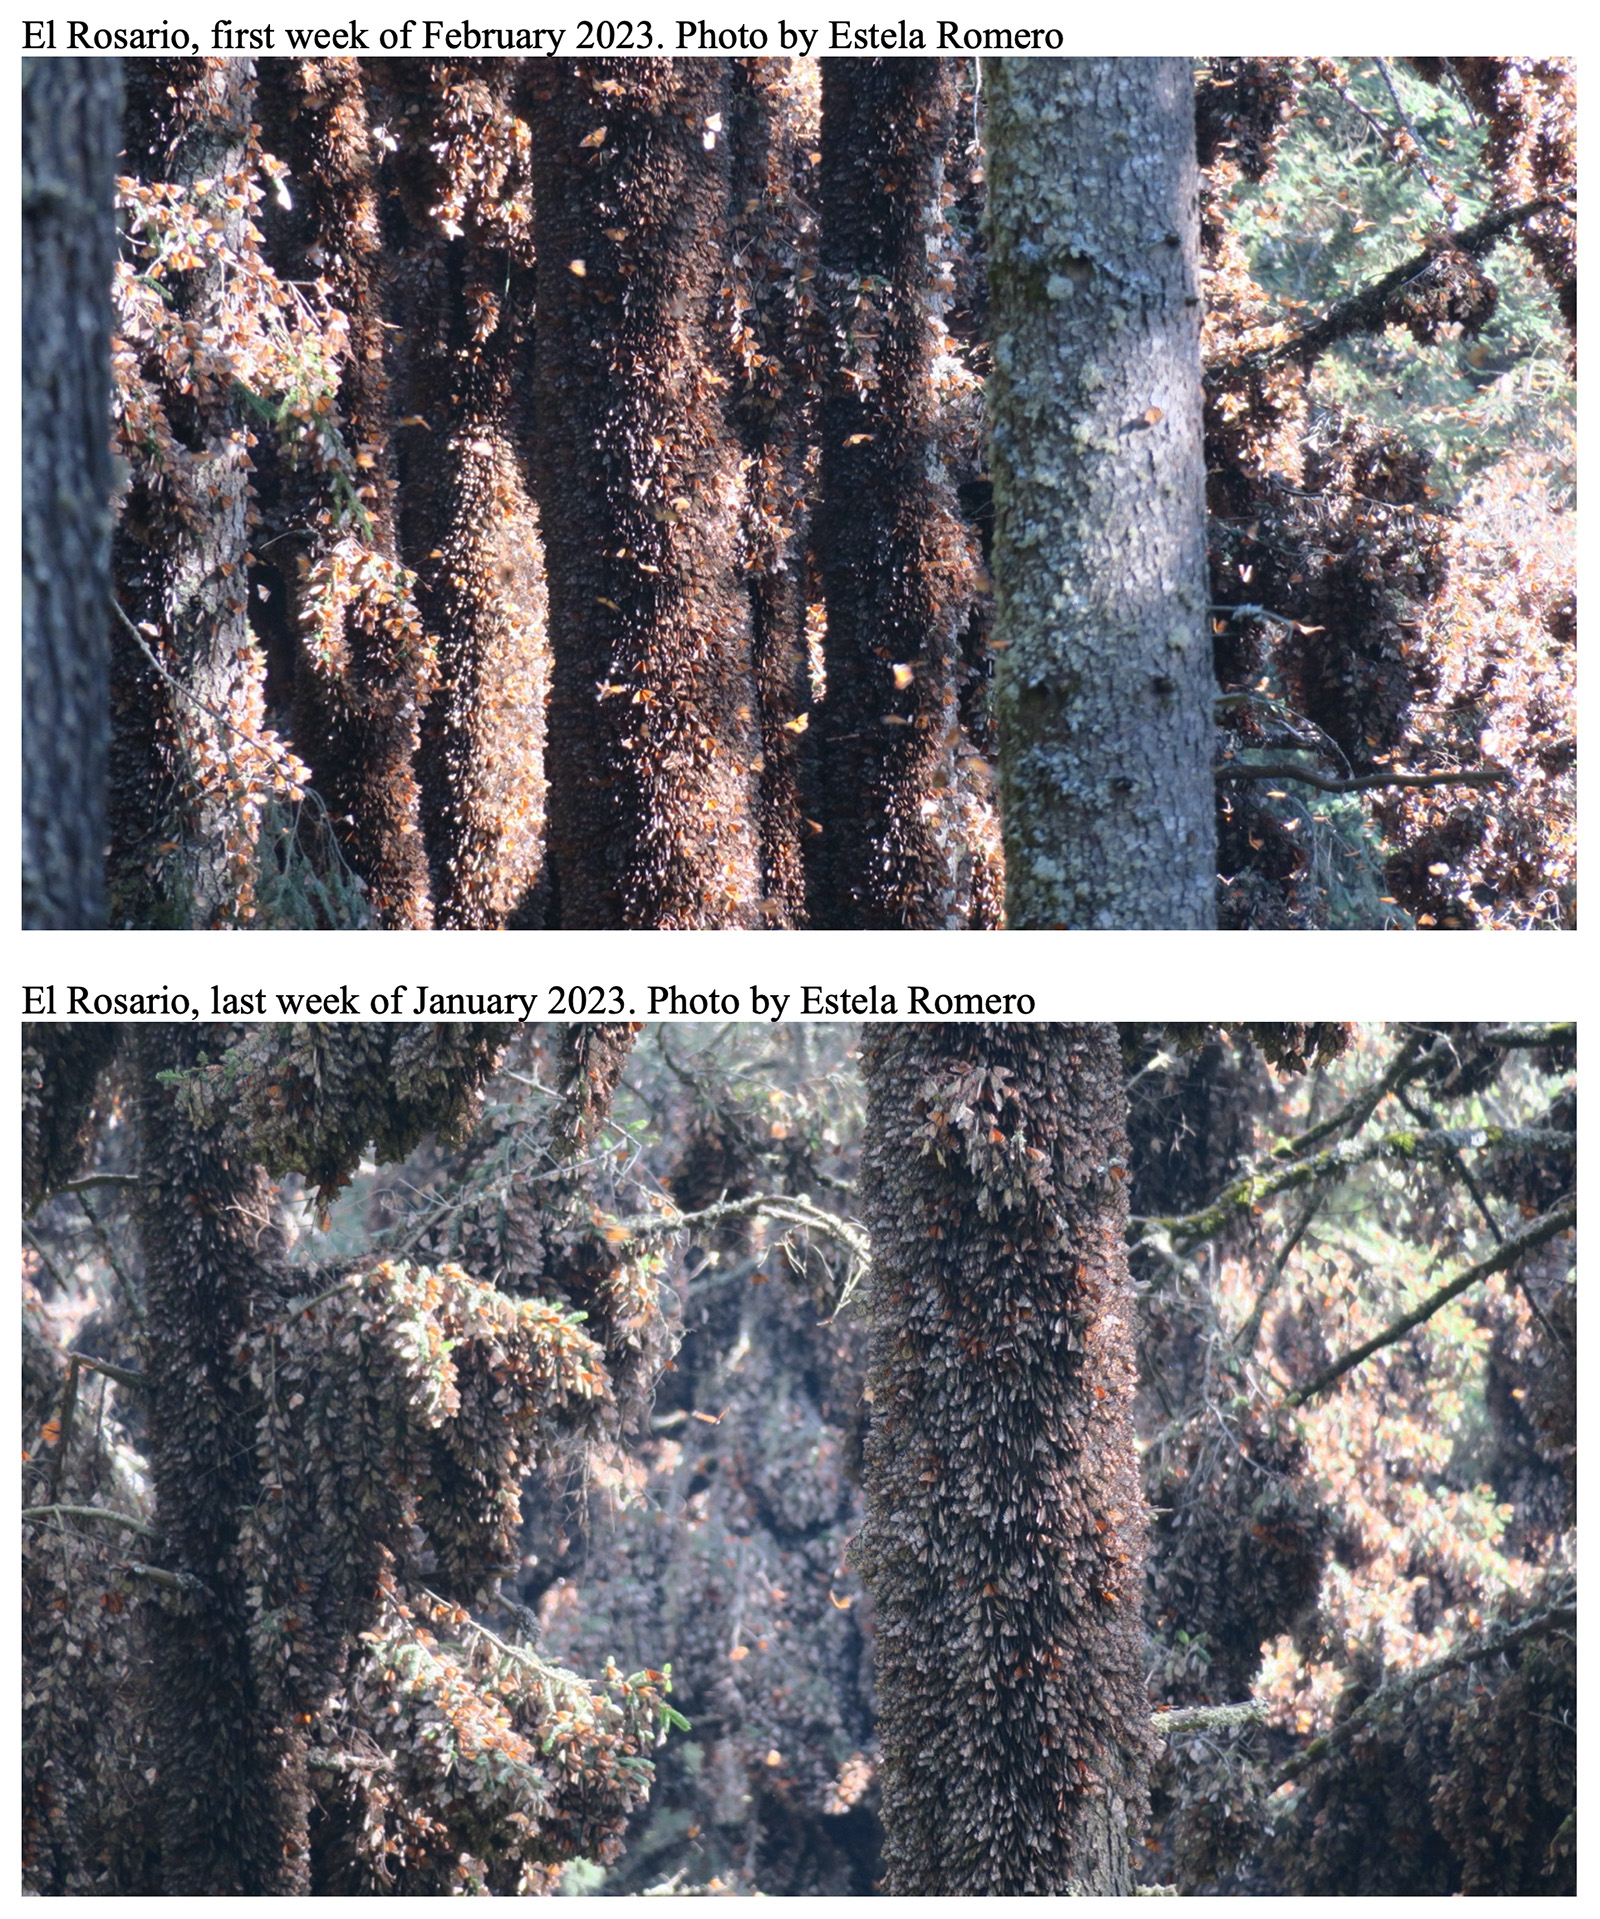
Monarchs seek moderate temperatures. They need to stay non-reproductive for months. So, what happens if the coastal areas are too warm in mid-October? What if there are no temperature gradients, they are too weak or it is uniformly hot? It’s clear that there is an optimal temperature range for staying non-reproductive, and though we don’t know exactly what those limits are, monarch behavior appears to be telling us that they are seeking temperatures below 70F when migrating and need temperatures in the high 50s to 70s to reach and settle in to the overwintering sites to stay in those sites through the winter requires temperatures in the 40s to low 50s. There is a well understood relationship between temperature and the density of clusters that form during migrations and colony establishment. This relationship is key to what happens in California, and particularly what happened in 2020. First, two observations from Kansas are relevant. If the temperatures are in the 90s during the migration in eastern Kansas, most of the monarchs stop migrating and seek the shade and higher humidity found in the gallery forests along the rivers, streams and drainage areas. Once in these shaded and more humid sites, the monarchs roost in the trees often singly, but frequently in small and open, even scattered, clusters of 6 or so. Monarchs will stay in these locations for days if the temperatures remain in the 90s. The second observation involves clustering at the end of the day. When temperatures are in the low 80s, monarchs form clusters scattered loosely in trees from ground level to much higher. If the temperatures are in the 60s, with overnight lows in the 30s expected, the clusters are higher and denser in the trees with few or none of the monarchs settling near ground level. Similarly, in Mexico, the first clusters are loose and scattered and slowly consolidate as the temperatures become cooler. In effect, the colonies become smaller and smaller as the winter progresses usually reaching the maximum density and smallest area occupied by mid-December. That’s when the colonies are measured by WWFMX in collaboration with CONANP, UNAM and the MBBR. These observations indicate that cluster formation and density is a function of behavioral responses to temperature with loose or no clusters forming when it is hot to tight, cohesive clusters forming when temperatures are at the lowest that allow for flight.

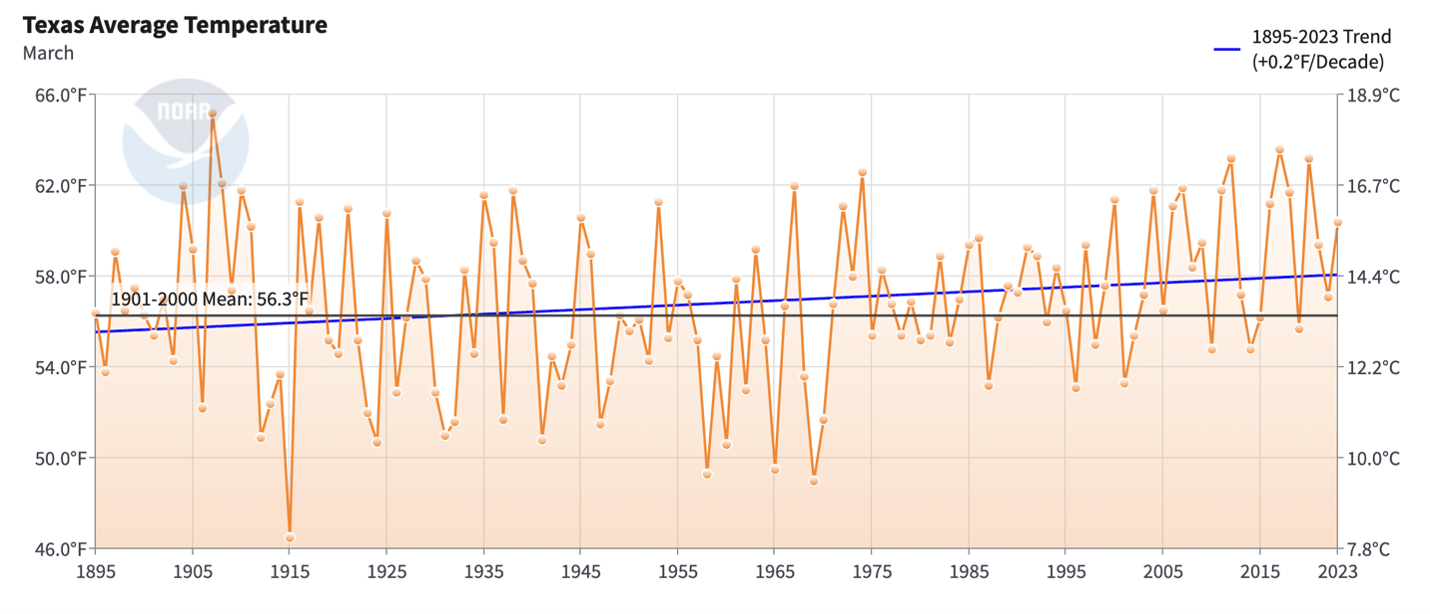
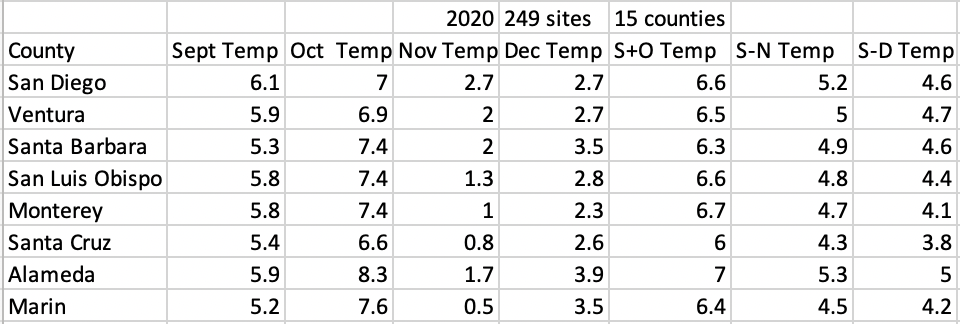
These behaviors bring me to what happened in 2020 along the California coast. The temperature records for all the counties along the coast go back to 1895. That’s 127 years, and those years are ranked from coolest to hottest. I first looked at the mean temperatures for October for counties from San Diego to Marin. All averaged over 7F above the long-term means (7.0-7.6) and all but one (SB ranked 126) were ranked as the hottest in the record to date. The rankings were similar, but the deviations were lower when using 30yr means (5F-6.1F). I then looked at the mean temperature for September, a period during which the monarchs are moving toward the coasts. The results were the same, and when I combined September and October and then, September, October and November and finally added in December, each showed that those means ranked 125-127 (Tables 2a, 2b).

Table 2a. Temperature rankings for September through December separately and combined for 2020. There are 127 years in the record ranked from coldest to hottest with 127s being the hottest mean monthly temperatures in the record.

western_table2a

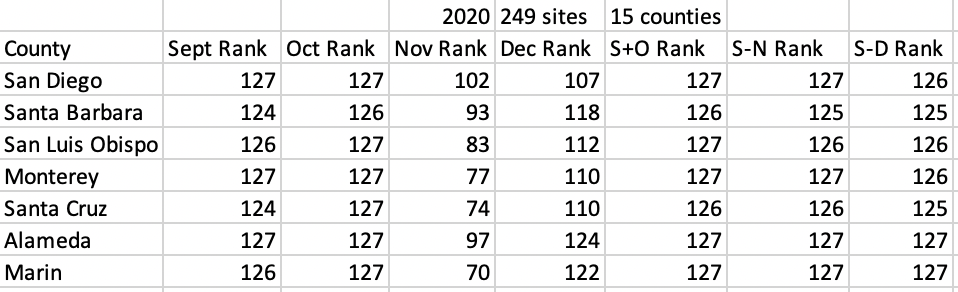
Table 2b. Deviations from long-term mean temperatures for the intervals indicated.

western_table2b

Given these extremes and the known effects high temperatures have on the initiation and progress of migrations, as well as the physiological and behavioral responses of monarchs to these conditions, what happened in 2020 that rolled over to the influx of monarchs in 2021? Here is the scenario that seems likely. The migration in 2020 started late and moved slowly due to the temperatures in the 90s along inland pathways leading to the coastal locations. For example, the mean maximum temperatures were the third highest in the 126year record for Fresno and the highest in the 75year record for Sacramento. Some monarchs became reproductive on the way to the coast, these monarchs dropped out of the migration altogether (James 2021, James et al. 2021). Other monarchs seeking cool temperatures stayed individually or in small clusters in the foothills and drainages inland from the coast and due to the continuing high temperatures stayed in these areas rather than moving to the coast. Some of the monarchs reaching the coast became reproductive and continued to reproduce through the winter where milkweeds were available. Others, a mere 1849, clustered at an all-time low number of sites along the coast. Santa Cruz, the county with the largest proportion (38.55%) of all the wintering monarchs in 2020, also had a high retention rate (91.2%) for the sites that were counted during the Thanksgiving and January surveys. The mean temperatures at Santa Cruz were the lowest among all counties in October, November, October-November and for September through December (Table 2). This result is consistent with the interpretation that monarchs seek the coolest locations or some combination of temperatures, protection from direct sun and strong winds.

The resurgence in the numbers at the overwintering sites in 2021 suggests that spring reproduction was extremely successful, so successful, that it seems likely that the resurgence was founded by a large number of mated females that began laying eggs in late February, a process that continued into April. Given the behavior I described with respect to clustering and the need for monarchs to seek out temperatures that enable them to stay non-reproductive, it seems likely that many of the overwintered females that began the breeding in 2021 overwintered singly or in small clusters at sites interior of the usual overwintering sites. Monarchs originating from winter breeding populations in urban areas may have also moved inland in the spring adding to the reproduction that produced a new generation from late April through May (James 2021, James et al. 2021).

Monarch demography

Part of the challenge in explaining what happened during the 2021 breeding season is not only figuring out the origins of females that started the first generation, but estimating how many survived to reproduce. That reproduction had to result in a large first generation that subsequently colonized the summer breeding areas, mostly east of California, followed by additional reproductive success that yielded an initial migratory population of at least 300,000 monarchs.

For the purpose of illustrating the potential reproduction of a cohort of females, I’ve assumed constant rates of mortality from one generation to the next. However, the incidence of parasitism by tachinid flies and infection by the protozoan Ophryocystis elektroscirrha (O.e.) tends to increase as the season progresses. Such increases would reduce both the proportion of larvae reaching the pupal stage and those surviving to the adult stage. In the case of the surviving adults with O. e., their fitness to reproduce would be compromised. We also need to recognize that realized fecundity, i.e., the mean eggs per female per generation, varies with temperature, nectar availability, and the distribution, abundance and quality of milkweeds. These factors also affect population growth. In other words, the calculations below represent a best-case scenario that is most often approached early in the season.

Calculations

The calculations that follow are based on estimates taken from the literature (Grant et al., 2020, Nail, et al., 2015, De Anda and Oberhauser, 2015, Oberhauser, et al., 2017). I used constant rates of egg laying and mortality for a cohort of 10,000 females for three generations. The results look promising but are not realistic.

10,000 females x 250 eggs = 2,500,000 eggs x 0.03 proportion surviving to pupal stage =75,000 x 0.76 = 57,000 new adults x 0.85 proportion that reproduces = 48,450 x 0.45 proportion of females = 21,803. These calculations therefore yield a 2.18 rate of increase in females per generation. If we multiply 21,803 x 2.18 for three generations, we get 225,884 females or a total potential migratory population of about 510,000. That’s more than enough monarchs to yield an overwintering count of 246K. However, it is unlikely that these rates of increase would be the same from one generation to another. They could be lower due to an increase in O.e. and tachinid parasitism or the losses due to other predators, all of which tend to increase as the season progresses. That could decrease the proportion surviving the pupal stage and the number of new adults substantially. As an alternative, we might imagine conditions that would allow females to lay more than 250 eggs followed by higher survival through the larvae stages that would lead to an increase in the population. The later scenario seems less realistic to me. It should be noted that the proportion of eggs (0.03) surviving to the pupal stage used in these calculations is probably too high by a factor of 2. If true, and all other estimates were the same as above, it would take about 20,000 females to produce a migratory population of 246K wintering monarchs. That number would have to be even greater if the incidence of O.e. and tachinid parasitism increased thus reducing the size of the reproductive population. The point of making these calculations is to show that to produce an overwintering population of 246K required an initial female population numbering in the 10s of thousands, probably 30,000 or more. While a portion of these females may have originated from scattered areas of winter reproduction, the majority were probably overwintered monarchs that survived in small, highly dispersed clusters in the coastal foothills (Fisher et al., 2018) that went undetected during the surveys for overwintering monarchs.

If these interpretations are correct, it is likely that the Thanksgiving counts may underestimate the size of the overwintering population during years when the October – November temperatures are substantially above the long-term average. The increases in temperature along the coast during both the fall and winter suggest that southern counties in California are likely to see fewer and fewer monarchs in the coming decade. In addition, the tendency of monarchs to seek cooler locations will lead to an increasing dependency on the more northerly overwintering sites. However, if the rapid increases in temperatures during October and November along the California coast (Table 2) continue at a rate similar to that of the last decade, monarch overwintering along the coast (Table 3) is likely to decline. Should this be the case, it will become increasingly important to maintain and improve on the structural features of the overwintering sites that offer the best protection throughout the winter.

Table 3. Increases in mean temperatures for October-November for the intervals indicated. Note the exceptional rate of change in the last decade for all coastal counties.

western_table3

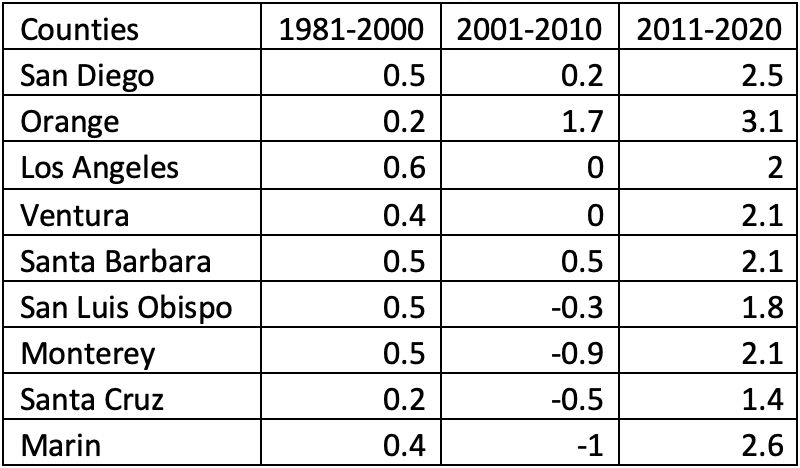
Table 4. Mean December through February temperatures for coastal counties in California.

western_table4

The first column represents the long-term mean followed by means for the last four decades.

The long-term change, the increase from the previous decade and the projected increase are shown in the following columns. Most of the increase in mean temperatures occurred in the last decade. Monarch numbers at overwintering sites trend lower as mean December-February temperatures increase beyond 51.0F in San Diego, Orange and Los Angeles counties (Addendum Figure 1). The estimations for the next decade were based on the increases during the previous decade. Given the recent trends, the means for the next decade could be higher than shown.

Analysis

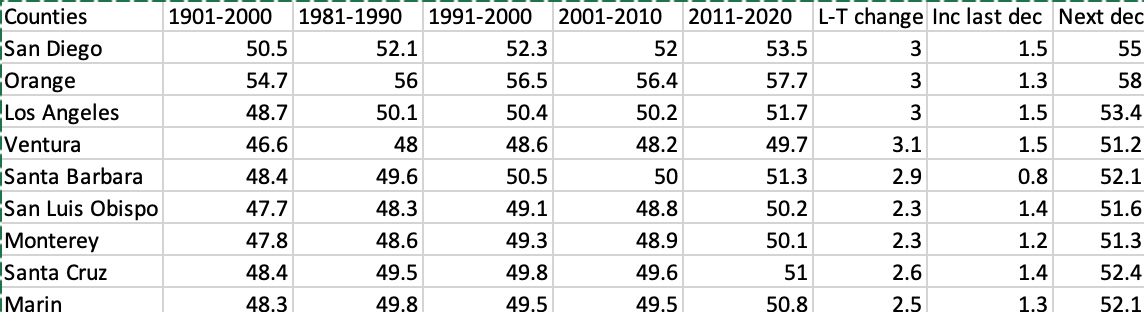
The analysis I’ve used to support the interpretations outlined in the text is based on monthly means for counties. While the counties are all coastal, their areas vary with some extending significantly inland, with the result that there is some loss of equivalency. Further, the means can only be seen as proxies for the conditions at the colony sites and should not be taken as exact representations of the temperatures which are likely to be lower at specific overwintering sites (Table 1). Means can also conceal events such as short intervals with weather extremes that can have a significant impact on the monarch population. For example, after an exposure to a 3-4day interval with temperatures in the mid 70s or higher, many overwintering monarchs are likely to break diapause. The same is likely to occur during the migration. Mean temperatures also don’t capture mortality due to other weather events such as high winds or extreme rainfall. All the same, there are patterns associated with increasing temperatures that appear to explain much of what has been happening at overwintering sites along the coast from 1997 (when the counts began) to the present. Mean temperatures have risen from 1.8F to 1.0F per decade from San Diego to San Francisco. The range of mean maximum temperatures is even greater being from 2.7F to 1.3F per decade. While these changing conditions affect the overwintering monarchs, and likely their movement and survival, a deeper dive into the weather data is needed to understand what determines the number of monarchs that arrive at the overwintering sites each winter.
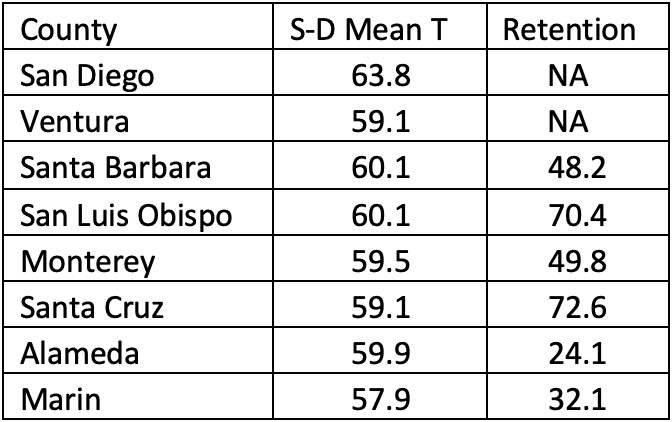
Retention

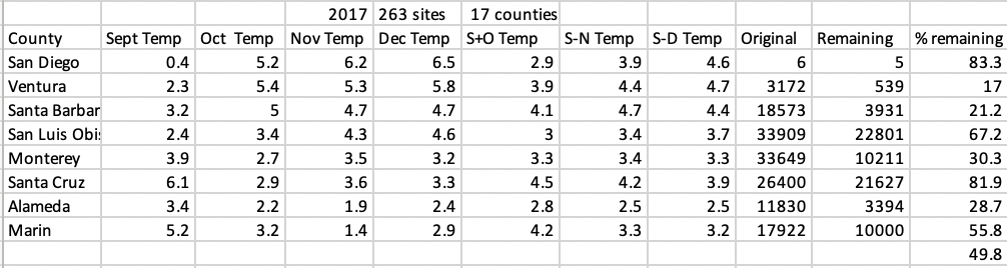
In addition to the Thanksgiving Counts, counts are made for most counties again in January. Retention refers to percentage of monarchs remaining in each county once the January counts are completed. These data are summarized by county, for the 5 years (2017-2021) during which both Thanksgiving and January counts are available in Table 4. The numbers of monarchs in both San Diego and Ventura counties were too low for meaningful estimates of retention. Two factors, temperature and site quality, probably account for much of the retention. But high winds and other weather events could account for some of the decline. The overall retention doesn’t appear to be associated with differences in temperature among years for colonies collectively, e.g., warmest year (2020) and the coolest year (2021) have similar rates of retention (63.8 vs 62.8). However, within years in the 4 core colonies (SB, SLO, MT, SC), the highest retentions are often associated with the counties with the lowest temperatures, such as Santa Cruz in 2020, Table 6. The retention rates for both Alameda and Marin counties are both low, but there are no indications those rates are associated with temperatures.

Table 5. Mean temperatures for September – December and percentages of monarchs remaining at all overwintering sites in each county at the time of the January counts for the years 2017-2021.

western_table5

The temperature records for 8 counties are summarized for the years 2017-2021 in Tables 6-10. The data represents deviations from the long-term means for each county. September represents the interval during which most of the long-distance migration occurs. October and November temperatures correspond to the period of arriving at and settling in at overwintering sites. December represents a period of decline in number of occupied sites and numbers per site. These tables also include the original and January counts.

Extremely high temperatures in September, as in 2020, Tables 1 and 6, probably reduced the numbers of monarchs reaching coastal sites by causing some to break diapause and drop out of the migration. Attrition due to the lack of nectar resources under these conditions could also be a factor. Unfortunately, there are no means to assess the impact of September temperatures on the number of migrants reaching the coast. October and November temperatures are key. They can be too extreme as in 2020 or favorable by being close to the long term means as in 2021, Tables 6 and 5. December temperatures were included to determine if they influenced the declines within and among years. While there is no clear association of these temperatures with the declines, more analysis might be helpful.

Table 6. Deviations from the long-term mean temperatures for 10 counties surveyed for monarchs in 2021. Original refers to the number of monarchs in the Thanksgiving count and remaining refers to the numbers counted at the same sites in the following January.

western_table6

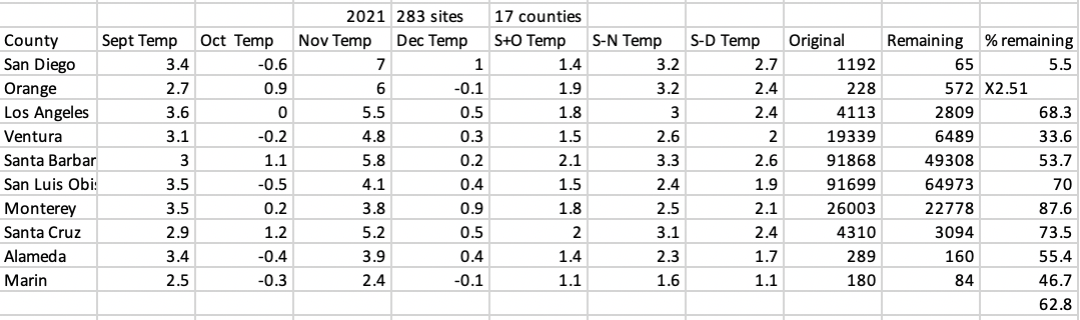
Table 7. Deviations from the long-term mean temperatures for 8 counties surveyed for monarchs in 2020. Original refers to the number of monarchs in the Thanksgiving count and remaining refers to the numbers counted at the same sites in the following January.

western_table7

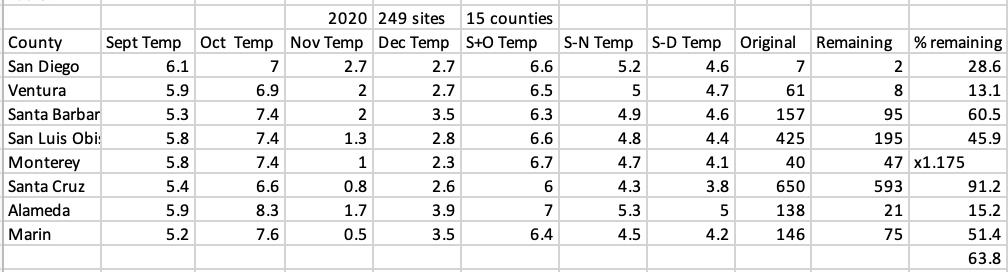
Table 8. Deviations from the long-term mean temperatures for 8 counties surveyed for monarchs in 2019. Original refers to the number of monarchs in the Thanksgiving count and remaining refers to the numbers counted at the same sites in the following January.

western_table8

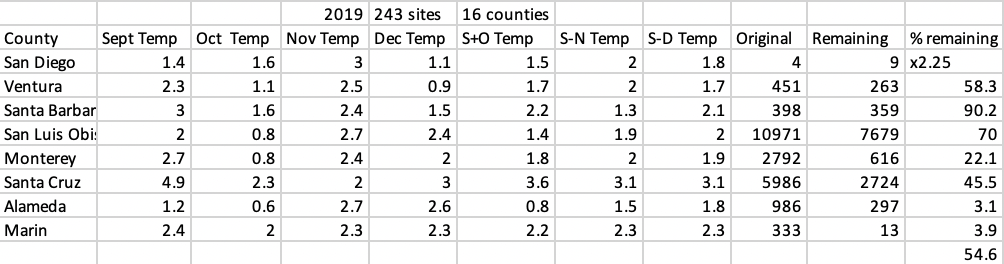
Table 9. Deviations from the long-term mean temperatures for 8 counties surveyed for monarchs in 2018. Original refers to the number of monarchs in the Thanksgiving count and remaining refers to the numbers counted at the same sites in the following January.

western_table9

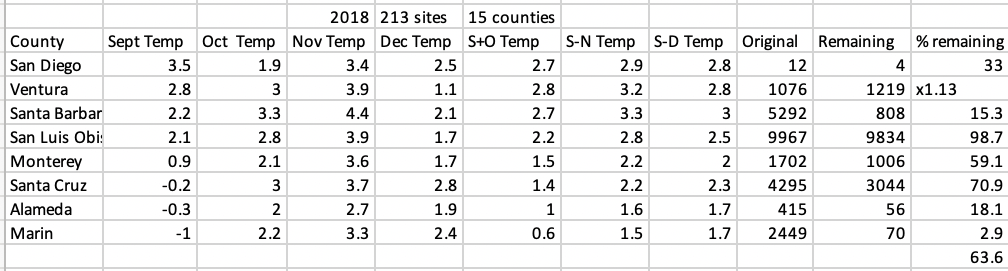
Table 10. Deviations from the long-term mean temperatures for 8 counties surveyed for monarchs in 2017. Original refers to the number of monarchs in the Thanksgiving count and remaining refers to the numbers counted at the same sites in the following January.

western_table10

Summary

Monarchs are an enzyme. That’s the title I used for three posts to the Monarch Watch Blog to introduce the concept that monarchs operate most effectively at a limited range of temperatures for each activity. We can imagine an enzyme activation curve for each behavior. These optimal ranges have not been defined analytically or experimentally, but we know enough to approximate their limits. For example, temperatures ranging from 65-75F favor migration. Migratory flight appears to diminish either side of this range. Overwintering monarchs appear to do best when temperatures range from 30-60F with monthly means in the high 40s. Both of these conditions apply to the fall and overwintering conditions along the California coast where it is getting too warm both during the fall migration (September flights and October-November clustering at overwintering sites) and the wintering interval from December-February. These changing conditions have resulted in a decline in the numbers of monarchs overwintering in Southern California counties. The tendency for diapausing monarchs to seek temperatures within the range that maintains a non-reproductive condition leads to the progressive abandonment of warmer and less protected sites during the period of cluster formation and throughout the winter months. The result is both consolidation at some overwintering sites and the movement away from many sites as early as December. In the case of 2020, when few clusters formed, it is likely that the fall population overwintered inland in small scattered clusters as suggested by the niche model of Fisher, et al., 2018. Breeding populations that carried over from summer breeding in urban areas may have been augmented by fall monarchs that became reproductive. Offspring from these populations may have moved inland (James et al. 2021) along with overwintered monarchs to produce a large first generation. The numbers of females (10s of thousands) appeared to have been sufficient to produce a first generation that colonized summer breeding areas, mostly in the inner mountain west from May to mid-June in 2021. The multi-generation reproduction that followed produced a migratory population of 300,000, or more, monarchs that populated the overwintering sites under the near average temperatures that occurred from September through November 2021. The rates at which temperatures are increasing during the fall and winter along the California coast suggest that overwintering numbers are likely to decline in the coming decade. While the climate projections in Fisher, et al., 2018, were well into the future, the predicted outcomes seem to be partially represented by the distribution and abundance of wintering monarchs in 2020.

Acknowledgments

Exchanges with Paul Cherubini about Western monarchs on the WesternMonarchs@groups.io discussion list reminded me of the basics of how monarchs respond to temperatures during the migration and when clustering at overwintering sites. Jay Diffendorfer, Peter Ipsen, David James and Patrick Guerra offered their perspective on a number of points and Janis Lentz read the text and kindly pointed out missing commas, run on sentences and some non-sentences. Any errors or misinterpretations are mine.

References

De Anda, A., and K. S. Oberhauser. 2015. Invertebrate natural enemies and stage-specific mortality rates of monarch eggs and larvae. Pages 60– 70 in K. S. Oberhauser, K. R. Nail, and S. Altizer, editors. Monarchs in a changing world: Biology and conservation of an iconic butterfly. Cornell University Press, Ithaca, New York, USA.

Fisher, A.; Saniee, K.; Van der Heide, C.; Griffiths, J.; Meade, D.; Villablanca, F. Climatic Niche Model for Overwintering Monarch Butterflies in a Topographically Complex Region of California. Insects 2018, 9, 167. doi.org/10.3390/insects9040167

Grant, T. J., D. T. T. Flockhart, T. R. Blader, R. L. Hellmich, G. M. Pitman, S. Tyner, D. R. Norris, and S. P. Bradbury. 2020. Estimating arthropod survival probability from field counts: a case study with monarch butterflies. Ecosphere 11(4):e03082. https://doi.org/10.1002/ecs2.3082

James, D. G.; Schaefer, M.C.; Krimmer Easton, K.; Carl, A. First Population Study on Winter Breeding Monarch Butterflies, Danaus plexippus (Lepidoptera: Nymphalidae) in the Urban South Bay of San Francisco, California. Insects 2021, 12, 946. doi.org/10.3390/insects12100946

James, D.G.; Schaefer, M.C.; Krimmer Easton, K.; Carl, A. Reply to Davis, A.K. Monarchs Reared in Winter in California Are Not Large Enough to Be Migrants. Comment on “James et al. First Population Study on Winter Breeding Monarch Butterflies, Danaus plexippus (Lepidoptera: Nymphalidae) in the Urban South Bay of San Francisco, California. Insects 2021, 12, 946”. Insects2022,13,64. doi.org/10.3390/insects13010064

Nail, K. R., C. Stenoien, and K. S. Oberhauser. 2015. Immature monarch survival: effects of site characteristics, density, and time. Annals of the Entomological Society of America 108: 680– 690.

Oberhauser, K., R. Wiederholt, J. E. Diffendorfer, D. Semmens, L. Ries, W. E. Thogmartin, L. Lopez-Hoffman, and B. Semmens. 2017. A trans-national monarch butterfly population model and implications for regional conservation priorities. Ecological Entomology 42: 51– 60.

Pelton EM, Schultz CB, Jepsen SJ, Black SH and Crone EE (2019) Western Monarch Population Plummets: Status, Probable Causes, and Recommended Conservation Actions. Front. Ecol. Evol. 7:258. doi: doi.org/10.3389/fevo.2019.00258

Semmens, B. X., D. J. Semmens, W. E. Thogmartin, R. Wiederholt, L. López-Hoffman, J. E. Diffendorfer, J. M. Pleasants, K. S. Oberhauser, and O. R. Taylor. 2016. Quasi-extinction risk and population targets for the Eastern, migratory population of monarch butterflies (Danaus plexippus). Scientific Reports 6: 23265.

Schultz, C.B.; Brown, L.M.; Pelton, E.; Crone, E.E. Citizen science monitoring demonstrates dramatic declines of monarch butterflies in western North America. Biol. Conserv. 2017, 214, 343–346.

Taylor, O. R., Lovett, J. P., Gibo, D. L., Weiser, E. L., Thogmartin, W. E., Semmens, D. J., et al. (2019). Is the timing, pace and success of the monarch migration associated with sun angle? Front. Ecol. Evol. 7:442. doi: doi.org/10.3389/fevo.2019.00442

Data Citations

NOAA National Centers for Environmental information, Climate at a Glance: National Time Series, published June 2022, retrieved during June 2022 from ncdc.noaa.gov/cag/

Xerces Society Western Monarch Thanksgiving Count. 2022. Western Monarch Thanksgiving Count Data, 1997-2021. Available at westernmonarchcount.org

Addendum

Figure 1 below and supporting commentary can be found at:
monarchwatch.org/blog/2020/02/25/monarchs-and-climate-in-the-west

western_figure1

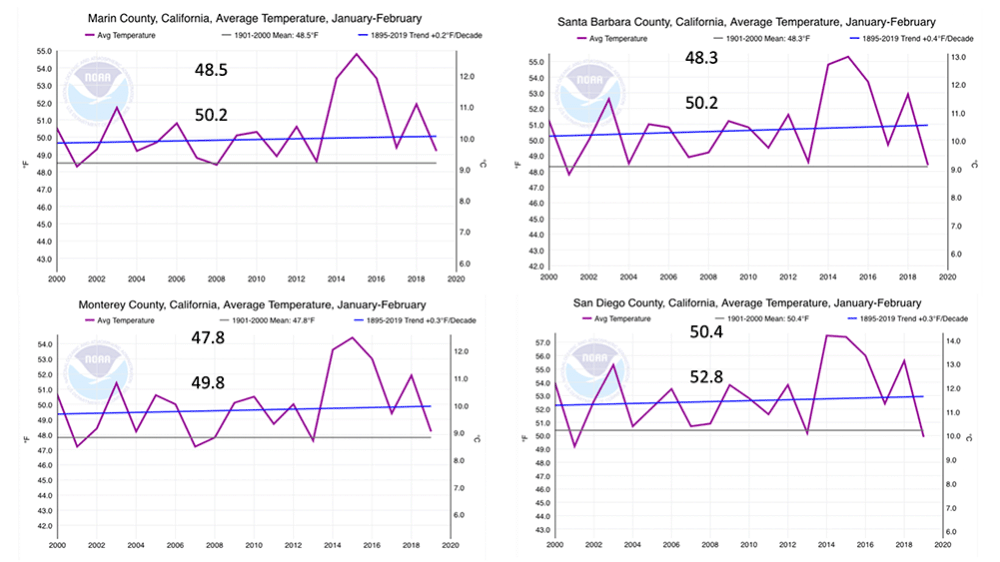
Figure 1. Both the long-term mean (upper) and the mean for the last 20 years (lower) for January–February for 4 counties from Marin in the north to San Diego in the south are displayed above. The differences between the long-and-short term temperatures range from +1.7F for Marin County to +2.4F degrees (.85–1.2F degrees/decade) for San Diego County. Along with these increases in temperature, the number of sites and individuals per site has been decreasing in the southernmost counties and while increasing in Marin County. Over the 20-year interval in San Diego, the number of sites declined from 18 to 3 while the count declined from 2,590 to 12. Overall, the data suggest that the numbers of sites and monarchs both decline as temperatures increase. Further, the data suggest monarchs are seeking cooler temperatures by moving northward along the coast. The alternative possibility is that they could be moving to cooler inland sites – if such exist.

Note 1. Although the number of females that survived the winter of 2020-2021 to reproduce is unknown, it’s possible that the number was as high as 30,000. If so, then, how many monarchs started the overwintering cycle in the fall of 2020? Generally, since females are usually about 45% of the population, the total surviving would have been approximately 66,500. If this number represented only 50% of initial population due to mortality, the starting number would have been roughly 133,000. While these numbers are speculative, they provide a glimpse of the possible magnitude of the population that overwintered in 2020-2021. It appears to have been much larger number than the1849 represented by the Thanksgiving counts.

Note 2. In theory, monarchs could return from Mexico to repopulate the West and perhaps a few do so. The entry to the West could involve monarchs entering as they followed the Rio Grande north through Las Cruces and then moved to the West into eastern AZ and western NM.

An alternative route would involve advancing through the mountains in Mexico with entry into AZ east of Nogales into southeastern AZ south of Sierra Vista. From there monarchs could advance northward into east-central AZ. Both routes are >300 miles longer than the routes that take monarchs to reach Texas. That would involve a minimum of 6 more days of flight to reach the border.

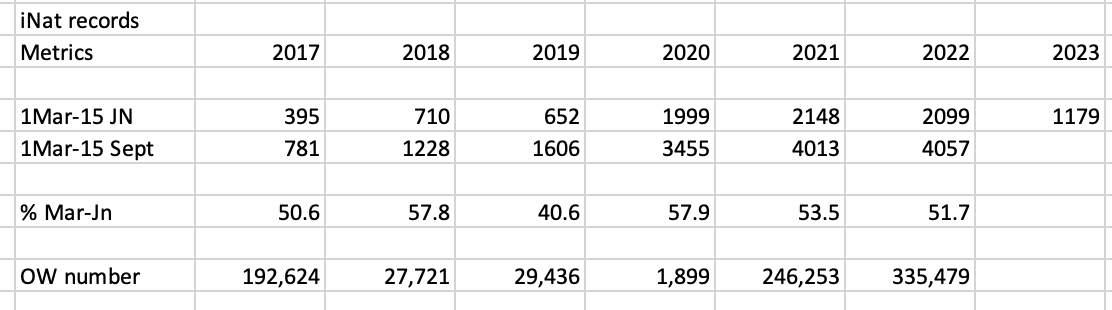
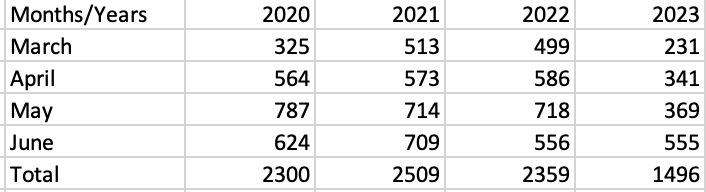
At present, there is no evidence monarchs use either of these routes to reach the US. To establish that such movements occur, we need evidence from isotopes and first sightings. To obtain the isotope evidence, worn monarchs suspected of having returned from Mexico need to be collected and analyzed. First sightings recorded by Journey North and photos from iNaturalist from March and April in the West could help as well.

Monarchs return from Mexico to TX in early March. Arrival continues until mid-April. Similar arrival times would be expected in AZ and NM. In 2020, the year of interest, there was one first sighting in Carlsbad, NM on the 20th of March along with a note that 5 others were seen nearby. There were no other reports of monarchs in NM until the first and second of May. One was described as old and tattered and another as fresh. All were sighted east of the divide. No monarchs were sighted west of the divide until 12 of May in Utah. There were no records on iNaturalist as well. So, there is no evidence from first sightings in 2020 that helps us understand the growth of the population that summer.

Overall, while it is possible that monarchs reach the US along these routes now and then, the probability that the numbers that return are sufficient to lead to substantial increases in western monarch numbers seems low.

Note 3. Ecological release is another possible explanation for the resurgence of the population in 2021. This term is used to explain explosive population growth following an event that eliminates factors that normally limit population growth. Such an explosion of butterflies occurred after the 7month drought in Texas in 2011. That drought was followed by 7months of above normal moisture starting in the fall of 2011. Evidently, due to the suppression of predators and parasites during the drought, 16 species of butterflies were able to produce large numbers which led them to expand their distribution northward into Kansas and beyond in April and early May of 2012. While precipitation in 2020 was the second lowest for the 127year record for the West Climatic Region, the more normal, but still below average, pattern of precipitation in 2021 has not been associated with explosive increases in the numbers of other butterfly species.

Filed under General | Comments Off on The Western monarch puzzle: the decline and increase in monarch numbers

Monarch Watch Update April 2023

30 April 2023 | Author: Jim Lovett

This newsletter was recently sent via email to those who subscribe to our email updates. If you would like to receive periodic email updates from Monarch Watch, please take a moment to complete and submit the short form at monarchwatch.org/subscribe/

Greetings Monarch Watchers!

A brief update this time around – hope you are starting to see monarchs in your area or see them soon! We spotted the first monarch in Monarch Waystation #1 in Lawrence, Kansas on April 18th; the worn female was busy finding all the emerging common milkweed shoots to lay eggs on 🙂

Included in this issue:
1. Monarch Watch Open House & Spring Plant Fundraiser
2. Monarch Population Status —by Chip Taylor
3. Monarch Tag Recoveries from Mexico
4. Monarch Calendar & Directional Flight Projects
5. Monarch Waystations
6. About This Monarch Watch List


1. Monarch Watch Open House & Spring Plant Fundraiser


It’s here! Our annual Spring Plant Fundraiser is now online at https://spring.monarchwatch.org and we have thousands of plants looking for good homes. We are once again offering online ordering and curbside pickup (or limited local delivery) for this event. To place an order you must live in, or be willing to travel to, LAWRENCE, KANSAS (we cannot ship). These plants are ideal for starting butterfly gardens or adding to established gardens and can contribute to the health of monarch and pollinator populations. Don’t miss out and be sure to take advantage of our “Buy 10 Plants, Get 1 Free” offer!

A complete list of plants and online ordering is available via the link below and pickup appointments are being scheduled for May 10, 11 & 13.

Monarch Watch Spring Plant Fundraiser: https://spring.monarchwatch.org

We are also having an in-person component of our Spring Open House & Plant Fundraiser on Saturday, May 13th. This will be a primarily outdoor event and there will be tours of our gardens, games, activities, monarch butterflies, caterpillars, and lots of butterfly plants available for your own garden! Complete details at https://monarchwatch.org/openhouse

If you are not able to participate locally, we invite you to contribute to this annual fundraiser by donating to Monarch Watch via https://monarchwatch.org/donate

Thank you!


2. Monarch Population Status —by Chip Taylor


A few notes on the development of the eastern and western monarch populations as of 20 April 2023.

Eastern monarch population

The Journey North program ( https://journeynorth.org ) has been recording monarch first sightings for 23 years. It’s an awesome record with a number of uses. Out of curiosity to see how first sighting this year in NE Kansas compared with other years, I skimmed through those records. This year the first monarch to appear in the Topeka, Lawrence, Kansas City area was spotted on the 10th. That is early and by the 18th there were a number of sightings. Checking the records revealed that more than one sighting by the 18th of April has only occurred in 7/23 years. In other words, the number of monarchs to reach our area is so few in most years that we simply don’t encounter them, or they may not even be this far north.

While I have been watching the first sightings accumulate in space and time this year, I’m finding it difficult to assess what the data mean. The numbers for Texas are down. That could mean the population is down, with fewer returnees or it could mean that monarch activity was low due to cool weather so fewer were seen. The latter seems possible since I’ve seen a number of reports by observers that mention the sightings of many monarchs over time or on single outings. While some of the monarchs arrived ahead of the emergence of milkweeds in some areas, it appears that the majority of eggs laid by returning monarch were laid in Texas, where due to slightly warmer temperatures, the larvae will develop faster than if the eggs were laid further north. I’ll need to look more closely at the data, but overall, the colonization by the returning monarchs fits a common pattern and there is no reason for concern at this time.

Western monarch population

The population rebound over the last two years in the West has been remarkable. The numbers counted at all known overwintering sites last November exceeded 335K. This was the largest population recorded since 2000 – a mere 22 years. How is that possible, and what does it mean for the future? Can we expect similar numbers or even more monarchs in November 2023? Probably not. The population is certain to be lower for a number of reasons, but how much lower and where will the monarchs originate from that reach the overwintering sites?

The western population development, like that of the east, is largely driven by the weather. So, the immediate question is are the weather patterns from last November to the present similar to any year in the past and the answer is yes. The winter and spring of 2006 in California was cold, though not as wet, as that of 2023. The temperature patterns were quite similar. Statewide the three-month interval from January through March was the coldest since 1955 and one of the wettest as well with many strong storms. These conditions had to take a toll on the overwintering monarchs and certainly reduced the number of females available to begin egg laying as the weather warmed, but when did that begin? In most years, especially recently, mating and reproduction begin by mid-March and sometimes earlier. This year the mean temperatures for March were 44.2F vs 44.0F for 2006. These were the 4th and 5th coldest March temperatures in the record that goes back to 1895. April started out cool in both years with temperature increasing in the last 10 days of the month (based on the 10-day forecast for this year). So, given these extreme conditions, how much reproduction has been possible to date this year? There are no data on this point.

Again, looking to 2006, at the end of the migration the count was over 200K. Will the numbers reach 200k this year. Maybe, but I’m skeptical. In most years, first generation monarchs would begin emerging in the next week and would begin moving into the Sierra foothills and beyond into Nevada and the inner mountain west. Some would begin moving in May toward the NW as well. Movement out of California looks to be limited for some time due to cold conditions in both the Sierras and to the north. If these conditions continue, most of the overwintering monarchs in November will have originated from California. This was first suggested by Paul Cherubini, a long-term observer of monarchs in the west, in a post to the Western Monarchs email list ( https://groups.io/g/WesternMonarchs ) on 5 April. Paul maintains that the population could “produce an overwintering population roughly as large as the past two winters”. That would surely be an interesting outcome.


3. Monarch Tag Recoveries from Mexico


More than 360 Monarch Watch tags were recovered from monarch overwintering sites in central Mexico during the 2022 tagging season. All of the tags have been examined and the “Tag recoveries from central Mexico” list has been updated. By default, this list is sorted by the report season then by tag code and now includes over 21,000 records.

Get out your tag codes and check out the updated list 🙂

Monarch Watch tag recoveries: https://monarchwatch.org/tagrecoveries

As a reminder, it is never too late for data so if you have not yet submitted your records, please do so at your earliest convenience via https://monarchwatch.org/tagging

Thank you to everyone who tagged monarchs in 2022 and also those who assisted with the recovery efforts!


4. Monarch Calendar & Directional Flight Projects


For those of you that are participating in our Monarch Calendar or Directional Flight projects, an email will be sent to everyone who has registered at the end of the observation periods with instructions to submit data. If you have not yet registered or would like more information about these projects, please see the links below.

Monarch Calendar Project: https://monarchwatch.org/calendar

Directional Flight Project: https://monarchwatch.org/directional-flight


5. Monarch Waystations


To offset the loss of milkweeds and nectar sources we need to create, conserve, and protect monarch butterfly habitats. You can help by creating “Monarch Waystations” in home gardens, at schools, businesses, parks, zoos, nature centers, along roadsides, and on other unused plots of land. Creating a Monarch Waystation can be as simple as adding milkweeds and nectar sources to existing gardens or maintaining natural habitats with milkweeds. No effort is too small to have a positive impact.

Have you created a habitat for monarchs and other wildlife? If so, help support our conservation efforts by registering your habitat as an official Monarch Waystation today!

Monarch Waystation Program: https://monarchwatch.org/waystations

A quick online application will register your site and your habitat will be added to the online registry. You will receive a certificate bearing your name and your habitat’s ID that can be used to look up its record. You may also choose to purchase a metal sign to display in your habitat to encourage others to get involved in monarch conservation.

As of 26 April 2023, there have been 42,680 Monarch Waystation habitats registered with Monarch Watch! Texas holds the #1 spot with 3,558 habitats and Illinois (3,270), Michigan (3,128), California (2,790), Ohio (2,226), Florida (2,213), Pennsylvania (1,877), Virginia (1,864), Wisconsin (1,842), and New York (1,384) round out the top ten.

You can view the complete Monarch Waystation Registry and a map of approximate locations via https://monarchwatch.org/waystations/registry


6. About This Monarch Watch List


Monarch Watch ( https://monarchwatch.org ) is a nonprofit education, conservation, and research program affiliated with the Kansas Biological Survey & Center for Ecological Research at the University of Kansas. The program strives to provide the public with information about the biology of monarch butterflies, their spectacular migration, and how to use monarchs to further science education in primary and secondary schools. Monarch Watch engages in research on monarch migration biology and monarch population dynamics to better understand how to conserve the monarch migration and also promotes the protection of monarch habitats throughout North America.

We rely on private contributions to support the program and we need your help! Please consider making a tax-deductible donation. Complete details are available at https://monarchwatch.org/donate or you can simply call 785-832-7386 (KU Endowment Association) for more information about giving to Monarch Watch.

If you have any questions about this email or any of our programs, please feel free to contact us anytime.

Thank you for your continued interest and support!

Jim Lovett
Monarch Watch
https://monarchwatch.org

You are receiving this mail because you were subscribed to the Monarch Watch list via monarchwatch.org or shop.monarchwatch.org – if you would rather not receive these periodic email updates from Monarch Watch (or would like to remove an old email address) you may UNSUBSCRIBE via https://monarchwatch.org/unsubscribe

If you would like to receive periodic email updates from Monarch Watch, you may SUBSCRIBE via https://monarchwatch.org/subscribe

This e-mail may be reproduced, printed, or otherwise redistributed as long as it is provided in full and without any modification. Requests to do otherwise must be approved in writing by Monarch Watch.

Filed under Email Updates | Comments Off on Monarch Watch Update April 2023

Monarch numbers: dynamics of population establishment each spring

27 March 2023 | Author: Jim Lovett

Monarch numbers: dynamics of population establishment each spring
Chip Taylor, Director, Monarch Watch

Introduction
The short narratives that follow describe the outcomes of the timing and number of monarchs arriving from Mexico in March. Each cohort encounters different temperature scenarios in March and April that largely determine the size of the population the following winter season. To be sure, there are additional factors that determine the size of the migratory population and the overwintering number of hectares, but it is largely what happens in March, April and May that set the stage for the rest of the season. A key to population growth is both the number of first-generation offspring produced in this period and their age at first reproduction which is an outcome of their developmental history.

I’ve chosen 4 years – 2012, 2013, 2017, 2018 – to illustrate the dynamics associated with the interactions of the returning migrants and the weather each cohort encounters. The first pair represent both the earliest and most rapidly advancing migration and the smallest and latest cohort to advance north of 40N since 2005. The second pair were selected to show the consequences of advancing northward too soon as in 2017 or being limited to reproducing largely in Texas and southern Oklahoma as in 2018 due to colder weather further north. The latter two show that similar starting conditions can lead to different outcomes. The mean temperatures in March for Texas for three of these years were significantly above the long-term average (+5.4F, +6.9F, +7.3F). Elevated temperatures in this range are expected to become the norm in the near future.

As background, although some monarchs returning from Mexico enter Texas during the first week of March, the influx increases in the second week of March with monarchs often detected in areas of the Edwards Plateau as well as San Antonio, San Angelo and Austin. This progression continues N, NE as weather permits, with most of the returning monarchs dying by the 1st of May. In this analysis, I’ve totaled the first sightings from 30N, just north of the latitude (29N) at which milkweed diversity and abundance increases in Texas, northward beyond north of 40N. The longitudinal range is 80W (western PA) to 100W (mid Dakotas). These progressions each year are related to March and April temperatures for Texas, Oklahoma and Kansas. Throughout this treatment, 40N is used as the southern limit of the summer breeding habitat since tagging indicates that more than 80% of the monarchs reaching the overwintering area originate north of 40N.

2012
March in 2012 was the warmest recorded in the US for that month since record keeping began in 1895. The median arrival for first sighting in Texas was 13March, the earliest in the 24-year record of first sightings reported to and recorded by Journey North. The temperatures were significantly above the long-term averages for March and April from Texas through Kansas (Table 1). These conditions allowed monarchs to advance significantly from Texas into Oklahoma, Kansas and north of 40N by the 2nd of May, with 23% recorded beyond 40N. Overall, this recolonization was the earliest to date for all regions north of 40N with only 3.6% of the sightings reported in the last observation interval from 31May-9June (Table 2, see Appendix). There are significant consequences of advancing northward rapidly; getting ahead of emerging milkweeds and laying eggs in regions which are cooler results in a longer development time for immatures and therefore a delayed age to first reproduction. The latter can have the effect of lowering the rate of population growth. While it is likely that arriving too early at the northern latitudes had a negative effect on population growth, the summer temperatures were also extreme resulting in a substantial drought that also had a negative impact on the development of the generation destined to migrate. Together, these negative spring and summer conditions resulted in a decline in winter numbers from 2.89ha in 2011 to 1.19ha (-1.7ha). These developments were a precursor and likely a contributor to the crash in the population that occurred in 2013.

2013
The number of first sightings in 2013 was low relative to previous and following years, raising the possibility that many monarchs did not survive the winter in Mexico or during the return migration from the overwintering sites to Texas. It is also possible that the weather in Texas limited the activity of the monarchs and therefore the number of sightings. While the mean temperature for March in Texas (0.9F) was close to the long-term mean, the lower April temperatures for Texas through Kansas evidently limited northward movement, with the result that 83% of the first sightings were limited to the 30-35 latitudes (roughly Austin to Oklahoma City). The lower April temperatures for both Texas and southern Oklahoma evidently slowed the development of the first-generation offspring, resulting in the latest recolonization of the areas north of 40N in the Journey North first sighting records (55.7%, Table 2). Thislate arrival is in contrast to the arrivals in 2012 in which only 3% of the sightings occurred in the last observation period (Table 2). This delayed beginning to the production, together with the low numbers, were surely factors that led to the all-time low number of hectares at the overwintering sites during the 2013-2014 winter season.

2017
The mean temperature for March 2017 was 7.3F above the long-term average and the highest yet recorded. While the median arrival date (26March) was later than average (21March), arriving monarchs rapidly advanced beyond 35N such that only 28% of the first sightings were recorded for 30-35N and 56% recorded from 35-40N. The rapid advance beyond 35N resulted in two unusual events: massive clustering in northern Oklahoma beginning on 4Aprilwhich is described in detail in a Blog posting – Spring roosting: A rare event and a wind-aided surge of these monarchs northward from 7-9April that advanced the front 300miles – well into Nebraska. This event is described in another post to the Blog – Monarch Population Status (5/11/2017). In this case, monarchs were well ahead of emerging milkweeds, egg dumping was common on the few that were above ground and some eggs were subsequently frozen at the northern limits of this push.

We tracked the development from egg to adult for eggs laid 9-10April on tropical milkweeds in large containers maintained outside or our greenhouse in Lawrence, KS. The shortest time from egg to adult was 45 days – at least 15 days longer than if these same eggs had been laid in Texas rather than Kansas. It follows from these observations that distributing eggs too far north too soon contributes to competition among larvae due to egg dumping and perhaps greater predation on eggs. In addition, the loss of some eggs and larvae due to freezing temperatures and a delay in the development of the more northerly part of the distribution results in a higher mean age at first reproduction for the first-generation cohort. That in turn delays colonization of all areas north of 40N as shown by the late first sightings in 2017 (42.9%, Table 2). The overall result of the return migration and the colonization by the first generation was a modest decline in overwintering numbers from 2.91ha in 2016 to 2.48ha in 2017 (-0.43ha).

2018
The March temperatures in 2018 were also above the long-term average (+5.4F), but the outcome differed from that of both 2012 and 2017. In this case, 70% of the first sightings were in the 30-35N range. The monarchs were mostly confined to Texas and southern Oklahoma due to cooler temperatures in April from Texas north to Kansas. The result was the production of a large first generation that, on average, developed more rapidly than the first-generation cohorts in 2012 and 2017. The movement north of 40N was aided by warmer than average May temperatures (+7.0F) in the Midwest. Those elevated temperatures resulted in an earlier colonization of the northern breeding area with only 16.6% of the sightings being recorded in the last observation period (Table 2). As a consequence of these conditions, the population grew from 2.48ha to 6.05ha (+3.57ha). These conditions were similar to those that preceded the development of the population in 2006 (6.87ha).

Summary
These narratives demonstrate the complexities of the interactions of returning monarchs with the environmental conditions encountered during March and April. The development of the population is largely determined by the timing of the return together with the numbers arriving along with the weather conditions that restrict or enhance the expansion of the colonizing population. The limits of movement defined by weather conditions determine the latitudinal distribution of eggs, egg and larval mortality, the growth rate of immatures and the mean age of first reproduction for each returning cohort. In the future, elevated temperatures in March are likely to be associated with more rapid expansions of the breeding population resulting in smaller cohorts of first-generation offspring moving north. A later arrival of these monarchs in the summer breeding areas will also lead to smaller summer and fall populations and later migrations.

Acknowledgements
The interpretations in this text are largely based on Journey North’s first sightings maps and the data they are based on. The value of this data set, started in 2000, lies in the volume of first sightings reported through the winter to the 31st of July. Janis Lentz kindly organized a subset of the data for analysis.

Table 1. Deviations from the long-term (1902-2000) mean temperatures for the months and states indicated.

dynamics-table1

Table 2. Total first sightings from 30N to >40N latitudes from 1March to 2May with percentages sighted across the latitudes for each year. Median dates of first sightings in Texas, hectares measured at the end of the season and net change from the previous year are listed. The last column shows the percentage of first sightings recorded from 31May to 9June (see Appendix).

dynamics-table2

Appendix
The first sightings above 40N were sorted into four 10-day intervals from 1May-9June to assess the timing and number of first-generation monarchs arriving across the northern portion of the summer breeding range. Relatively few first sightings are recorded after 9June. That date is close to the end of directional flight by the first generation. The spring migration appears to stop on or close to the 12th of June as the difference in daylength from one day to the next drops below one minute. For a full discussion of this issue, see Monarch Puzzle Wrap Up.

Distribution maps of first sightings reported to and recorded by Journey North for 1January to 2May for the years indicated. The data in this analysis were based on sightings from 1March to 2May. Sightings were summarized from north of 40N from 1May to 9June as well. The line representing 40N latitude extends from the northern border of Kansas to Philadelphia.

dynamics-distribution-maps

Filed under General | Comments Off on Monarch numbers: dynamics of population establishment each spring

Monarch numbers: trends due to weather and climate

27 March 2023 | Author: Chip Taylor

Monarch numbers: trends due to weather and climate
Chip Taylor, Director, Monarch Watch

The U.S. Fish and Wildlife Service will be making a decision as to whether to list the monarch as either threatened or endangered under the Endangered Species Act as opposed to the current finding which is “warranted [for ESA listing] but precluded [by other higher-priority listing actions]”. That decision will involve many considerations, most important of which will involve an understanding of monarch biology together with the perceived threats to the monarch population.

One threat we have been addressing is the loss of habitat through many new conservation efforts in public and private settings. These efforts, while impressive, need to increase to offset annual rates of habitat loss as well as past losses due to land management. Counter to these positive developments there are negative trends in weather and climate that must be considered. It is these weather and climate-related stressors which, if they continue, will diminish the monarch migration in the coming decades.

Monarchs are being pinched by changes both at the beginning and end of the breeding season.

Increasing temperatures in March and April in the South Region (Texas and Oklahoma) are allowing monarchs to move too far north too soon and September and October temperatures in the Midwest and South Regions respectively are delaying the migrations in a manner that diminishes the number of monarchs reaching the overwintering sites (Taylor, et al 2020). These relationships are summarized, along with the rate of change in temperature per decade, in Table 1. For reference, rates of change of more than 0.5F per decade are extraordinary and rates of 1.0F or higher are indications of truly worrisome trends that are unlikely to moderate or reverse.

Table 1. Rate of temperature change per decade, 1982-2022. Changes of less than 0.5/decade are considered to be inconsequential due to the impact of other factors on monarch numbers. Temperatures of more than 0.5/decade are likely to have either negative or positive effects on the development of the population but are known to have negative effects on both the spring and fall migrations. Blanks represent months when monarchs are absent or nearly so from the city indicated. The city temperatures are strongly correlated with state and usually regional temperatures. To provide readers with a sense of what the trend lines look like, I have included three images (see Appendix) obtained from the data available via Climate at a Glance. Color code: white – neutral, yellow – either, pink – negative, green – positive*.

trends-table1

March
High temperatures in March in Texas and Oklahoma along with SW winds allow monarchs to advance too far north too soon, i.e., beyond the emergence of milkweeds. Spreading eggs out to the north also has the effect of increasing the mean age at first reproduction. This delay in turn reduces the rate of population growth. Data supporting this interpretation is presented in another blog article: Monarch numbers: dynamics of population establishment each spring.

April-May
The increase in temperatures in the South in April and May could have both negative and positive effects. Positive outcomes could include more rapid development of immatures which would lessen exposure to predators and parasites. Negatives might include shorter lives for egg laying females.

June, July, August
The increase in temperature in June the Midwest stands out relative to the smaller increases in May, July and August. The conditions in June should have a positive impact on the development of the population since it will accelerate the development of larvae and shorten the mean age to first reproduction for the cohort(s) developing that month.

September
Higher temperatures in September in the Midwest and Northeast (Culbertson, et al., 2021, Ethier and Mitchell 2023) are having the effect of delaying the migrations through those regions. Delayed migrations have several causes, but all are associated with lower numbers of monarchs reaching the overwintering sites (Taylor, et al., 2019, 2020).

October
The high temperature effect applies to the South Region in October. Since this region is prone to droughts, high temperatures combined with droughts during October can have a significant impact on the lipid levels (Brower, et al., 2015, Hobson, et al., 2020) and are likely to affect adult survival since monarch numbers are lower at the overwintering sites following these conditions (Taylor, et al., 2020). The elevated temperature in 2019 may be one of the reasons the overwintering numbers declined from 6.05ha in 2018 to 2.83 in 2019. The mean temperatures during October 2019 in San Antonio were the highest in the 128-year record.

Other Threats
Other threats include El Niño and the ability of monarchs to enter diapause. Both constitute existential threats to the continuation of the monarch migration as we know it today. I’ll dive into these topics as time permits.

References

Brower, L. P., Fink, L. S., Kiphart, R. J., Pocius, V., Zubieta, R. R., and Ramírez, M.I. (2015). “Effect of the 2010-2011 drought on the lipid content of monarchs migrating through Texas to overwintering sites in Mexico,” in Monarchs in a Changing World: Biology and Conservation of an Iconic Butterfly, eds K. S. Oberhauser, K. R. Nail, and S. Altizer (Ithaca, NY: Cornell University Press), 117–129.

Culbertson, K. A., Garland, M. S., Walton, R. K., Zemaitis, L., & Pocius, V. M. (2021). Long‐Term Monitoring Indicates Shifting Fall Migration Timing in Monarch Butterflies (Danaus plexippus). Global Change Biology. doi.org/10.1111/gcb.15957

Ethier, D. M. and Mitchell, G.W. (2023). Effects of climate on fall migration phenology of monarch butterflies departing the northeastern breeding grounds in Canada. Global Change Biology. doi.org/10.1111/gcb.16579

Hobson, K.A., O.R. García-Rubio, R. Carrera-Treviño, L. Anparasan, K.J. Kardynal, J. McNeil, E. García-Serrano and B.X. Mora Alvarez. 2020. Isotopic (δ2H) analysis of stored lipids in migratory and overwintering Monarch Butterflies (Danaus plexippus): Evidence for critical late-stage southern nectaring? Frontiers in Ecology and Evolution 8:572140. doi.org/10.3389/fevo.2020.572140

Taylor, O. R., Lovett, J. P., Gibo, D. L., Weiser, E. L., Thogmartin, W. E., Semmens, D. J., Diffendorfer, J. E., Pleasants, J. M., Pecoraro, S. D., & Grundel, R. (2019). Is the timing, pace, and success of the monarch migration associated with sun angle? Frontiers in Ecology and Evolution, 7, 442. doi.org/10.3389/fevo.2019.00442

Taylor, O.R. Jr, Pleasants. J.M., Grundel, R., Pecoraro, S.D., Lovett. J.P. and Ryan, A. (2020) Evaluating the Migration Mortality Hypothesis Using Monarch Tagging Data. Front. Ecol. Evol. 8:264. doi.org/10.3389/fevo.2020.00264

Appendix

trends-figure1

Figure 1. Temperature trends in March for selected cities. The horizontal line represents the long-term average. Starting in 2004, most of the yearly means are well above the long-term average.

Filed under General | Comments Off on Monarch numbers: trends due to weather and climate

Monarch Population Status

21 March 2023 | Author: Jim Lovett

The WWF-Telmex Telcel Foundation Alliance, in collaboration with the National Commission of Natural Protected Areas (CONANP), the National Autonomous University of Mexico (UNAM), and the Monarch Butterfly Biosphere Reserve (MBBR), announced the total forest area occupied by overwintering monarch colonies today. Eleven (11) colonies were located this winter season with a total area of 2.21 hectares, a 22% decrease from the previous season (2.84 ha):

monarch-population-figure-monarchwatch-2023
Figure 1. Total Area Occupied by Monarch Colonies at Overwintering Sites in Mexico.

Report (english): Areas of forest occupied by the colonies of monarch butterflies in Mexico during the 2022-2023 overwintering period

WWF story: Troubling news for monarch butterfly populations

Monarch population growth is largely about timing, numbers and weather. Monarch Watch follows the population closely from month to month throughout the year looking for changes that will help us predict the relative size of the population from one interval or stage to the next. This year, starting in May, the data indicated that the mid and late summer numbers would be low and that the migration itself would involve a smaller population than in recent years. This expectation was realized. The number of butterflies tagged during the migration was the lowest in 9 years. This was another sign that the overwintering numbers would be low since the number tagged is correlated with the size of the overwintering population. Two other factors, droughts in Texas and late arrival at the overwintering sites, are associated with low numbers and both occurred last fall.

All in all, monarchs had a bad year due to a sequence of unfavorable weather events. While low numbers are something of a concern, in recent years monarchs recovered from low numbers in 2012 (1.19 ha), 2013 (0.67 ha) and 2014 (1.13 ha) and they will do so again – weather permitting. For more information on the status of the population through the last season see monarchwatch.org/blog/2023/01/04/monarch-population-status-49

Note:
The WWF-TELMEX Telcel Foundation Alliance collaborates with CONANP to systematically monitor the hibernation of the Monarch since 2004, and they join the Institute of Biology of the National Autonomous University of Mexico (UNAM) to analyze changes in forest cover in the area core of the Monarch Butterfly Biosphere Reserve in order to have scientific bases that support the implementation of conservation strategies for the benefit of the species, ecosystems and human beings.

Filed under Monarch Population Status | Comments Off on Monarch Population Status

Monarch Watch 24-hr fundraising event TODAY! (2-16-23)

16 February 2023 | Author: Jim Lovett

Give to Monarch Watch today

Today’s the day we’ve been talking about 🙂

Show your support for Monarch Watch before 11:59 p.m. CST tonight via
https://kansas.scalefunder.com/amb/monarch

We realize that not everyone can give at this time but if you are able, please consider a gift today to help us secure the future of Monarch Watch and support our mission to sustain the monarch migration. Donations of any amount do help and are greatly appreciated!

ONE DAY. ONE KU. is a 24-hour fundraising campaign here at the University of Kansas and this year gifts may be made in support of Monarch Watch. The event is today only (Thursday, February 16th) and all donations made until 11:59 p.m. CST tonight will count toward the day’s totals.

This year, you may choose to support:

1) the Chip and Toni Taylor Professorship in Support of Monarch Watch to help us secure the future of Monarch Watch by hiring a new professor/scientist/director (more info at https://monarchwatch.org/future), or

2) the Monarch Watch Fund to help us continue to expand our education, conservation and research programs and aid many people in their efforts to create habitats to sustain the monarch migration.

During today’s event, gifts to the Chip and Toni Taylor Professorship in support of Monarch Watch will be matched dollar for dollar, up to $50,000, through a generous Director’s match. Additionally, thousands of companies match employee gifts to higher education institutions, which can double or even triple the impact of your contribution. To find out if your employer has a matching gift program, please visit https://kuendowment.org/Your-Gift/Matching-Gifts

To make a donation online with a credit card, PayPal, Venmo or Apple Pay, visit https://kansas.scalefunder.com/amb/monarch

To make a gift by phone, call (888) 653-6111 – just be sure to mention that you would like to give in support of Monarch Watch.

All donations to Monarch Watch are processed by KU Endowment, a 501(c)(3) organization at the University of Kansas. No matter how you give, KU Endowment will allocate 100% of your gift to the fund you choose, and gifts are tax-deductible within the limitations of U.S. federal income tax laws. Please note that online donations will not meet the requirements for Canadian tax returns so if you are in Canada and would like to make a tax-deductible donation, it will have to be made by mail – see the information at https://monarchwatch.org/donate or call with any questions.

Please spread the word about today’s giving opportunity and thank you for your continued support!

Filed under General | Comments Off on Monarch Watch 24-hr fundraising event TODAY! (2-16-23)

Monarch Watch Update February 2023

11 February 2023 | Author: Jim Lovett

This newsletter was recently sent via email to those who subscribe to our email updates. If you would like to receive periodic email updates from Monarch Watch, please take a moment to complete and submit the short form at monarchwatch.org/subscribe/

Greetings Monarch Watchers!

This is a relatively brief update, primarily serving as a follow-up to some items in last month’s email. Thank you for your continued interest and support!

Included in this issue:
1. Monarch Watch One-Day Fundraising Event
2. Overwintering Monarchs at El Rosario
3. Monarch Watch Tag Recoveries
4. International Western Monarch Summit
5. Milkweed Programs & Milkweed Market
6. Wanted: Gerber Baby Food Tubs
7. About This Monarch Watch List


1. Monarch Watch One-Day Fundraising Event


As promised last month, below is the official announcement of this year’s one-day fundraising event taking place next week. We will send out a reminder on the day of the event to give you easy access to the link, should you like to participate. Help us secure our future and support our mission to sustain the monarch migration – donations of any amount do help and are greatly appreciated.

On Thursday, February 16th Monarch Watch will again be featured in the University of Kansas’ annual “One Day. One KU.” 24-hour fundraising campaign. This event provides an opportunity for Monarch Watchers all over the globe to come together and show their support of our program.

This year, you may choose to support:

1) the Chip and Toni Taylor Professorship in Support of Monarch Watch to help us secure the future of Monarch Watch by hiring a new professor/scientist/director (more info at https://monarchwatch.org/future ), or

2) the Monarch Watch Fund to help us continue to expand our education, conservation and research programs and aid many people in their efforts to create habitats to sustain the monarch migration.

During the one-day event, gifts to the Chip and Toni Taylor Professorship in support of Monarch Watch will be matched dollar for dollar, up to $50,000, through a generous Director’s match. Additionally, thousands of companies match gifts to higher education institutions, which can double or even triple the impact of your contribution. To find out if your employer has a matching gift program, please visit https://kuendowment.org/Your-Gift/Matching-Gifts

To make a contribution to Monarch Watch online the day of the event, visit https://kansas.scalefunder.com/amb/monarch and to make a gift by phone anytime between now and the day of the event, call KU Endowment at (888) 653-6111 – just be sure to mention that you would like to give in support of Monarch Watch during the “One Day. One KU.” event.

No matter how you give, KU Endowment will allocate 100% of your gift to the fund you choose, and gifts are tax-deductible within the limitations of U.S. federal income tax laws. For Canadian donors: Please note that the Canadian government will not permit you to declare online donations to us as a tax-deductible donation and a check must be mailed instead (see info at https://monarchwatch.org/donate).

Don’t forget to check your email next Thursday, February 16th for the reminder and link – thank you!


2. Overwintering Monarchs at El Rosario


The days are getting longer, and temperatures are increasing in the northern hemisphere. The decline in activities imposed on nearly all insects by cold conditions is beginning to reverse. For monarchs, that means more flight typified by streaming downslope to seeps and areas where the grasses are covered by dew. They need water to metabolize the lipids acquired during the migration into a sugar named trehalose that provides the energy needed to power all bodily functions. As the temperatures increase, monarchs also become more sexually active with mating increasing dramatically after the 12th of February when the angle of the sun above the horizon at noon drops below 57 degrees. This connection with the solar angle at solar noon (SASN) may be coincidental or not, but there is a connection with both the start of the migration and its end. In the vicinity of Winnipeg at 50N, the migration begins in the first week of August when the SASN value drops below 57 degrees. Further, the first monarchs arrive in the vicinity of the overwintering sites in the last few days of October when the SASN value drops below 57. Celestial changes may also be associated with the declining increase in day length as first-generation monarchs colonize the summer breeding areas. For discussions on this topic see the “Monarch Puzzle Wrap Up” article at https://monarchwatch.org/blog/2022/04/22/monarch-puzzle-wrap-up

As to mating, a study by Tonya Von Hook (1993) indicated that mating in February was predominantly between small males, that were often in poor condition, and large females. While that raised questions about whether small males might be selecting large females as mates based on their prospective ability to lay large numbers of eggs, there are several other things that we should be thinking about. First, why is it that small males are engaging in sexual activity and larger males are less engaged in courtship behavior? Next, are the small males actually selecting for size or are they only able to mate with the larger females? Also, is there any reason large females would choose to mate with small males? And if small males are not discriminating but are attempting to mate with all females, what does that say about these dynamics? Lastly, what if there is no selection by either sex? Could that explain the outcomes?

Maybe it comes down to one word – maneuverability. The small males and females could be more maneuverable with the result that small females are more often able to escape the attentions of small males than large females. Problem solved, but what about those small males, why are they sexually active sooner than larger males? Again, one word – hormones, specifically juvenile hormone (JH) produced by a gland in the head known as the corpora alata. JH production leads to the development and maturation of reproductive tissues, and it could be that small males simply produce more of this hormone early in the season or that all males produce similar amounts, but that JH activates sexual activity faster in the small males due to their small mass and lower lipid content. Since it is possible, perhaps evenly likely, that small males wouldn’t survive the return migration to Texas, there is a tendency to attribute this behavior to a recognition on the part of these males that it’s now or never. If so, we would be talking about cognition and that would be asking a lot for an organism with a mass of less than half a gram and very small brain. So, I don’t think so. It’s just hormones.

While those activities represent what a portion of the overwintering monarchs are doing, the majority, and especially those deep within the forest, are settled on limbs and tree trunks as shown in the pictures below. These photos were taken by Estela Romero on visits to the monarch colony at El Rosario in the first week of February and last week of January 2023.

REFERENCE
Van Hook T. 1993. Non-random Mating in Monarch Butterflies Overwintering in Mexico. Pages 49-60 in Malcolm SB, Zalucki MP, eds. Biology and Conservation of the Monarch Butterfly. Los Angeles, USA: Natural History Museum of Los Angeles County.


3. Monarch Watch Tag Recoveries


Many of you have been asking about when tag recoveries for the 2022 tagging season will be posted online. The tag recoveries within the U.S., Canada and northern Mexico were recently posted online via https://monarchwatch.org/tagrecoveries; recoveries from the overwintering sites in central Mexico are typically reported to us in March and posted online in April once everything is received and verified. We will make an announcement via our email updates so stay tuned!

As a reminder, if you have not submitted your tagging data to us yet, it is not too late! Complete information (including links to the tag data submission form and recovery lists) is available on our Monarch Tagging Program page at https://monarchwatch.org/tagging


4. International Western Monarch Summit


–Chip Taylor, Director, Monarch Watch, University of Kansas

There is a growing movement in the West to sustain the Western monarch population. Efforts are underway in all states west of the divide (except Montana and Wyoming) to provide data that can be used to understand why this population varies from year to year and what can be done to assure there will be monarchs in the future. These efforts are led by Robert Coffan who has been aided by a dedicated group of supporters. The first Western Summit was held in January 2020 and the second in San Luis Obispo in January 2023. I was invited to speak at both events.

In the first, I stumbled through an attempt to bring what I knew about the dynamics of the eastern population to the West. Looking back, there were both good and naïve approaches to understanding monarch numbers in the West. I did show that temperatures were increasing and that the effect was leading to a decline in overwintering locations and numbers in the five southern counties. I also created a matrix of monthly means of temperatures and precipitation for all time periods and areas of the West. Colleagues and I have worked that matrix over and over to identify patterns and explanations, but aside from the general increase in temperatures associated with declines, I consider that approach to be a failure.

In the slides linked below, I have taken a deeper dive into the differences in the conditions between the East and West. As you will see, the West is not only more complicated, but there is only one data set to work with – and there are reasons to question how well that data set represents the size of the population, especially in warmer years.

In summary, there are several messages: 1) more data are needed, 2) the year-to-year variation is largely driven by weather and not habitat loss, pesticides or other factors, and 3) in the long term, monarch numbers will be driven by increasing temperatures from September through February in the coastal counties.

You are welcome to share, discuss and question the interpretations on these slides.

Monarch Population Development: A stage-specific model (slides and notes)


5. Milkweed Programs & Milkweed Market


Monarchs Need Milkweed. Monarch caterpillars only eat milkweed, and you can get milkweed plants from Monarch Watch, possibly for free! Just choose the milkweed program that fits your situation.

Free milkweeds for habitat restoration projects

Monarch Watch will once again be distributing free milkweeds for planting in large-scale habitat restoration projects Spring 2023. Since this program began in 2015, over 731,000 milkweeds have been planted in restored habitat throughout much of the monarch breeding range. New this year, we have added several more regions in California. To qualify, applicants must have a minimum of two acres (one acre or less in California) to restore to natural, native habitat, and have a management plan in place. Milkweeds are awarded on a first come, first served basis, so apply early.

Those awarded free milkweeds need only pay shipping/handling, which is modest compared to the value of the plants. Please help us spread the word by sharing widely. For more information and to apply, please visit: https://monarchwatch.org/free-milkweed-restoration

Free milkweeds for schools and educational non-profits

Schools and educational nonprofits may apply for a free flat of native milkweeds for a public garden or habitat space. Single flats of 32 plants (58 for Texas) will be distributed to recipients in the spring, while milkweed supplies last. The application can be found here: https://monarchwatch.org/free-milkweed-schools-nonprofits

Milkweed Market

Native milkweeds for gardens or habitat are available for purchase from our Milkweed Market at https://shop.milkweedmarket.org The minimum purchase is one flat of 32 plants (58 for Texas). If your space is not large enough for 32 milkweeds, share with your neighbors! The market is now open for pre-orders and availability is based on your ZIP code and our supply.


6. Wanted: Gerber Baby Food Tubs


Reduce, Reuse, Recycle! Do you or someone you know use Gerber Baby Food that comes in those small plastic tubs? If you have access to a supply of these empty containers, consider sending them to us (please rinse them first!) for reuse as monarch rearing chambers. I don’t think Gerber had monarchs in mind when they introduced these tubs, but they work quite well and save us a lot of time compared to other methods we’ve used. The 4 oz tubs work best but we can use the 2 oz tubs as well.

Some of you may recall a similar request years ago that showed how we use these tubs – the plastic lids are no longer included but we still have a good supply of those, and they fit the current tubs.

Please start saving these empty tubs for Monarch Watch and once you have a number of them (shouldn’t take long!) please contact us at monarch@ku.edu for mailing/shipping instructions. If you can coordinate a collection from several sources to send in a single package, all the better. Thank You!


7. About This Monarch Watch List


Monarch Watch ( https://monarchwatch.org ) is a nonprofit education, conservation, and research program affiliated with the Kansas Biological Survey & Center for Ecological Research at the University of Kansas. The program strives to provide the public with information about the biology of monarch butterflies, their spectacular migration, and how to use monarchs to further science education in primary and secondary schools. Monarch Watch engages in research on monarch migration biology and monarch population dynamics to better understand how to conserve the monarch migration and also promotes the protection of monarch habitats throughout North America.

We rely on private contributions to support the program and we need your help! Please consider making a tax-deductible donation. Complete details are available at https://monarchwatch.org/donate or you can simply call 785-832-7386 (KU Endowment Association) for more information about giving to Monarch Watch.

If you have any questions about this email or any of our programs, please feel free to contact us anytime.

Thank you for your continued interest and support!

Jim Lovett
Monarch Watch
https://monarchwatch.org

You are receiving this mail because you were subscribed to the Monarch Watch list via monarchwatch.org or shop.monarchwatch.org – if you would rather not receive these periodic email updates from Monarch Watch (or would like to remove an old email address) you may UNSUBSCRIBE via https://monarchwatch.org/unsubscribe

If you would like to receive periodic email updates from Monarch Watch, you may SUBSCRIBE via https://monarchwatch.org/subscribe

This e-mail may be reproduced, printed, or otherwise redistributed as long as it is provided in full and without any modification. Requests to do otherwise must be approved in writing by Monarch Watch.

Filed under Email Updates | Comments Off on Monarch Watch Update February 2023

Monarch Watch Update January 2023

14 January 2023 | Author: Jim Lovett

This newsletter was recently sent via email to those who subscribe to our email updates. If you would like to receive periodic email updates from Monarch Watch, please take a moment to complete and submit the short form at monarchwatch.org/subscribe/

Greetings Monarch Watchers and Happy New Year to all!

As many of you already know, Monarch Watch celebrated 30 years of education, conservation, and research in 2022 – WOW! We are very thankful for everyone who continues to support us through donations, participation in our programs, and other activities that serve our mission to sustain the monarch migration.

Included in this issue:
1. Monarch Population Status
2. Monarch Watch One Day Fundraising Event
3. Monarch Watch 30-year celebration
4. Monarch Symposium
5. Monarch Watch Tagging Kits for 2023
6. Submitting Tag Data
7. Milkweed Programs
8. Monarch Waystations
9. About This Monarch Watch List


1. Monarch Population Status – Chip Taylor


Status of the eastern monarch population (as of December 2022)

I’ve said it before, but it bears repeating. Monarch numbers each season are largely due to the timing and numbers from one stage in the annual cycle to the next. Habitat availability, which comes down to the abundance and distribution of milkweeds as well as the nearby sources of nectar, sets the upper limit for monarch numbers. More habitat means more monarchs if the temperatures and rainfall throughout the year are close to the long-term averages. However, the conditions are seldom, if ever, optimal. So, the task, for those of us developing stage specific models for wildlife, is to determine how birth rates and death rates are affected within each stage that determines the number entering the next stage.

The monarch annual cycle can be broken down into six stages: (1) overwintering from November to April, (2) migrating back to the US late February to April, (3) breeding from March to May by returning monarchs, (4) first generation recolonization of the summer breeding areas north of 40N, (5) summer breeding from May to September and (6) migration from August to December.

The area of the forests with monarchs this winter is going to be low – probably one of the all-time low numbers – close to, if not below, 1 hectare (2.47 acres). I could see that the numbers would be down this year as early as late May and nothing happened through the rest of the season to change that assessment.

So, what happened from stage to stage this year? For a complete analysis, please see the recent Monarch Population Status post via our blog at https://monarchwatch.org/blog


2. Monarch Watch One Day Fundraising Event


Monarch Watch will again be featured in the University of Kansas’ annual “One Day. One KU.” 24-hour fundraising campaign which will take place in mid-February. The event will provide an opportunity for Monarch Watchers all over the globe to come together and show their support of our program.

In the past, many of you commented that you would like more notice of this event so this is just a quick heads-up before an official announcement that will be made in the coming weeks. Stay tuned!


3. Monarch Watch 30-year celebration – Chip Taylor


In the 30 years of Monarch Watch, I have had the privilege of working with many people who have had a strong interest in monarchs, education, research, conservation, outreach, filmmaking, and more. I benefited and Monarch Watch grew as a result of these many relationships.

For our 30-year anniversary, we wanted to both celebrate our achievements and thank the many people who have supported our mission through the years. We held a three-day event in September that included a banquet, symposium, garden party and monarch tagging event. That involved a lot of planning by all four of us but especially by Jim Lovett, Ann Ryan and Dena Podrebarac. Thanks to their hard work and the invaluable assistance of the entire Kong family, the celebration exceeded our expectations.

We were joined by hundreds of visitors, representing 3 countries and 30 states/provinces. Our guests also included nine of our Monarch Conservation Specialists, past staff and students, KU colleagues, volunteers and many long-time supporters. One surprise for me was the attendance of dozens of people I didn’t know – an indication that Monarch Watch has affected more people than we are aware of.

The banquet was held at Abe and Jake’s, an event facility located adjacent to the Kansas (Kaw) River. Guests were treated to live music, good food, and excellent company. The banquet ended with three speeches by Brad Williamson, who helped me start Monarch Watch, Laurie Adams, a long-time leader of the North American Pollinator Protection Campaign and the Pollinator Partnership and lastly, myself. I did some introductions and thanked many people and institutions that have helped Monarch Watch through the years. These comments were followed by a bit of history and the announcement about the future of Monarch Watch. It was a great evening.

A monarch symposium followed the next day with about 170 attendees. There were 13 talks with some speakers connected via zoom, others with pre-recorded talks and some in attendance. There was some excellent Q and A between the audience and experts at the end of the symposium. I couldn’t imagine this all going smoothly, but it did – thanks to everyone’s cooperation and Jim’s technological and organizational skills. The symposium was recorded and the video can be found, along with other materials, at https://monarchwatch.org/symposium2022

The symposium was followed by an evening in Monarch Waystation #1 – our garden so ably maintained by the Douglas County Master Gardeners. There were several things going on in the garden including a video by Gwynedd Vetter-Drusch, the dedication of a sculpture, live music and celebratory cookies. There was even a place where people could stop by to ask me questions or just chat.

The celebration wrapped up on Saturday with a monarch tagging event at the Baker Wetlands. The weather was great and those in attendance, at least 420 including many children, collected, tagged and released over 300 monarchs. After the event, the staff, volunteers, and a few exhausted attendees, assembled under the trees at Monarch Waystation #1 for a well-deserved pizza party.

All in all, the celebration seemed to hit the right notes for the attendees and the symposium received especially high marks. For me, this event confirmed that, in spite of all the improved means of communication enabled by technology, there is nothing quite like getting together face to face.

[ Jim ] Thank you to everyone who joined us for this celebration! We’d love to see photos or video from the events – if you have some that you would like to share, please do so via any method detailed at https://monarchwatch.org/share


4. Monarch Symposium


As Chip mentioned above, Monarch Watch held a mini monarch symposium at the University of Kansas as a part of our 30-year events in September. There were 170 attendees and 13 presentations by monarch experts and enthusiasts that were in person, pre-recorded, or remote. The 10-minute presentation format we adopted for this symposium allowed us to cover a number of topics in a relatively short amount of time and the feedback from presenters and attendees alike was overwhelmingly positive. We hope to do this again.

Materials distributed at the symposium are available online at the link below, including the symposium program (which contains the planned order of presentations, complete information about the presenters and their presentations (name, affiliation, contact information, title and abstract), a list of select monarch and milkweed publications from 2022, and a brief Monarch Watch timeline) and the 2021 Monarch Research Review, organized by the Monarch Joint Venture (which provides a summary of monarch research published between September 2020 and December 2021).

Additionally, the entire symposium was recorded and the full video (3h 33m) is now online at the link below and via our YouTube channel. Video “chapters” have been defined so that you may jump to a specific presentation at any time.

Monarch Watch Symposium 2022: https://monarchwatch.org/symposium2022


5. Monarch Watch Tagging Kits for 2023


Monarch tagging continues to be an important tool to help us understand the monarch migration and annual cycle. We are now accepting PREORDERS for the 2023 fall tagging season and kits will be sent out in the fall, ahead of the migration in your area. If you would like to tag monarchs this year, please order your tags as early as possible!

Monarch Watch Tagging Kits are only shipped to areas east of the Rocky Mountains. Each tagging kit includes a set of specially manufactured monarch butterfly tags (you specify quantity), a data sheet, tagging instructions, and additional monarch / migration information. Tagging Kits start at only $15 and include your choice of 25, 50, 100, 200, or 500 tags.

Monarch Watch Tagging Kits and other materials (don’t forget a net!) are available via the Monarch Watch Shop online at https://shop.monarchwatch.org – where each purchase helps support Monarch Watch.

Complete information including datasheets and instructions are available on the Monarch Tagging Program page at https://monarchwatch.org/tagging


6. Submitting Tag Data


Many of you have submitted your recent tag data to us by mail or via our online submission form – thank you! We are still receiving data sheets and if you haven’t submitted your data yet (for 2022 or even previous years) it is not too late. Please review the “Submitting Your Tagging Data” information on the tagging program page then send us your data via the Tagging Data Submission Form.

Complete information is available at https://monarchwatch.org/tagging if you have questions about submitting your data to us and we have conveniently placed a large “Submit Your Tagging Data” button on our homepage at https://monarchwatch.org that will take you directly to the online form.

There you can upload your data sheets as an Excel or other spreadsheet file (PREFERRED; download a template file from https://monarchwatch.org/tagging ) or a PDF/image file (scan or photo).

You may also use the new Monarch Watch mobile app (available for Apple and Android devices) to record and submit data – download from your app store or visit https://monarchwatch.org/app

If you have any questions about getting your data to us, please feel free to drop Jim a line anytime via JLOVETT@KU.EDU


7. Milkweed Programs


Monarchs Need Milkweed. Monarch caterpillars only eat milkweed, and you can get milkweed plants from Monarch Watch, possibly for free! Just choose the milkweed program that fits your situation.

Free milkweeds for habitat restoration projects

Monarch Watch will once again be distributing free milkweeds for planting in large-scale habitat restoration projects Spring 2023. Since this program began in 2015, nearly 732,000 milkweeds have been planted in restored habitat throughout much of the monarch range. To qualify, applicants must have a minimum of two acres (one acre or less in California) to restore to natural, native habitat, and have a management plan in place. Milkweeds are awarded on a first come, first served basis, so apply early.

Those awarded free milkweeds need only pay shipping/handling, which is modest compared to the value of the plants. Please help us spread the word by sharing widely. For more information and to apply, please visit: https://monarchwatch.org/free-milkweed-restoration

Free milkweeds for schools and educational non-profits

If you are associated with a school or educational nonprofit and plan to plant milkweeds in a public garden space, we are taking applications for 2023. Applications will be reviewed beginning in January, and single flats (32–58 plants, depending on location and species) will be distributed to recipients in the spring, while milkweed supplies last. The application can be found here: https://monarchwatch.org/free-milkweed-schools-nonprofits

Milkweed Market

Native milkweeds for your garden or habitat may be available for purchase from our Milkweed Market (not available for all areas). The minimum purchase is one flat of plants (32–58 plants, depending on location and species). If your space is too small for a flat of milkweeds, share with your neighbors! We plan to have the Milkweed Market open for pre-orders by 1 February. https://shop.milkweedmarket.org


8. Monarch Waystations


To offset the loss of milkweeds and nectar sources we need to create, conserve, and protect monarch butterfly habitats. You can help by creating “Monarch Waystations” in home gardens, at schools, businesses, parks, zoos, nature centers, along roadsides, and on other unused plots of land. Creating a Monarch Waystation can be as simple as adding milkweeds and nectar sources to existing gardens or maintaining natural habitats with milkweeds. No effort is too small to have a positive impact.

Have you created a habitat for monarchs and other wildlife? If so, help support our conservation efforts by registering your habitat as an official Monarch Waystation today!

Monarch Waystation Program: https://monarchwatch.org/waystations

A quick online application will register your site and your habitat will be added to the online registry. You will receive a certificate bearing your name and your habitat’s ID that can be used to look up its record. You may also choose to purchase a metal sign to display in your habitat to encourage others to get involved in monarch conservation.

As of 4 January 2023, there have been 41,823 Monarch Waystation habitats registered with Monarch Watch!

You can view the complete Monarch Waystation Registry and a map of approximate locations via https://monarchwatch.org/waystations/registry


9. About This Monarch Watch List


Monarch Watch ( https://monarchwatch.org ) is a nonprofit education, conservation, and research program affiliated with the Kansas Biological Survey & Center for Ecological Research at the University of Kansas. The program strives to provide the public with information about the biology of monarch butterflies, their spectacular migration, and how to use monarchs to further science education in primary and secondary schools. Monarch Watch engages in research on monarch migration biology and monarch population dynamics to better understand how to conserve the monarch migration and also promotes the protection of monarch habitats throughout North America.

We rely on private contributions to support the program and we need your help! Please consider making a tax-deductible donation. Complete details are available at https://monarchwatch.org/donate or you can simply call 785-832-7386 (KU Endowment Association) for more information about giving to Monarch Watch.

If you have any questions about this email or any of our programs, please feel free to contact us anytime.

Thank you for your continued interest and support!

Jim Lovett
Monarch Watch
https://monarchwatch.org

You are receiving this mail because you were subscribed to the Monarch Watch list via monarchwatch.org or shop.monarchwatch.org – if you would rather not receive these periodic email updates from Monarch Watch (or would like to remove an old email address) you may UNSUBSCRIBE via https://monarchwatch.org/unsubscribe

If you would like to receive periodic email updates from Monarch Watch, you may SUBSCRIBE via https://monarchwatch.org/subscribe

This e-mail may be reproduced, printed, or otherwise redistributed as long as it is provided in full and without any modification. Requests to do otherwise must be approved in writing by Monarch Watch.

Filed under Email Updates | Comments Off on Monarch Watch Update January 2023

Monarch Population Status

4 January 2023 | Author: Chip Taylor

Status of the eastern monarch population (as of December 2022)

I’ve said it before, but it bears repeating. Monarch numbers each season are largely due to the timing and numbers from one stage in the annual cycle to the next. Habitat availability, which comes down to the abundance and distribution of milkweeds as well as the nearby sources of nectar, sets the upper limit for monarch numbers. More habitat means more monarchs if the temperatures and rainfall throughout the year are close to the long-term averages. However, the conditions are seldom, if ever, optimal. So, the task, for those of us developing stage specific models for wildlife, is to determine how birth rates and death rates are affected within each stage that determines the number entering the next stage.

The monarch annual cycle can be broken down into six stages: overwintering from November to April, migrating back to the US late February to April, breeding from March to May by returning monarchs, first generation recolonization of the summer breeding areas north of 40N, summer breeding from May to September and migration from August to December.

The area of the forests with monarchs this winter is going to be low – probably one of the all-time low numbers – close to, if not below, 1 hectare (2.47 acres). I could see that the numbers would be down this year as early as late May and nothing happened through the rest of the season to change that assessment.

So, what happened from stage to stage this year? I’ll give you my interpretations with the caveat that the information available on what happened during several stages is either non-existent or inadequate.

Overwintering – November-April.
While the number of hectares of trees with monarchs at the overwintering sites has been recorded every year since 1994, there is no comprehensive understanding of the mortality that occurs each winter. It is known that colonies decline in size through the winter, but whether these declines are associated with offsite mortality or the movement of overwintering colonies is not clear. The only times mortality has been estimated for the majorities of colonies is following major catastrophic events after winter storms (2002, 2004, 2010, 2016). One might think that tag recovery rate would be a good measure of winter mortality. That is surely the case for years with strong winter storms and may apply to other years as well, but overall winter mortality does not appear to be a major determinant of population size from one year to the next.

Migrating North – February-April.
The mortality during the traverse from the overwintering sites to Texas could vary substantially from one year to another due to droughts, excessively high temperatures or a lack of nectar. Monarchs utilize two routes to reach Texas, Figure 1. One, a coastal route of about 600 miles used early in March when temperatures are moderate. This route appears to shut down when the temperatures in Tamaulipas are in the 90s and higher, which is often the case by mid-March. The second, and cooler, route follows the mountains to the north toward Ciudad Victoria and then NW toward Monterrey with a crossing into Texas that takes the monarchs through the Edwards Plateau into central Texas. This route is about 800 miles and essentially duplicates the route of most of the fall migrants. Unfortunately, there is no systematic monitoring of the conditions along these routes. So, what happens from year to year along these pathways and how those conditions impact the proportions of the returning monarchs that reach Texas is unknown.

Figure 1. Spring first sightings reported for Mexico to Journey North. These records suggest monarchs use two pathways to reach the breeding grounds in Texas and beyond.

Fortunately, there is a record of first sightings for the last 23 years thanks to the reporting to Journey North and the leadership of Elizabeth Howard and Nancy Sheehan who have managed that project. To determine if the first sightings tell us something about the timing and number of monarchs arriving from Mexico in the spring, we have compiled all the first sightings from 1March through 30 April for each year. The medians range from 13 March to 2 April and both high and low overwintering numbers followed these early and late median arrivals. The overall, mean is 22 March and the median for 2022 was 25 March.

The numbers recorded each year are also hard to interpret since the number of first sightings reported in Texas has increased over the years from 37 in 2000 to 343 in 2021. Again, there are years when low and high numbers of arrivals are followed by increases and decreases in monarch numbers. Although more digging in the data is warranted, the results suggest that the timing and number of monarchs arriving from Mexico is not a major factor in determining the numbers in most overwintering periods.

Reproduction by returning migrants – March-April.
So, if the timing and numbers of monarchs from Mexico is seldom a factor, that suggests several things. First and second, overwintering mortality is also not a driver in most years nor is the traverse from the overwintering sites to Texas. There are probably years (e.g., 2004) when one or the other or both are important, but that appears to be uncommon relative to other factors that determine end of year numbers.

The temperatures in Texas in March and April have significant impact in determining the size of the population at the end of the cycle. Of the 22 years in the record, the population increased in 10 years and decreased in 12. In 9/10 years with increases, the mean temperatures for Texas were less than +2.5F above the long-term average. The exception to this trend was 2006, a year with a mean temperature for March and April of +5.3F. The number of hectares the following winter increased from 5.92 to 6.87. The explanation for the increase appears to be due to two things: the earliest arriving cohort from Mexico (median = 13 March) and the highest temperatures for April (+5.8F above average) in the entire record from 1895 to the present. The Journey North map of first sightings for the spring of 2006 suggests that early arrival combined with egg laying concentrated in Texas and southern Oklahoma, followed by high April temperatures, led to the rapid development of the larvae and a large cohort of first-generation offspring. These offspring effectively colonized the summer breeding range north of 40N with >75% of the sightings recorded from 21 to 30 May. In contrast to the increases, the population decreased in 6/7 years in which the mean temperatures were in excess of 2.5F. The exception being 2006. For the other 6 years, other factors account for the decreases. For example, decreases followed the two coldest June-August periods (2004, 2009) and late recolonizations north of 40N account for low numbers in 2013 and 2019. The declines of 2002 and 2007, which should have been increases based on March/April temperatures, remain unexplained.

First generation colonization of the summer breeding range north of 40 North

First generation monarchs, mostly originating from eggs laid by monarchs returning from Mexico in Texas and Oklahoma, begin migrating north in the last week of April. This migration appears to continue until the difference in daylength from one day to the next drops below one minute per day at each latitude (https://monarchwatch.org/blog/2022/04/22/monarch-puzzle-wrap-up/). This result indicates that the migration northward stops progressively from south to north with the last of the migration stopping on or about 12 June at 50N.

Applying the dictum that it is timing, numbers and weather that mostly determines the number of monarchs transitioning from one stage to another produced some interesting results. We summarized all the first sighting for longitudes north of 40N latitude. I’m going to refer to the areas defined by 100-90W and 90-80W bounded by latitudes 50 to 40N. These two areas account for about 90% of the recoveries of tagged butterflies in Mexico. The interval for these first sighting is from 1 May to 9 June, a 40-day period divided into 10-day intervals. When we tallied the first sightings for the 23-year interval, two years stood out: 2012 and 2013. In 2012, 92% of the first sightings occurred from 1-20 May while in 2013 only 5% of the first sightings occurred during that interval. The numbers of sightings in 2012 was >2x the number in 2013. The expectation therefore was that the population in 2012 would increase, but it declined. The starting numbers in 2013 also resulted in a decline leading to the conclusion that arriving in the northern breeding areas too soon (2012), perhaps before milkweed is available, or too late (2013), resulting in a delay in starting the summer breeding, can both result in a decline in the size of the migration and the overwintering population. Looking at these two extremes, it seemed appropriate to ask whether there is an optimal time of arrival in the northern breeding areas. Perhaps there is, but that is not evident in the data. There are at least two complications: the phenology of the milkweeds and nectar sources varies from year to year, and the weather after arrival can have a strong impact on the outcome. That’s what happened this year. Fifty-four percent of the first sightings were recorded from 1-20 May, and the numbers were good. Most of the monarchs were sighted during a warm period from 8-20 May. Cold weather followed for 4-7 days over a broad area during which the temperatures were too low most days for egg laying, mating or foraging for nectar. Once I became aware of that, I knew the population would be lower at the end of the season. Populations grow best when egg laying is not interrupted. Delays result in attrition of adults and the ability to continue producing eggs declines with age.

In putting this summary together, I looked for other factors that could explain why the numbers in the migration were low. Although there were a number of complaints of high temperatures and drought conditions from a number of places in the Midwest, scans of the temperatures and rainfall amounts failed to confirm either were extreme. Nor were there other explanations for the low numbers. So, the best I can offer is the likelihood that the interrupted reproduction in the 4th week of May accounts for the low migration and what seems certain to be a low overwintering population.

The Fall Migration – a traverse from 50N to 19.5N beginning in early August and ending in early December.

To assess the success of each migration, I try to determine the lateness of the migration, the numbers tagged, the number and sizes of the roosts reported to Journey North and whether there are drought conditions along the route. I also monitor weather conditions since extremes determine migratory success.

Monarchs tagged late in the season have a much lower chance of reaching the overwintering sites than those tagged early. The same applies to entire migrations. Migrations can be delayed by extremely high or low temperatures, strong headwinds and delayed development of the last generation due to late arrival of monarchs colonizing the breeding areas in May and June.

We also know that the numbers tagged is correlated with the size of the overwintering population. The number of roosting sites and estimates of the numbers per roost can also be useful. Extreme high or low numbers are informative, but intermediate numbers may or may not predict overwintering numbers. We also know that droughts contribute significantly to monarch mortality.

We will have to wait until the tagging data is analyzed to determine if there was more late tagging than usual this year, but that seems unlikely given how the season progressed during June through August. Also, although the temperatures were higher than the long-term averages during September in the Midwest Region and October in the South Region, there are no indications the migration was substantially delayed by the weather.

The temperatures in the vicinity of the overwintering colonies for the last 4 days of Oct, a period during which monarchs are usually spotted in the area, were quite cold and evidently delayed the arrival of the leading monarchs. However, some monarchs appeared near El Rosario on the first of November just in time for the Day of the Dead on the following day. Monarchs were slow to form clusters through November and remained quite scattered in the El Rosario area until late in the month. Whether this scattering will affect the measurements of colonies in early December remains to be seen.

The numbers tagged from 1 August to the end of the season and submitted by 30 November 2022 were only 64% of the number tagged in 2021 (54K/91K), Table 1. This figure could change as more data are received, but since numbers tagged are correlated with overwintering numbers, this result suggests that overwintering numbers will be substantially lower than those of the previous 4 years.

Table 1. A summary of the number of monarchs tagged from 1 August to the end of the season for records submitted by 30 November.

The number of temporary roosts reported to Journey North was also the lowest of the last 5 years, again suggesting lower numbers this winter, Table 2. Although roost numbers and colony numbers appear to be correlated p=0.01, a deeper dive into these data that eliminates roosts west of the continental divide and Mexico, as well as the roosts with single butterflies, or an analysis of roosts by latitude and longitude could produce different results. The numbers per roost could also affect the interpretation.

Table 2. Fall roosts as reported to Journey North, (maps.journeynorth.org/map/?map=monarch-roost-fall&year=2022).

Droughts, such as those of 2000 and 2011 that limit the amount of flowering and therefore nectar available to migrating monarchs, can have a significant impact on the number reaching the overwintering sites. There were areas of exceptional drought in portions of southern Kansas, Oklahoma and Texas and severe drought much of the migratory route in northern Mexico, Figure 1. How successful monarchs were in locating nectar under these conditions has yet to be determined, but all past measures of greenness suggest that the conditions this fall probably limited the number of monarchs reaching the overwintering sites.

The above is my rationale for saying at the outset that the area occupied by overwintering monarchs would be close to, if not below, 1 hectare (2.47 acres). As always, these predictions are a test of the value of the metrics and/or how they are applied to the question. This stage-specific approach reveals massive data gaps and shows us how little we know about monarch demography. This approach also allows us to see that not everything is linear. There are many optima to consider (see Why monarchs are an enzyme). For example, populations decline if the growing season temperatures are too high or too low and grow substantially when the temperatures are close to the long-term average. Arriving early in breeding grounds can get the population off to a good start (2006) or a bad start (2012) depending on the availability of milkweeds and nectar sources and the weather conditions that follow (2022). Lastly, a comprehensive demographic approach to the entire annual cycle will help us avoid interpretative leaps that are misleading or just flat-out wrong.

Figure 1. North American Drought Monitor 30 September 22

Acknowledgements

Much of this analysis is based on the use of the first sightings data assembled by Journey North. These data help define the timing of the stages and the variations from year-to-year help define how weather and the conditions from one stage to another determine population growth. Janis Lentz worked up the data on the first sighting for both Texas and the monarchs colonizing the summer breeding range. She also assisted with my grammar, punctuation and sentence structure. (She doesn’t like long sentences). Jim Lovett provided technical assistance.

Suggested Reading

Taylor, O.R., Lovett, J.P, Gibo, D.L., Weiser, E.L., Thogmartin, W.E., Semmens, D.J., Diffendorfer, J.E., Pleasants, J.M., Pecoraro, S.D., and Grundel, R. (2019). Is the timing, pace and success of the monarch migration associated with sun angle? Frontiers Ecology Evolution. published: 10 December 2019 doi: 10.3389/fevo.2019.00442

Taylor, O.R., Pleasants, J.M., Grundel, R., Pecorraro, S.D, Lovett, J.P, and Ryan, A. (2020) Evaluating the migration mortality hypothesis using monarch tagging data. Front. Ecol. Evol. | doi: 10.3389/fevo.2020.00264

Taylor, O. R. (2020). Why monarchs are an enzyme – Part 1
monarchwatch.org/blog/2020/02/10/why-monarchs-are-an-enzyme-part-1/

Filed under Monarch Population Status | Comments Off on Monarch Population Status

Migrating with Monarchs

28 November 2022 | Author: Jim Lovett

by Denise Gibbs

Currently, I am a Monarch Conservation Specialist for Monarch Watch. Before that, I had a career as an interpretive naturalist, native plant nursery owner specializing in nectar and host species for butterflies, and teacher of a graduate course focused on butterfly conservation. But by far, my most satisfying endeavor (at the late Dr. Lincoln Brower’s urging) was researching Monarch migration and roosting behavior for the Chincoteague Monarch Monitoring Project at Chincoteague National Wildlife Refuge and Assateague Island National Seashore on Assateague Island, Virginia. For 23 fall seasons (mid-Sept to late Oct) I collected quantitative data from a 3X daily Pollard transect (driving census) on refuge roads, a daily point count on the primary dune, and 3X weekly count from the top of a hawk watch tower. In between, I netted and tagged Monarchs. I also conducted impromptu Monarch interpretation and tagging demonstrations for visitors on the beach and on the refuge’s tram tour. The data and my recommendations were included in a Monarch management plan for the refuge which was implemented and continues to benefit migratory Monarchs utilizing the refuge’s resources. But there was just one thing missing. I wanted to know where the Monarchs went after they left the island. I wanted to witness and experience the next phase of their journey…

From mid-Sept to late October 2022, my husband Rob and I journeyed along with Monarchs as they migrated along the Atlantic and Gulf coasts.

The day we left our home in the Verde Valley of central Arizona, our yard was nurturing all life stages of Monarchs. I wished them well and we headed north on I-17, which was lined in fields of gold — sunflowers, goldenrod, golden crownbeard, and goldeneye. AZ had an abundant and extended monsoon season this year — wildflowers and butterflies (including Monarchs) flourished. From Flagstaff, we drove on I-40 toward the East coast. As we traveled, high winds from the south were so strong we feared that Swan (our tall campervan) might be blown into other lanes on overpasses and bridges. Rob drove and I watched for migrating monarchs, but saw none; the wind was not favorable for Monarch flight southward. We drove through 9 states, but I didn’t see a migrating Monarch until a week later in downtown Norfolk, Virginia.

After that, we saw Monarchs every day at every place we stopped. We had several good Monarch migration days on the Delmarva peninsula and its barrier islands — at Assateague Island State Park in MD and Chincoteague National Wildlife Refuge (CNWR) in VA, before we got slammed with Hurricane Ian’s gale-force winds and coastal flooding. The rain was needed. monarch on vanPast years’ wet fields and ditches of Bur-marigold (Bidens laevis) were dry and barren this year. The rains came too late for them, but boosted the blooms of Seaside goldenrod (Solidago sempervirens), which were already late in opening their flowers. The first big wave of migrating Monarchs had to fly further inland from their migratory path along the beach to find the other two species of goldenrod that were in bloom: Slender and Grass-leaved. Groundsel-tree (Baccharis halimifolia) was beginning its bloom and was utilized by migrating Monarchs as well. As usual at CNWR, the wind was variable, and on most days the Monarchs flew (constantly flapping) in less-than-ideal winds. They stopped often to rest in places protected from the wind. Beach parking was limited after the hurricane removed all the public parking lots, so we had to park Swan along the narrow, exposed causeway. This proved to be fortunate for the Monarchs, because they used the vehicle as a wind block and as a place to rest (see photo).

When Bayberry/Groundsel-tree thickets were available, Monarchs would take refuge from the wind in the dense vegetation. But if they rode the wind to the over-washed beach area, they had to find other ways to avoid being blown out over the ocean. On a day with a 20-30 mph NW wind, a Monarch wedged itself in a crack in a wooden board along the saltmarsh boardwalk trail, while others clung to short plant stems on the beach (see photos below).

We left Virginia’s barrier islands and headed south, stopping to camp the first night at Kiptopeke State Park, which is at the southern tip of the Delmarva. With south winds, Monarchs were bottled-up, waiting for a north wind that would carry them safely and swiftly across the Chesapeake Bay to Virginia Beach. (We learned from a friend that their departure en mass actually occurred 5 days after we had left). In the photos below, Monarchs were hunkered down in the Bayberry thickets along the Eastern shore of the Chesapeake Bay when they were not nectaring on the abundant patches of Seaside goldenrod.

We headed south toward Florida, following coastal routes. We stopped at nature centers, welcome centers, and visitor centers. It was encouraging to see that every one of them had a pollinator garden. Some were simply wild patches they had allowed to grow; others were intentionally planted small token gardens, and a few had extensive professionally-designed beds. I did not see any Monarch Waystation signs, but I did see plenty of Monarchs in every garden. Nectar sources included native asters, goldenrods, and Blue mistflower. Only a few gardens contained milkweed— Butterfly weed and/or Tropical milkweed.

We also stopped frequently at every town that had available RV parking (with easy access to the ocean or a bay) to look for Monarchs. We saw them at EVERY place we stopped in VA, NC, SC, and GA. Back Bay NWR in VA was particularly good. Most often, the Monarchs we saw were refueling in patches of goldenrod instead of migrating. We hit the Monarch jackpot on a N wind day at Huntington Beach State Park in SC — a continuous stream of Monarchs flying low (10-20′ high) over the dry sand portion of the beach on a perfect N wind. There easily could have been 10,000 Monarchs by the end of the day (see photo).

Our final stop on the Atlantic coast was the beach at Tybee Island GA, but saw only a few Monarchs in a town-square pollinator garden with Lantana and Tropical milkweed. We turned inland, avoided the interstate, and took alternate routes to St Mark’s National Wildlife Refuge in FL. Roadside nectar sources were abundant but we saw only a few monarchs en route. We spent 2 days at the refuge. Winds were SW or S, so we saw no migrating monarchs — just those that were bottled-up at Lighthouse Point, nectaring on goldenrod, and waiting for the wind direction to shift in their favor. Gulf fritillaries by the hundreds kept the nectaring Monarchs company (see photos below).

The gulf coast from Florida to Texas was surprisingly good. We saw Monarchs everywhere we stopped to look for them. At Point Park Pascagoula, MS (near the birthplace of Jimmy Buffett), we hit another Monarch jackpot. In the 30 minutes that I walked down Buffett Beach, I counted over 1000 monarchs as they flew past me at eye level on a 10-20 mph N wind. Once they reached the point, they stopped to nectar in a dense thicket of Groundsel-tree. There were thousands still nectaring in those thickets when we left at dusk.

Our last stop on the gulf coast was at Sea Rim State Park, TX (NE of Galveston). We arrived at 3:30 PM and made a beeline for the beach. Low tide revealed a wide flat beach where Monarchs were migrating. I counted 52 from 4-4:30. (That was close to the number that Harlen had counted on his driving census along Lavaca Bay the same day). Then at 4:30, Monarchs started dropping down into a wide flat dune area full of goldenrod and other wildflowers. I counted a few hundred nectaring, but the area was so extensive (about 100 x 300 yards) that there were likely many more I couldn’t see. While searching, I found this pair mating (see photos).

Reluctantly, we left the Gulf coast and drove west on I-10 across Texas. We continued to see monarchs crossing the highway from north to south, particularly in the Texas Hill Country. In Kerrville, Monarchs were migrating along the Guadalupe River, stopping to nectar on Bidens and Blue mistflower (see photos below). The last migrating Monarch we saw in TX was in Ozona.

We crossed the state line into New Mexico on Oct 21. I continued to watch for those orange beauties as we drove west toward AZ. We saw no Monarchs in NM. There had already been below-freezing night temperatures and the roadside wildflowers were dead. Another cold front the next day caused the temperature to plummet, and snow was in the forecast for AZ’s White Mountains (our intended route home). Instead we stayed on I-10 to avoid the snow. We stopped in Wilcox to watch the arrival of thousands of Sandhill Cranes. Fleabane and Tansyaster were still blooming around the playa and were luring in Variegated fritillaries, Checkered whites, Queens, Checkered and Fiery skippers — but no Monarchs. Our final campsite of the trip was in the Sonoran Desert near Tucson. There were plenty of Monarchs present, so I felt like we had come full circle.

Final thoughts:
From 23 Fall seasons of watching migratory behaviors of Monarchs on Assateague Island, I already had a deep respect and appreciation for their ability to endure hardships and survive hurricanes, nor’easters, and flooded roosting sites. But all along this trip route, I was in awe of their continued resilience. Their ability to keep migrating despite obstacles was astonishing. They flapped directly into SW and S winds, endured long distances with a scarcity of nectar sources, and hunkered down on days with torrential rain, cold temperatures, gale-force winds, and coastal flooding. Along the Gulf coast they flew over developed beaches with no habitat, through the hazy polluted stench of paper mill exhaust, and over shipyards blasting ear-shattering horns and sirens. They took shelter in the most unlikely and inhospitable places. They got blown backwards or out over the ocean on extremely unfavorable winds, but kept flapping to stay true to their directional flight. The migratory urge (compulsion, drive, stimulus — however you want to describe it) keeps them going — against all odds. There’s a lesson in that for all of us.

map of monarch sightings

Monarch icons indicate locations with significant numbers of Monarchs — either migrating, nectaring, roosting, or all three.

Filed under Monarch Migration | Comments Off on Migrating with Monarchs