Monarch Watch Blog

Monarch population crash in 2013

11 June 2021 | Author: Chip Taylor

What contributed to the monarch population crash in 2013?

The text below was written at the time the U.S. Fish and Wildlife Service was evaluating evidence of all aspects of the monarch population prior to determining whether the monarch should be listed as a threatened species. As you may remember, in December 2020, monarchs were listed as threatened but precluded based on the priorities given to other species which were more clearly threatened and endangered. A final decision on the status of monarchs is scheduled for 2024. The below was neither published nor posted to this blog. It should have been since the analysis is relevant to what happened between 2016-2018 in California that led to the collapse of the Western monarch population. I’ve reorganized and added to the original text to provide more background and clarity.

INTRODUCTION

There are numerous ways to associate trends in the growth or declines in populations with physical (weather related) and biological factors. Ideally, there are real numbers to work with but that is seldom the case, and lacking hard counts, we often have to link outcomes tentatively with causative factors until we see the patterns appear over and over again in generation to generation or year to year records. That’s the case with monarchs. Numbers are generally lacking with cause-and-effect relationships first appearing as speculation or inference. Those insights, if confirmed again and again, can morph into hypotheses, and in the best cases, correlations, which, in themselves, do not guarantee causation. The next step is prediction. If the outcomes can be predicted based on the observed relationships, we can be reasonably sure we are on the right track.

My approach to trying to understand the trends in monarch numbers has been to use what is called a stage specific model. I break the annual cycle into 6 stages based on the dominant activity within a stage. Each stage is treated as a discrete period that demographically represents either an increase or decrease in numbers depending on conditions during the period but not excluding the condition of the butterflies entering a stage. For example, drought starved monarchs could arrive at the overwintering sites with shorter wings, smaller mass and reduced fat bodies that could affect both mortality during the stage and realized fecundity of the survivors. Further, each stage sets the initial numbers for the next stage, and, in effect, provides limits on what can happen in the next stage irrespective of the conditions during that stage. In other words, the outcome of the next stage depends both on the starting numbers and fitness (mass, fat body, wing area) of the starting population and the conditions during that stage. Good starting numbers may not result in an expected increase if conditions are poor, and conversely, poor starting numbers can effectively cap the outcome even under the most favorable conditions. It also appears to be extremely difficult for a population to recover from a poor start in a breeding season that only involves 3-4 generations.

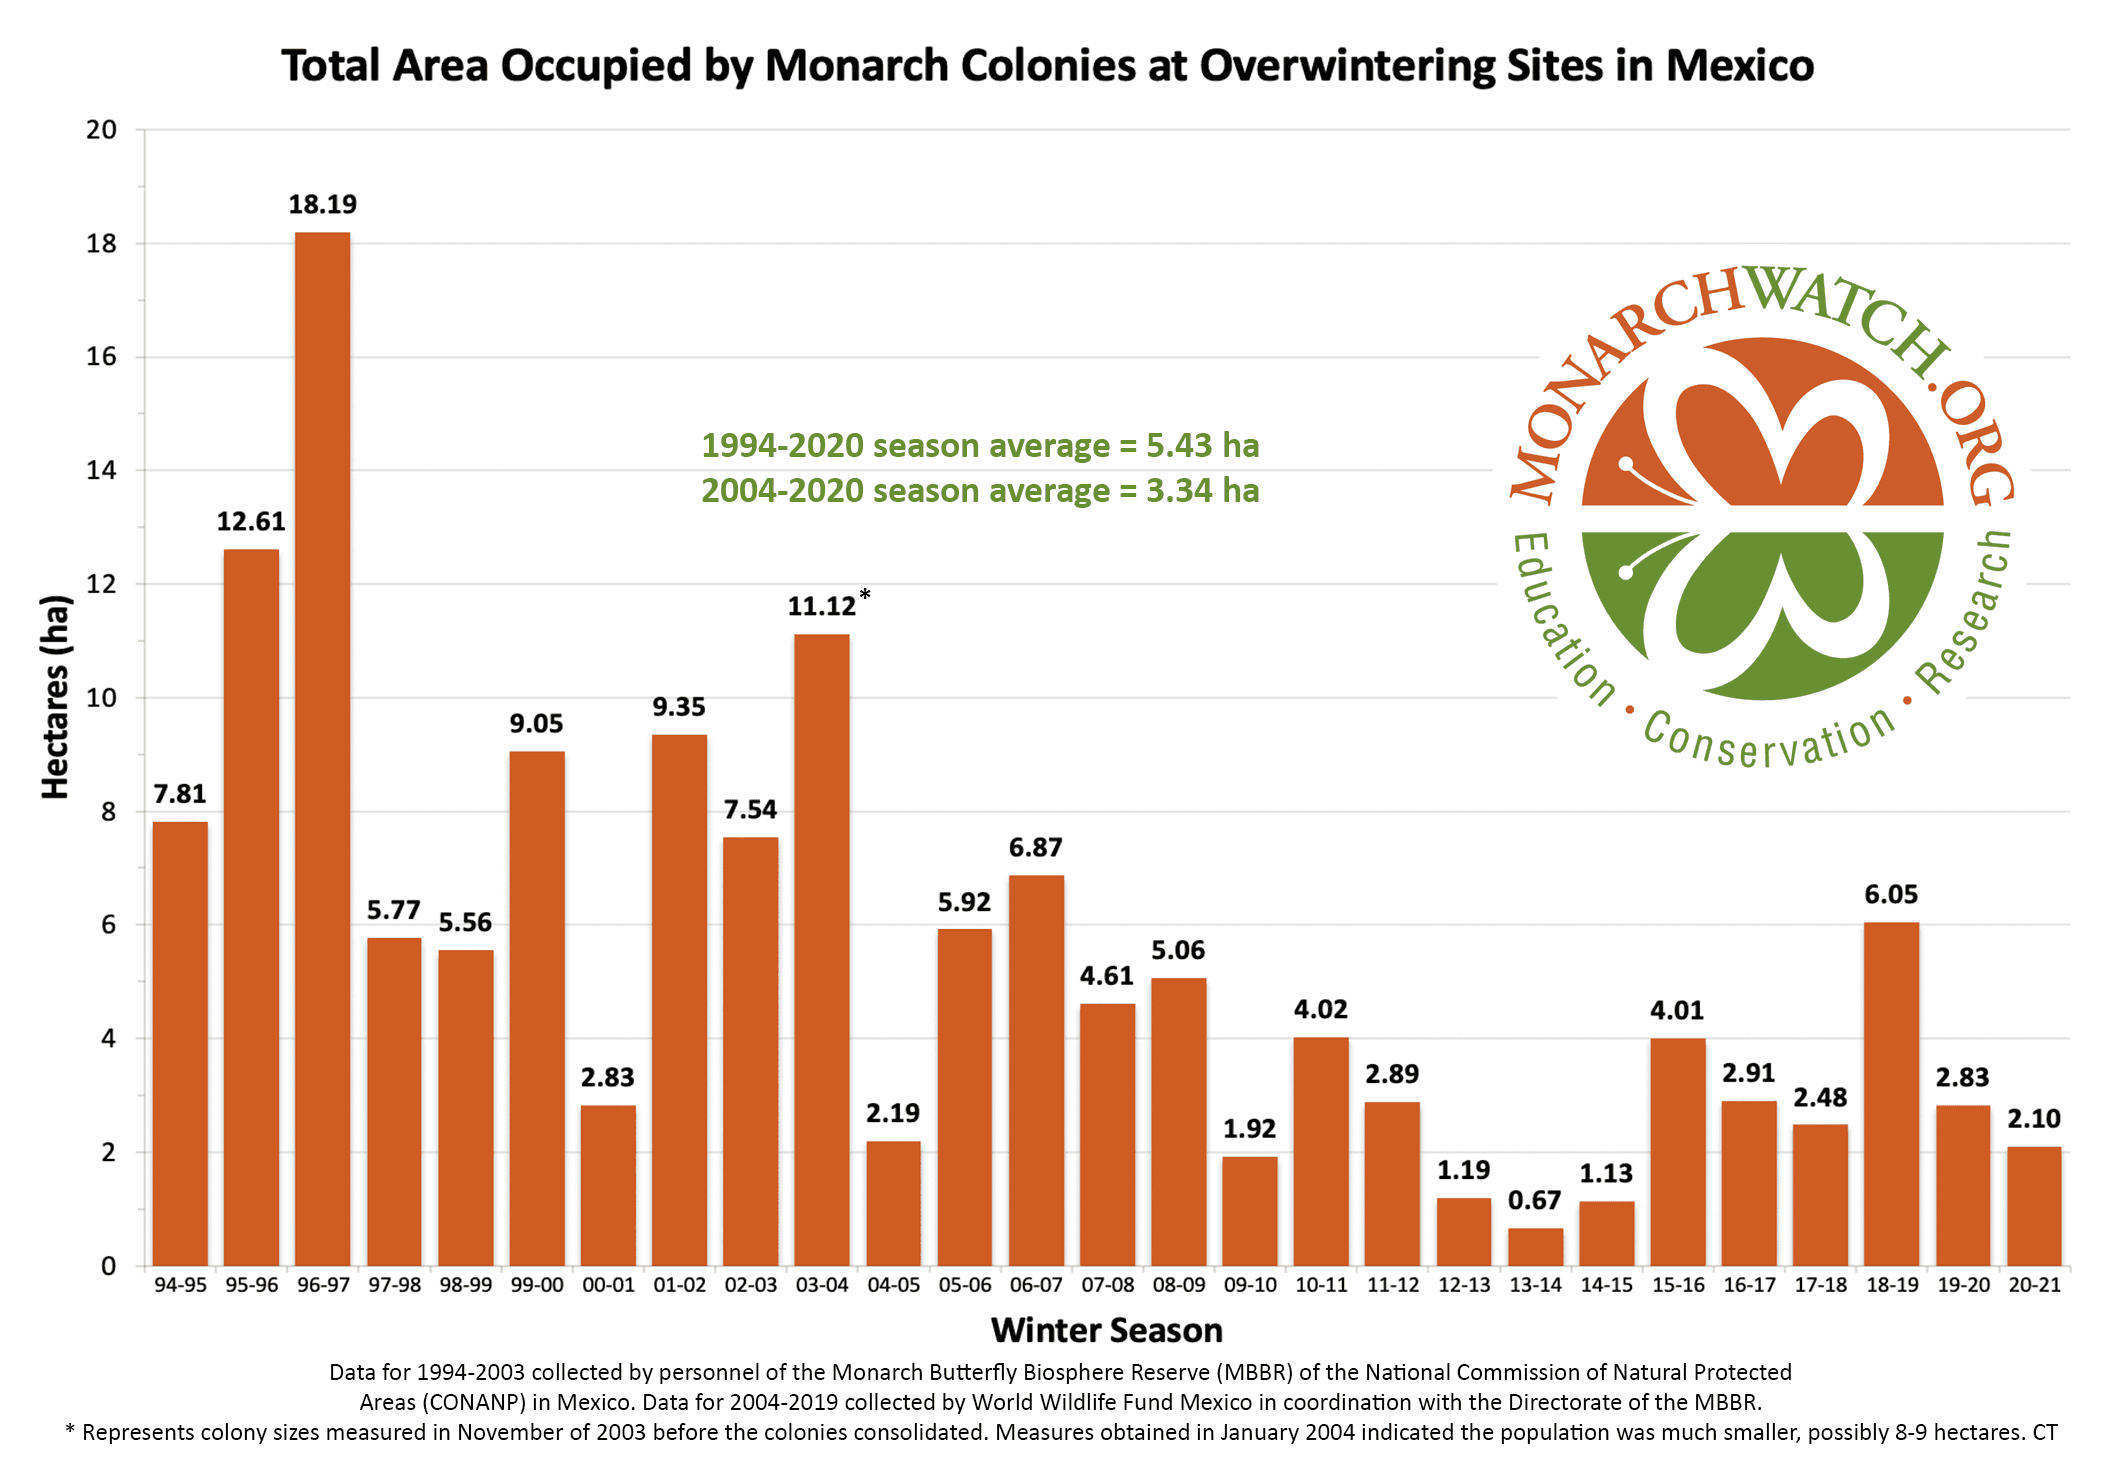
This approach evolved from attempts to understand the variation in year-to-year measurements of the size of the overwintering monarch population in Mexico. My quest started with a simple question: what was the explanation for the decline from 18.19 hectares in the winter of 1996-1997 to the following winter of 1997-1998 with a population of 5.77 hectares? The answer appears to be an April frost in Texas that killed large numbers monarch eggs and larvae. That quest led to an analysis of the factors possibly associated with population growth for all years from 1994 forward as well as searches through the weather records back to 1895. The point I’m making is that, although this text focusses of what happened from 2011-2015, the data base I’ve used to interpret these records is extensive.

METHODS

The metrics used in this analysis are large scale, or reflect measures of large-scale, that is multi-regional, events. Regional weather and local and regional impacts due to predators, parasites and pesticides all have a role in determining population numbers but are difficult to measure and hard to integrate into a stage specific model. With this in mind, I have selected only a few measures that appear to be correlated with outcomes in a way that give them predictive value. Among these measures are first sightings of adult monarchs in the spring, March temperatures in Texas, May temperatures north of 40N, summer temperatures and NDVI, a measure of greenness of the vegetation on a landscape (Table1). Success or failure of population growth is measured by the increase or decrease in the areas occupied by monarchs at the overwintering sites from one year to the next.

RESULTS

The population declined from 2011 to 2012 and again from 2012 to 2013 and increased in both 2014 and 2015 (Table 1). The declines occurred as the result of high March temperatures in TX (2011, 2012), summer temperatures >1.9F above the long-term means (2011, 2012), drought conditions (low NDVI) in the South Region (2011, 2012) and a low number of first sightings (2013). The increases in 2014 (0.67 to 1.13) and 2015 (1.13 to 4.02) followed favorable mean temperatures for population growth in March, May and June-August. The NDVI index, which can be taken as a proxy for the availability of nectar sources, was high for each year as well

The associations of high mean temperatures and drought conditions with population decreases is seen throughout the record from 1994 through 2019. Similarly, population growth from one year to the next is associated with mean temperatures that are close to or below the long-term average for March in TX. The longer record shows that populations increase when summer means are up to 1.9F above long-term means but decrease when mean temperatures substantially exceed +1.9F. Populations also decline when mean temperatures are >-1.5F below average (2004, 2009).

The temperatures for September and October represent the conditions for the first and second halves of the fall migration (Table 1). Although there is no clear relationship between these means and the size of the overwintering population in these data, this may be changing. The extreme high temperatures for September 2019 delayed the migration by up to two weeks. Those temperatures and a drought in Texas and northern Mexico resulted in an unusually low recovery rate (N=392) for tagged monarchs suggesting that attrition due to these factors limited migratory success. Similarly, above average September temperatures in the Northeast in recent years are associated with lower recovery rates of tagged butterflies from this region.

DISCUSSION

The low number of monarchs reported at the overwintering sites in Mexico in the winter of 2013-2014 appears to have been the result of a series of negative weather events that began in the summer of 2011. Excessive temperatures and droughts in 2011 and 2012 followed by low initial colonizing numbers in the spring of 2013 account for the decline. More favorable conditions for population growth allowed the population to increase in 2014 and 2015.

Temperatures

Summer temperatures can have a significant impact on the size of the fall migratory population. A review of all the records suggests that population growth is enabled when temperatures range from a little over -1F to almost +1.9F. Lower temperatures of >-1.5F, as in the summers of 2004 and 2009, both due to a southward dip in the jet stream, resulted population declines. These reductions may have been due a reduction in egg development which is temperature dependent, egg laying rate or simply a shorter growing season or all three. Average temperatures in the Upper Midwest greater than +1.9F were also associated with declines. Such temperatures are likely to negatively affect realized fecundity by reducing the reproductive activity and longevity of adults. In addition, such temperatures affect resources available to adult monarchs by shortening flowering intervals, and hastening senescence of host plants.

Droughts

A metric known as normalized difference vegetation index (NDVI), a measure of greenness derived from satellite imagery, is frequently used to measure the severity of droughts. Low values indicate severe drought conditions and the NDVI values for Texas were low in both 2011 and 2012. These low values are associated with low recoveries of tagged monarchs and lower than expected overwintering numbers. Drought conditions also occurred in some parts of the Upper Midwest in 2012. Those conditions may have further reduced the migration and the size and robustness of the butterflies originating from that region. Reports of “small” monarchs occur with some frequency during droughts in the Midwest.

First sightings

While first sightings posted to Journey North tend to be urban and suburban centric and can be limited by the number of people willing to report sightings, they appear to tell us two things that are relevant here. First, low numbers, well below the recent average numbers of sightings, as in 2013, tell us that population growth can be limited by the number of returning monarchs. This record also tells us that there is no obvious association between the size of the overwintering population and the number of first sightings. For example, while the overwintering population of 2012 (1.19 hectares) led to 322 first sightings in 2013, the lower population of 2013 (0.67 hectares) accounted for 521 first sightings in 2014. Similarly, the larger population of 2014 (1.13 hectares) produced only 547 first sightings. Sorting out the human factor from the dynamics that produce the numbers of monarchs moving north in March and later in May will be a challenge. In the meantime, the low number returning in 2013 gives rise to several questions about the fitness of the cohort of monarchs that arrived at the overwintering sites in the fall of 2012. We know that most monarchs originate from the Upper Midwest and that the region experienced a semi-drought that summer along with the highest temperatures in the record for that region from 1994 to present. The tagging record for 2012 indicated that numbers tagged that fall were among the lowest we’ve recorded for the Upper Midwest. Therefore, it’s possible that the last generation monarchs were less fit due to lower fat reserves, or size, to survive the migration, the winter period and the migration northward the following spring. High levels of mortality during the migration northward from the colony sites to Texas could also account for the low number of first sightings in the spring of 2013.

Additional considerations

There are a few more things to say about 2012 and 2013 that are not apparent from the above data. The first sightings data show that the return migration for 2012 was the earliest in the record with large numbers of overwintered monarchs advancing beyond 40N in late April and the first 10 days of May. In contrast, due to late arrivals and cool conditions in May of 2013, the movement of first-generation monarchs beyond 40N was predominantly at the end of May. These two back-to-back years demonstrated that overwintering and first-generation monarchs can advance both too early and too late into the summer breeding area for optimal population development. If too early, females lay eggs at more northerly latitudes with cooler, sometimes freezing, temperatures that delay age to first reproduction. Such delays have the effect of reducing the reproductive success of the returning cohort that overwintered in Mexico. Late recolonization also negatively affects population growth in that it shortens the breeding season.

This analysis suggests that it is extremely difficult, maybe impossible, for a population to recover from a poor start in a 6.5-month breeding season that involves 3, and more rarely 4, generations. Of course, this depends on the definition of a poor start, and in this case, I’m thinking of the poor starts in 2004, 2012, 2013. There may have been carry-over effects from the droughts of 2002 and 2012 that had an impact on the populations the following years. The population that developed in 2012, following the drought of 2011 also declined, but that decline may have been due as much to conditions in March and August as to the condition of the butterflies surviving from the previous winter.

This example shows that the decline and recovery of a population can be explained IF measures can be identified that have a broad geographic impact on a population at a particular stage. Negative events can have a ripple effect from one stage to another and can carry over from one year to the next. Further, a series of negative events can cause a population to spiral downward rapidly. Is it possible that the downward trends in the Western monarch population from 2016-2020 were the result of a similar series of negative events? Yes, that’s possible.

The crash in the population numbers in 2013, together with what appeared to be a long-term decline that included other years with alarmingly low numbers (2009-2010 – 1.92 and 2012-2013 – 1.19) led to the petition filed in August 2014 to declare the monarch a threatened species. This petition was preceded by an invitation from the White House to a stake-holders meeting at the Eisenhower Office Building in April 2014. Attendees represented a broad array of organizations interested in monarch and pollinator conservation. A bit later, on the 20th of June 2014, President Obama issued a memorandum requesting that all Federal Agencies with some control of landscapes become engaged with monarch and pollinator conservation. Given the prospect that a small overwintering population would be extremely vulnerable to catastrophic overwintering mortality that could reduce the numbers to levels that would threaten the very existence of the monarch migration, these responses were not unreasonable at the time. The U.S. Geological Survey, the lead research agency of US government, took the lead in convening meetings to examine the monarch situation. These meetings were populated with monarch biologists and appropriate expert personnel from federal agencies. A number of publications resulted from these meetings, the most cited of which is “The all hands-on-deck” paper (Thogmartin, et al, 2017). The analysis therein indicates that an overwintering population of 6 hectares is required for monarchs to be able to rebound from known adverse weather or other events. The analysis also points out that to achieve a population of this size will require the restoration of 1.8 billion milkweed stems. While there are many restoration efforts under way, it’s not clear whether these efforts are sufficient to offset the 2 million or more acres of potential monarch habitat that are converted to croplands and lost to development each year.

The low overwintering numbers of 2013-2014 led me to ask whether monarch numbers had been this low or lower in the past. Yes, that is likely, but there is no data on this subject. What we can do is look at past climates. Those records show that monarchs have experienced far greater extremes in the past than anything seen since 1994. We can only speculate about the impact of these events on monarch numbers, but it seems likely monarchs declined to extremely low levels several times in the last 125 years. And before that was the “little-ice-age”, a much colder period with erratic shifts in climate from 1300 to 1850. While monarchs clearly survived numerous extremes through the centuries, they now face new threats posed by climate change such as severe winter storms, high temperatures and droughts in all portions of the breeding season and even the migration. Those impacts can already be seen in California.

Table 1. Temperature means, first sightings and NDVI records for 2011-2015.

20112012201320142015
Overwinter hectares/prev season4.022.891.190.671.13
First sightings
1 March–30 April
241255129201203
March mean temp TX+5.4+6.8+0.9-1.6-0.2
May mean temp 40N UM-0.2+4.8+0.2+0.5+1.3
First sightings >40 N
1 May–9 Jun
362408193320344
June–August mean temp
Upper Midwest
+2+3+0.3-0.5-0.3
September mean temp
Upper Midwest
-0.5-0.1+3.3+0.5+6.4
October mean temp
South Region
0-1.3+0.1+2.9+2.6
Total first sightings603663322521547
NDVI0.4620.4940.5360.5420.533

REFERENCES

Wayne E Thogmartin, Laura López-Hoffman, Jason Rohweder, Jay Diffendorfer, Ryan Drum, Darius Semmens, Scott Black, Iris Caldwell, Donita Cotter, Pauline Drobney, Laura L Jackson, Michael Gale, Doug Helmers, Steve Hilburger, Elizabeth Howard, Karen Oberhauser, John Pleasants, Brice Semmens, Orley Taylor, Patrick Ward, Jake F Weltzin and Ruscena Wiederholt. (2017). Restoring monarch butterfly habitat in the Midwestern US: ‘all hands on deck’. Environmental Research Letters, Volume 12, Number 7 074005 https://iopscience.iop.org/article/10.1088/1748-9326/aa7637

Filed under Monarch Biology | Comments Off on Monarch population crash in 2013

Monarchs and the freeze in Texas

1 June 2021 | Author: Chip Taylor

by Chip Taylor, Director, Monarch Watch; Carol Clark, Monarch Watch Conservation Specialist; and Janis Lentz, Volunteer

The following is a long report about the impact of the freeze in February 2021 on the development of this year’s monarch population. If you are into monarch biology and monitoring, this report is worth a read. In addition to observations on monarch biology, we compare iNaturalist and Journey North records over several years. There are interesting similarities and differences in these records and from year to year.

INTRODUCTION

As most of you know, I make an effort to follow the monarch population as closely as possible every month of the year. Thus, it was with some alarm that I read about the period of freezing weather in Texas in mid-February. I was alarmed because it was clear that the freeze killed most of the vegetation then in leaf over a broad area of Texas and northern Mexico. This realization gave rise to the possibility that monarchs returning from Mexico in mid-March would find little or no milkweed to lay eggs on or flowers in bloom with nectar to sustain them. These concerns led me to post several notes to Dplex-L, our email discussion list, proposing to monitor the recovery of the vegetation coincident with the arrival and behavior of monarchs throughout the month of March. I was obviously fumbling for a way to conduct such a survey when John Barr posted the suggestion that iNaturalist (iNat) might be able to provide the platform and the number of observers throughout Texas needed to monitor the development of milkweeds and determine the nectar sources used by monarchs. I was unfamiliar with iNat, but could see the potential this photo-based reporting system had for providing the information I was seeking. Subsequently, with the help of John Barr, Carol Clark and several others, we created a list of potential floral sources returning monarchs might visit for nectar. We also created a text which outlined our objectives and launched the project with the assistance of Tania Homayoun, of the Texas Parks and Wildlife Department, on the 2nd of March.

The following narrative starts with an abbreviated version of the project outline posted to iNat and then moves on to a summary of the results and shows how these records compare with those of previous years. The text ends with a discussion of the strengths and limitations of this means of monitoring the monarch population along with a number of suggestions as to how the data generated from this project could be mined to gain further information on floral usage by monarchs and how weather factors influence monarch behavior.

Texas Winter Storm 2021 Plant & Pollinator Survey

“The February freeze damaged vegetation across Texas. We’d like your help tracking the recovery of plants that flower in March along with milkweeds. Both are resources used by monarchs returning from Mexico in mid-March and their availability will determine how well the monarch population develops in 2021.

The 11-day cold spell (10-20 February) in Texas was a disaster (see Maeckle, 2021, Severson, 2021 and Texas Parks and Wildlife, 2021). Freezing temperatures covered the state and extended well into northern Mexico. While many of the immediate effects of the freeze are clear, season-long and multiple-year effects may linger. The damage to the flora was extraordinary, and it is likely that nearly all above-ground insects died over a wide area. Plants already in flower may have been so damaged as to not flower this year. We are seeking help to record that damage and the recovery of plants that flower in March along with the appearance of milkweed shoots and buds. Both are resources used by monarchs returning from Mexico in mid-March. We also need help recording the number of returning monarchs. ALL monarch observations are of value. How well the monarch population will develop in 2021 will be determined by the March conditions in Texas.

Since we know the freeze ended on the 21st of February, that becomes day 1 when assessing plant development. We can determine the number of days after the freeze that it took for a species to recover. Those dates can be compared to the long-term peak flowering for a species to determine if flowering was delayed. Monarchs generally reach the milkweed-rich areas of Texas around 12-15 March and the question that follows is: Will arriving monarchs encounter milkweeds and nectar plants in sufficient abundance, or will they encounter a landscape still too deep in recovery to provide the needed resources to establish the next monarch generation?”

Simply stated, the main goal of the project was to determine how well the arrival of monarchs returning from Mexico matched up with the regrowth of milkweeds and the appearance of nectar sources. The initial assumption was that a lack of both nectar and milkweeds would result in shorter life-spans for the monarchs and reduced egg laying, resulting in a negative impact on the growth of the population in 2021.

METHODS

The methods involved tracking the postings to iNat of monarchs and emerging milkweeds through March. The numbers of monarch reports were compared to those reported to Journey North (JN) on the same days.

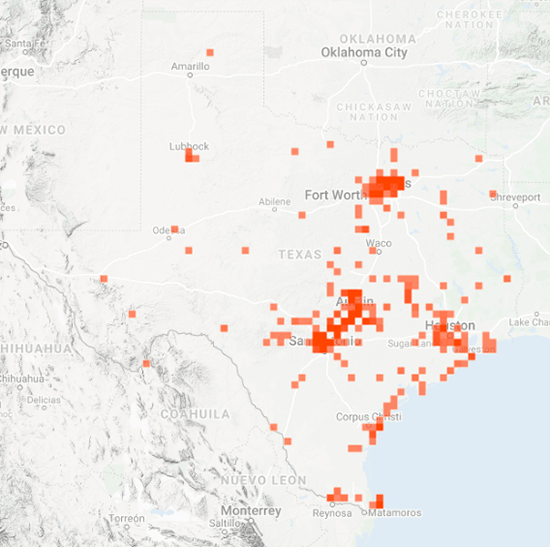
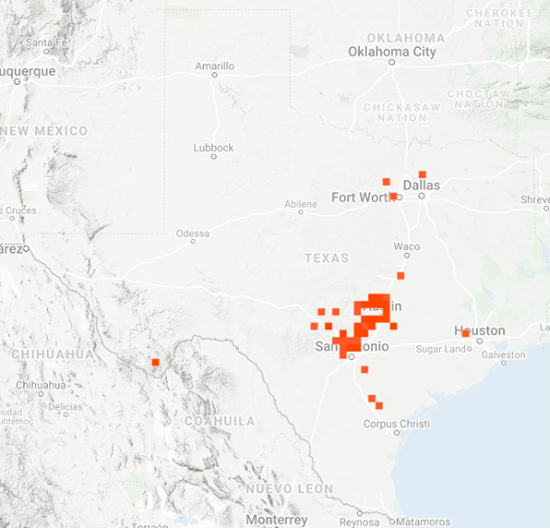
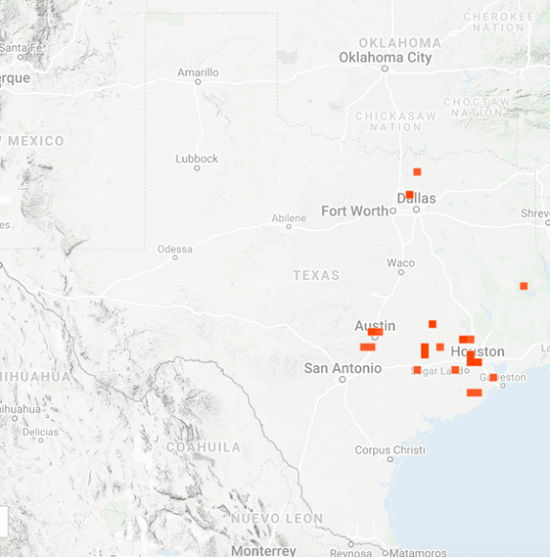
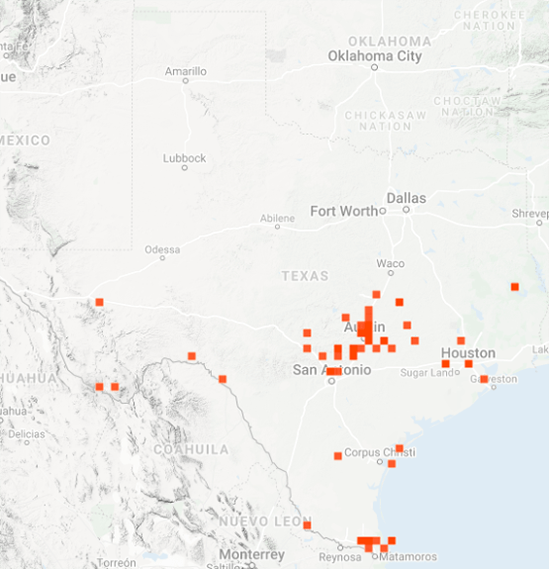
The results consist of photographic records posted to iNat of monarchs and the three common milkweed hosts for monarch larvae – antelope-horn (Asclepias asperula), green antelope-horn (A. viridis) and zizotes (A. oenotheroides) milkweeds. The distributions of the monarch and milkweed locations reported for March 2021 are shown in Figures 1-4.

Since 12% of the monarch images were of butterflies feeding on the nectar of various flower species in 2021, it was possible for CC to create a list of plants monarchs used as nectar sources throughout the month. CC also scanned iNat images for nectaring by monarchs in March 2020 (13% of images) and March 2018 (45% of images). A list of these plants visited in 2021 is shown in Table 1. A separate article for the Blog includes the plants monarchs were observed feeding on in March 2020 and 2018.

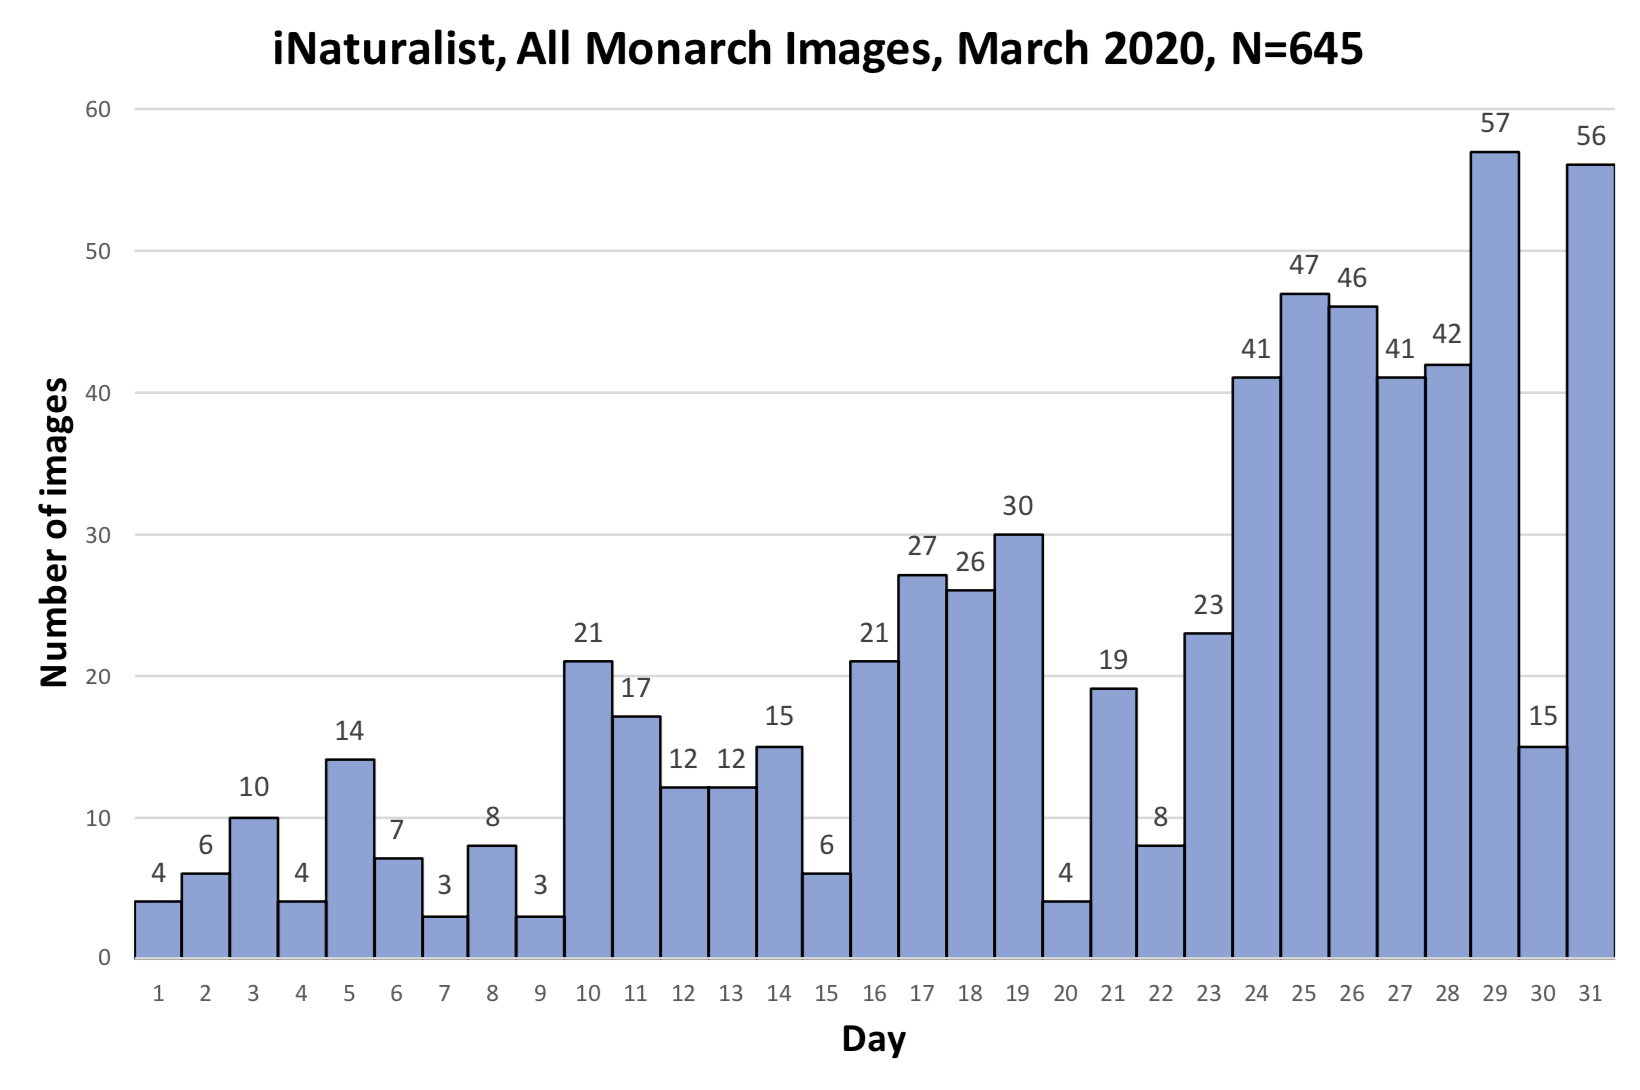
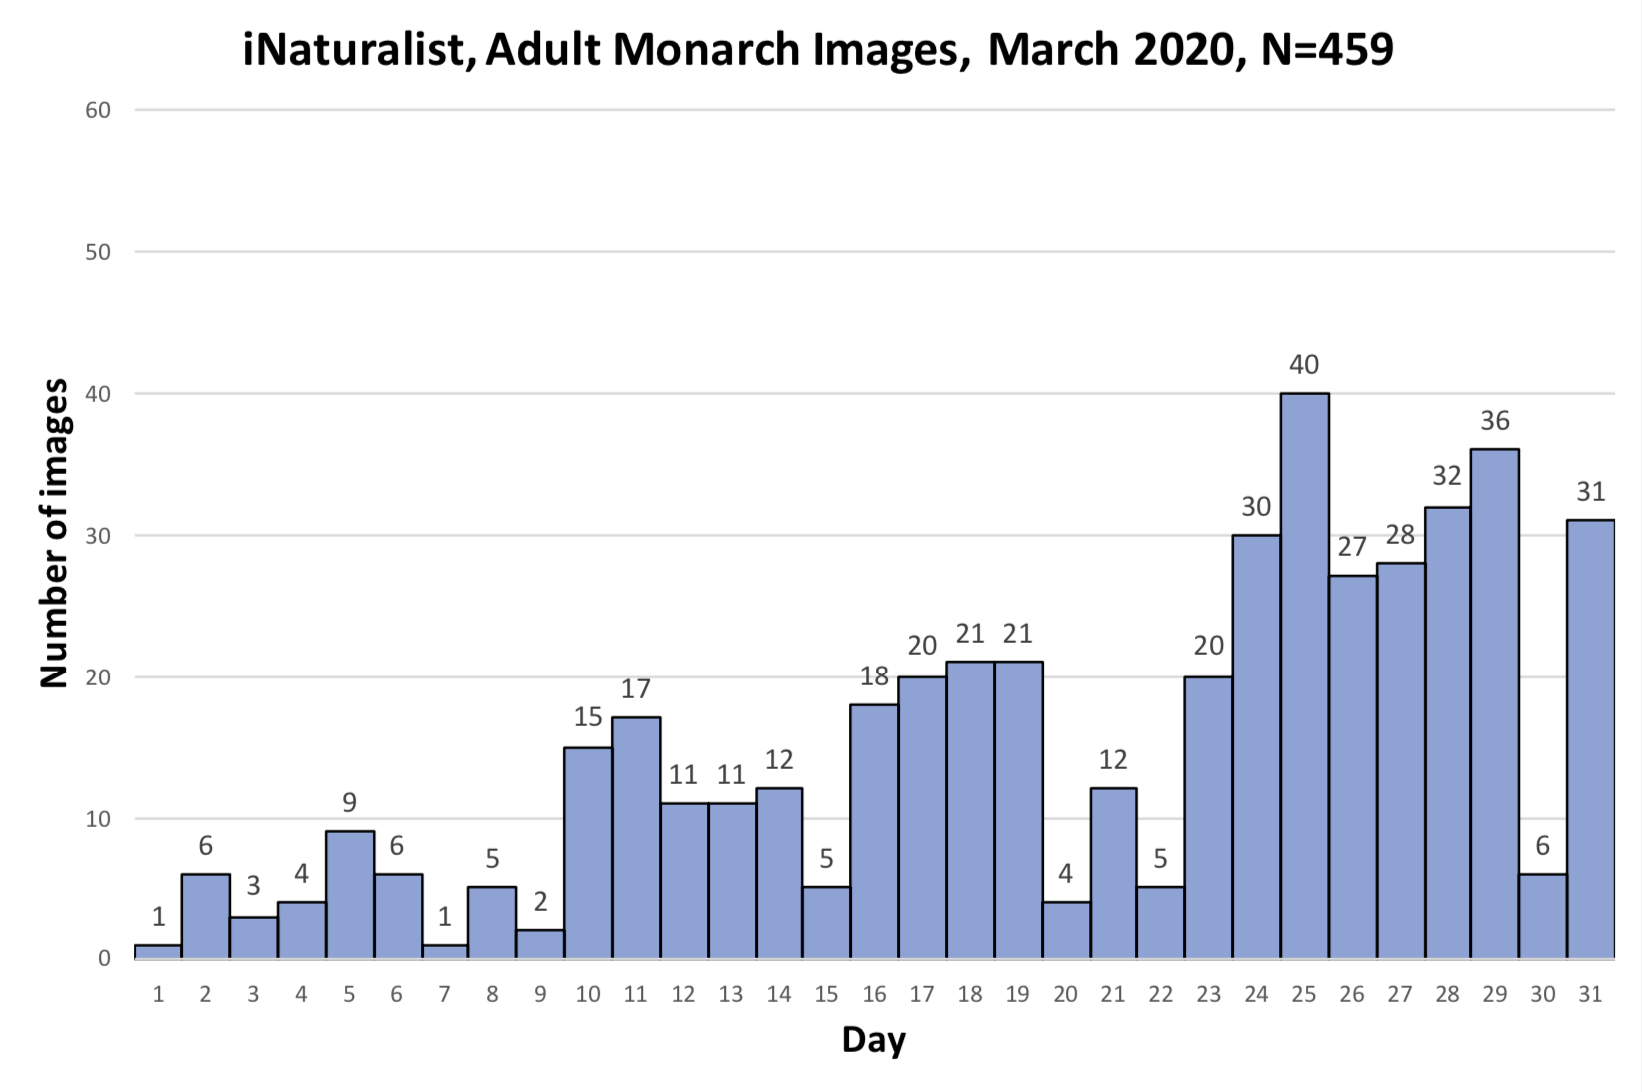
To provide a larger context for the observations of monarchs recorded in 2021, the numbers of monarchs reported to iNat for 2020 were also tallied, and the numbers of adult monarchs for each year were then compared with the number of first sightings reported to JN for both years.

RESULTS

The complete record of all images posted for March can be found on the iNat project page at inaturalist.org/projects/texas-winter-storm-2021-plant-pollinator-survey?tab=species.

Comparison of iNaturalist and Journey North first sightings
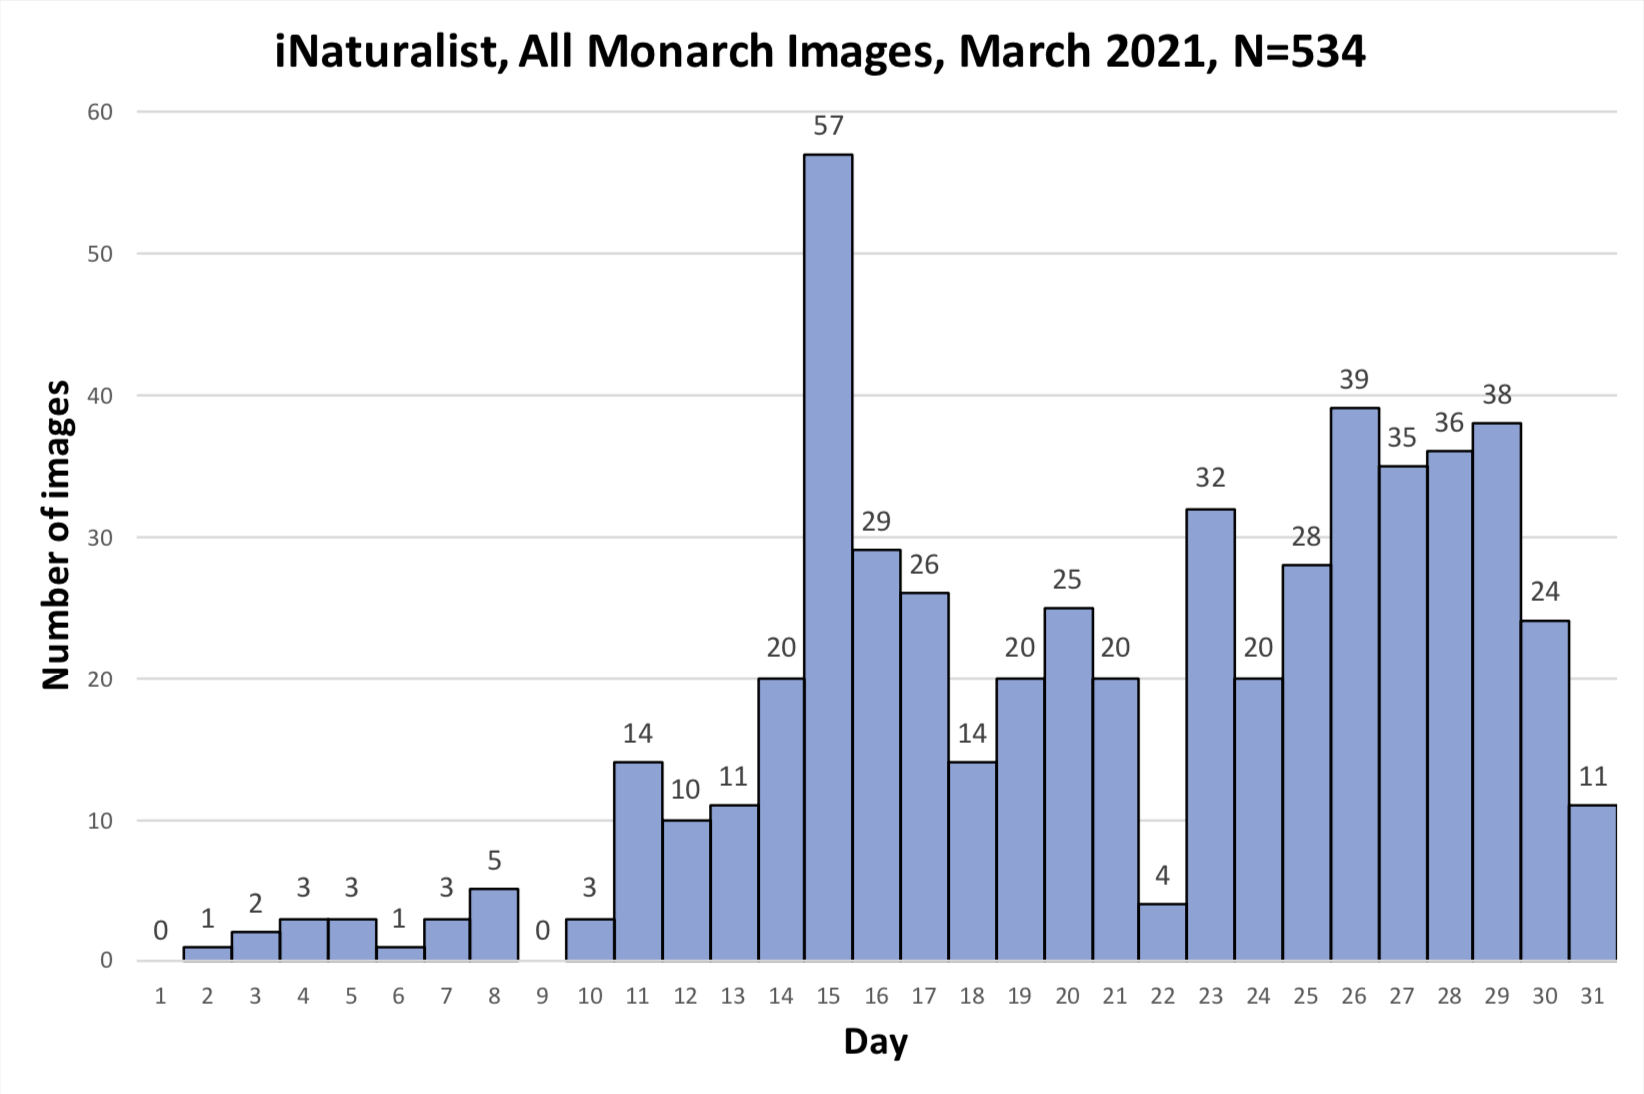
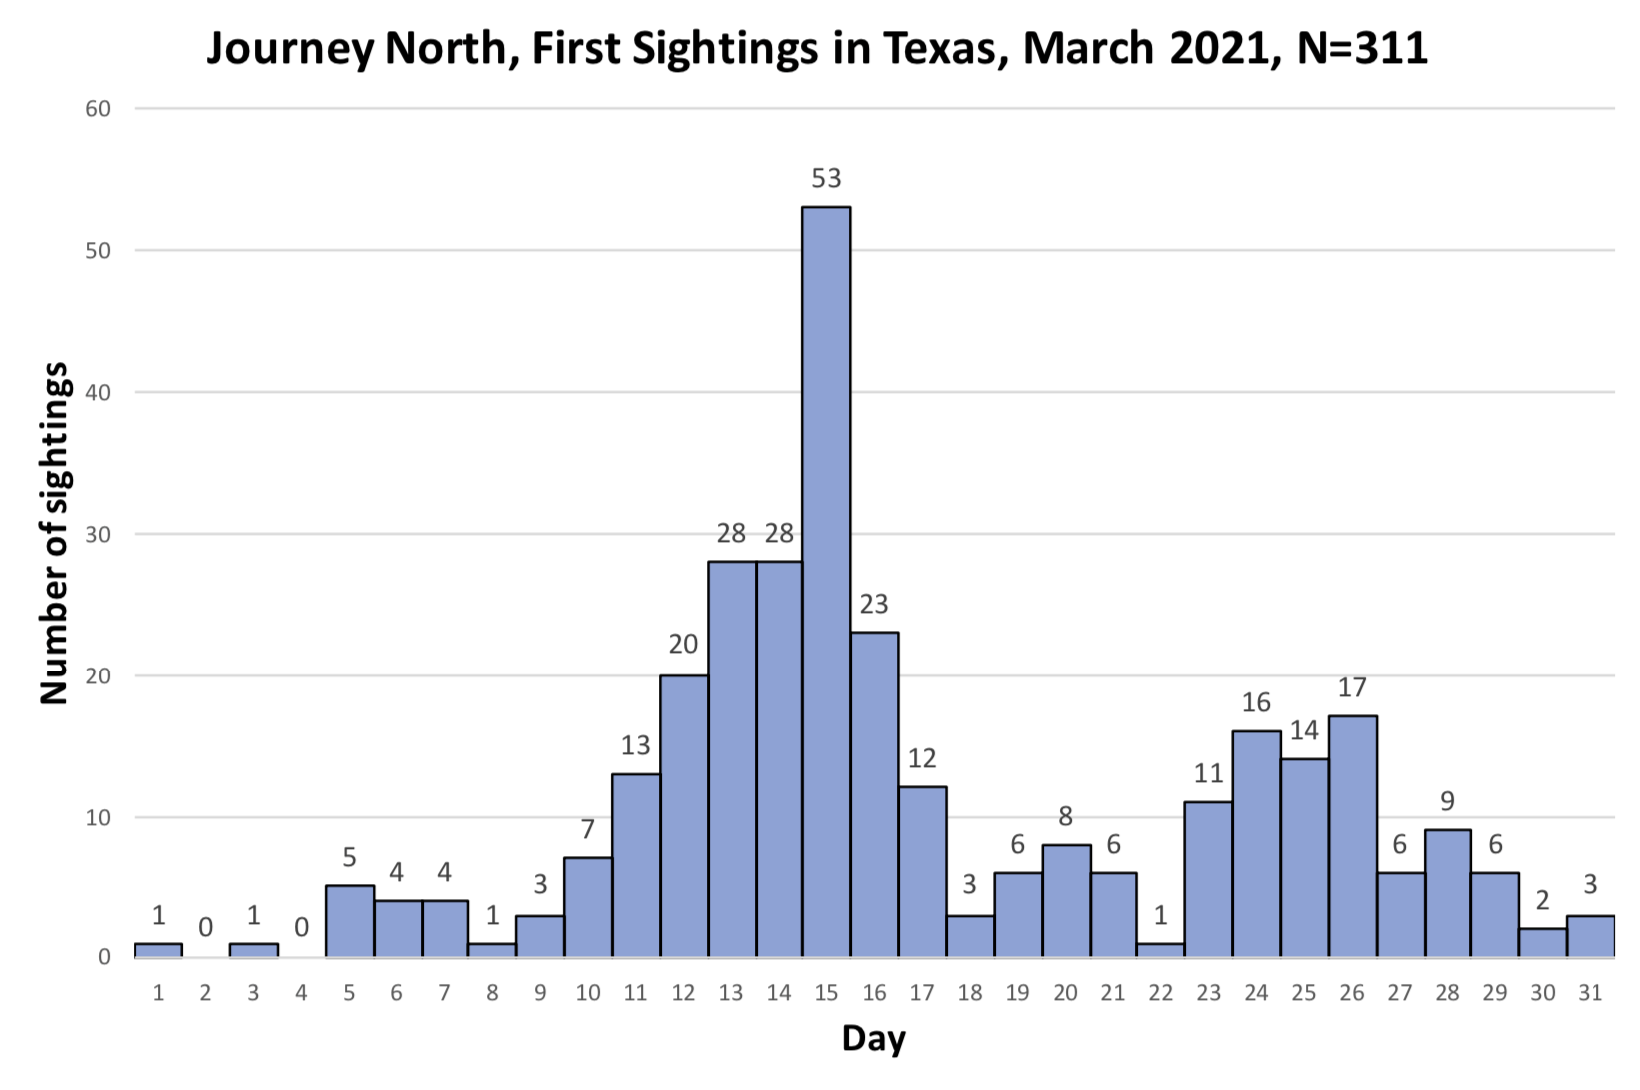
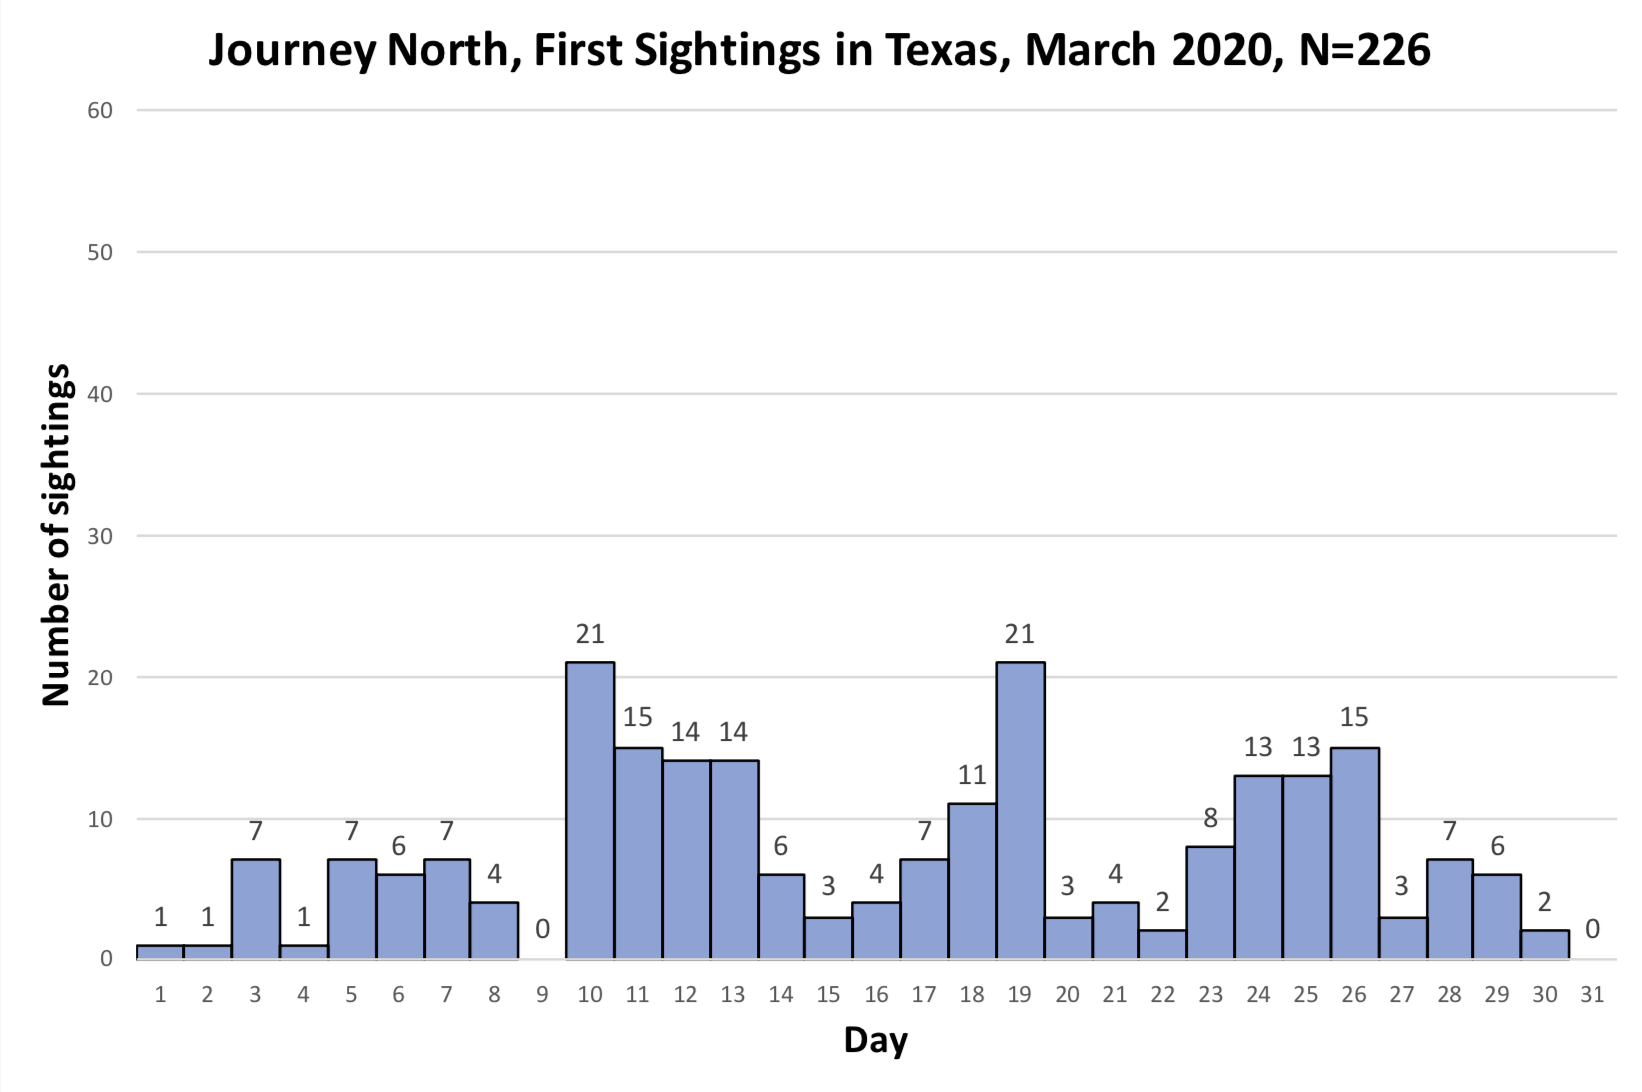
The first set of summaries includes all monarchs recorded for iNat and JN for 2021 as well as the first sightings reported for Texas to JN for 2020 (Figs. 5-7). First, the number of records for iNat in 2021 exceeded those reported to JN by a significant margin (534 vs 311). The 311 for JN for Texas in March actually exceeded the previous high number which was the 226 recorded in 2020. A second feature for the 2021 data is the parallel numbers, with JN being slightly ahead from 1-17 March. Thereafter, the reports to iNat continue at a high level while those of JN are relatively lower. This result may indicate that the number of people willing to report to JN has become saturated as discussed below. If so, then the numbers of monarchs on the move, mostly in North Texas, in late March are underrepresented. A third thing to notice is the human-centric distribution of the reports with the biggest numbers associated with the major human concentrations, first in the vicinity of San Antonio and Austin and then Houston followed by the greater Dallas area. You can also see the effect of a cool, cloudy day (22 March) in both records.

Taking all three records together, it’s apparent that there was an abrupt increase in observations on the 10th of March. A comparison of the number of sightings before the 10th in 2020 vs 2021 may say something about the impact of the freeze on monarchs already in Texas before the arrival of monarchs from Mexico. In 2020, a year without a freeze, 34 sightings were reported before the 10th (15% of 226) while in 2021 there were 19 in the JN record (6% of 311) and 18 in the iNat data (3% of 534). While the 2021 iNat images did indicate that some monarchs, judging by their fresh appearance, had survived the freeze, the number was low.

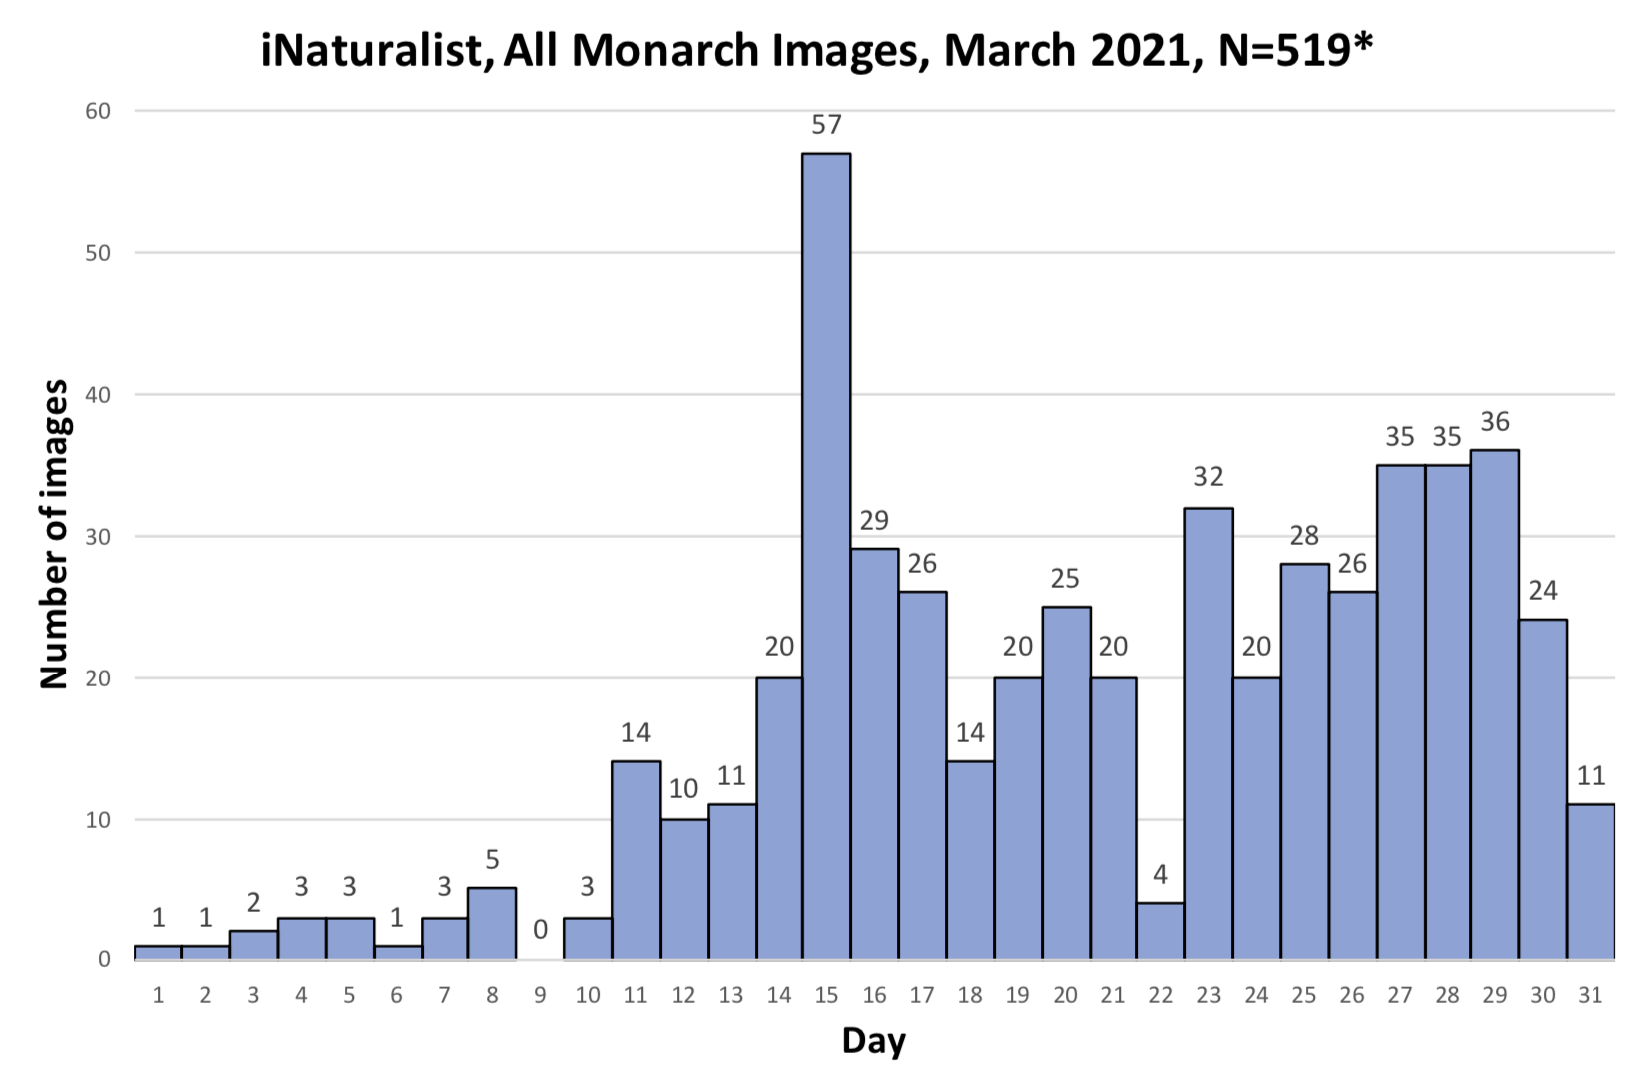
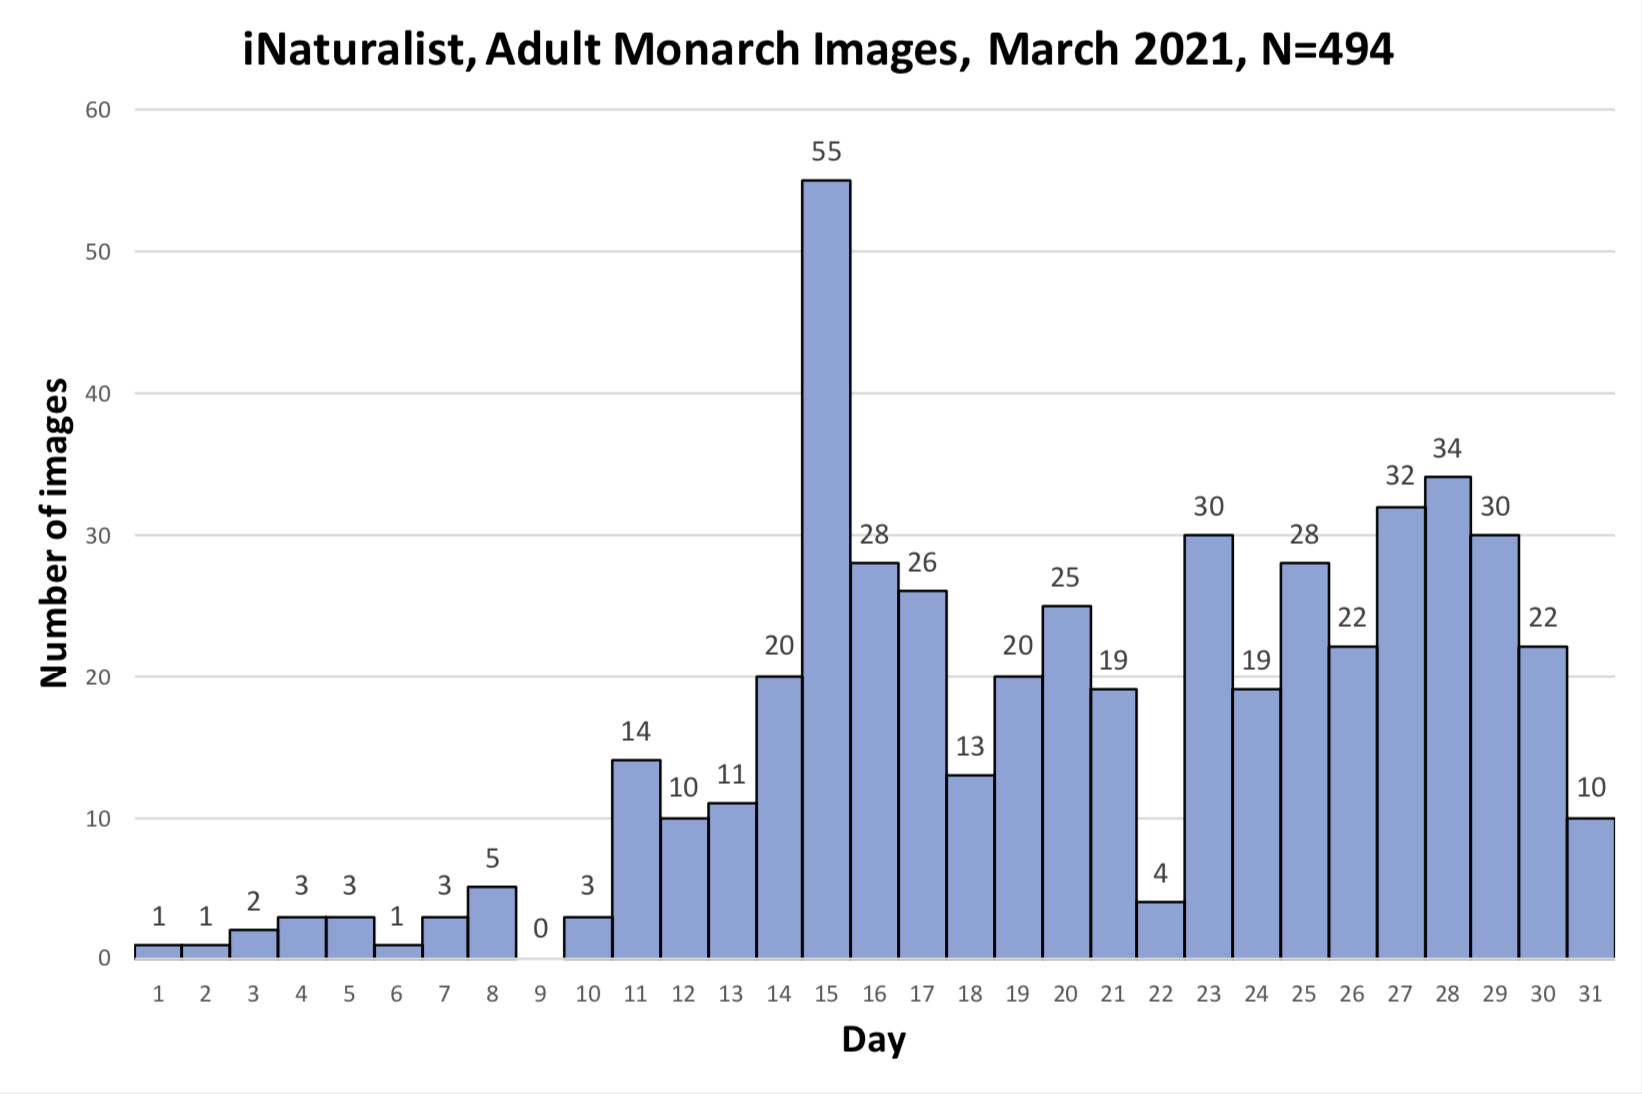
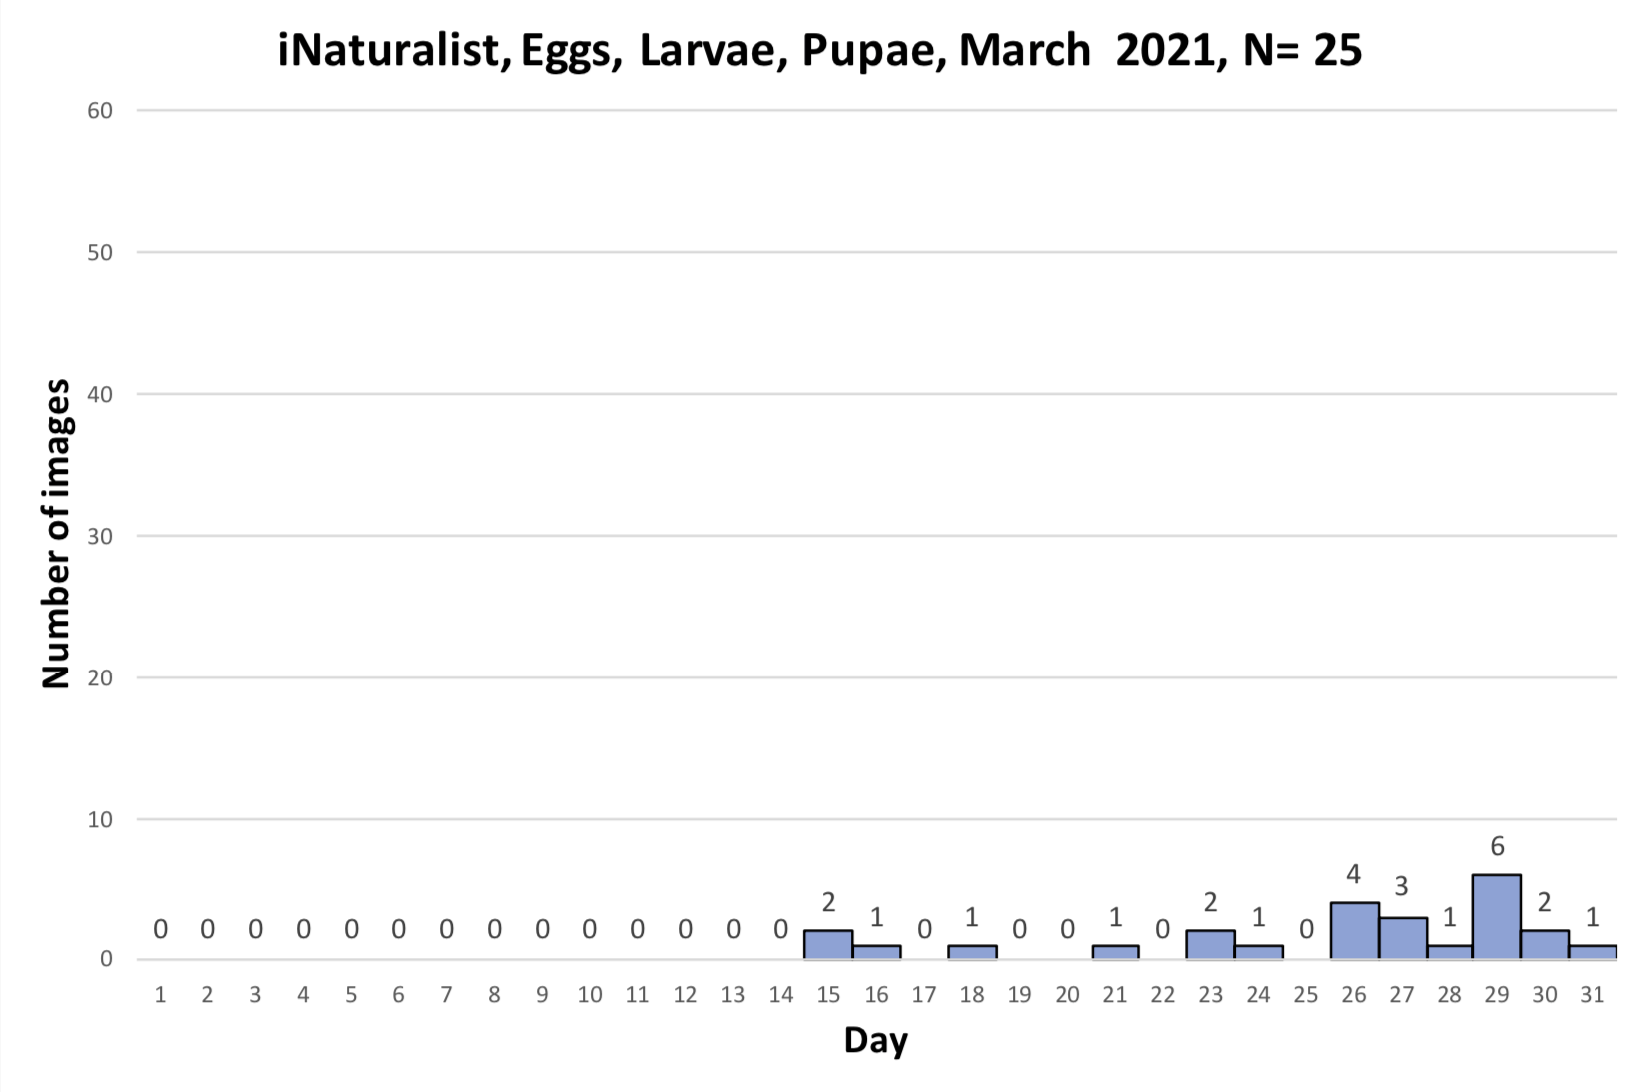
The iNat monarch numbers for 2021 and 2020 are summarized in three histograms for each year (Figs. 8-13). On the assumption that all images, whether they represented eggs, larvae, pupae or adults represented a monarch at one time or another, the first histogram includes all records. To make comparisons with the first sightings reported to JN, a second set of histograms included only adult monarchs. The third set showed the distribution through March of the reports of immatures.

Recolonization of Texas by monarchs migrating north from Mexico

The numbers of records posted to iNat and JN for both 2020 and 2021 (Figs. 5-7) show a strong increase in reports starting on the 10th of March each year. This increase in reports continued in both iNat and JN in 2021 until the 18th and then declined as monarchs advanced beyond San Antonio and Austin only to increase again after the 22nd when monarchs reached the more densely populated areas in North Texas.

Monarchs enter Texas through via two routes, one a pathway into the Edwards Plateau west of San Antonio through Del Rio, Texas, and Uvalde, and the other along the coast from Brownsville to Houston. The latter route is represented by numerous images posted to iNat and a number of JN sightings. The western route is less well represented by reports to either program. The low number is likely due to the lower human density along that pathway. The number of reports in the Rio Grande Valley, the region between the two pathways, is usually low in both the spring and the fall due to the higher temperatures in that region. Monarchs appear to prefer routes with lower temperatures.

Milkweeds
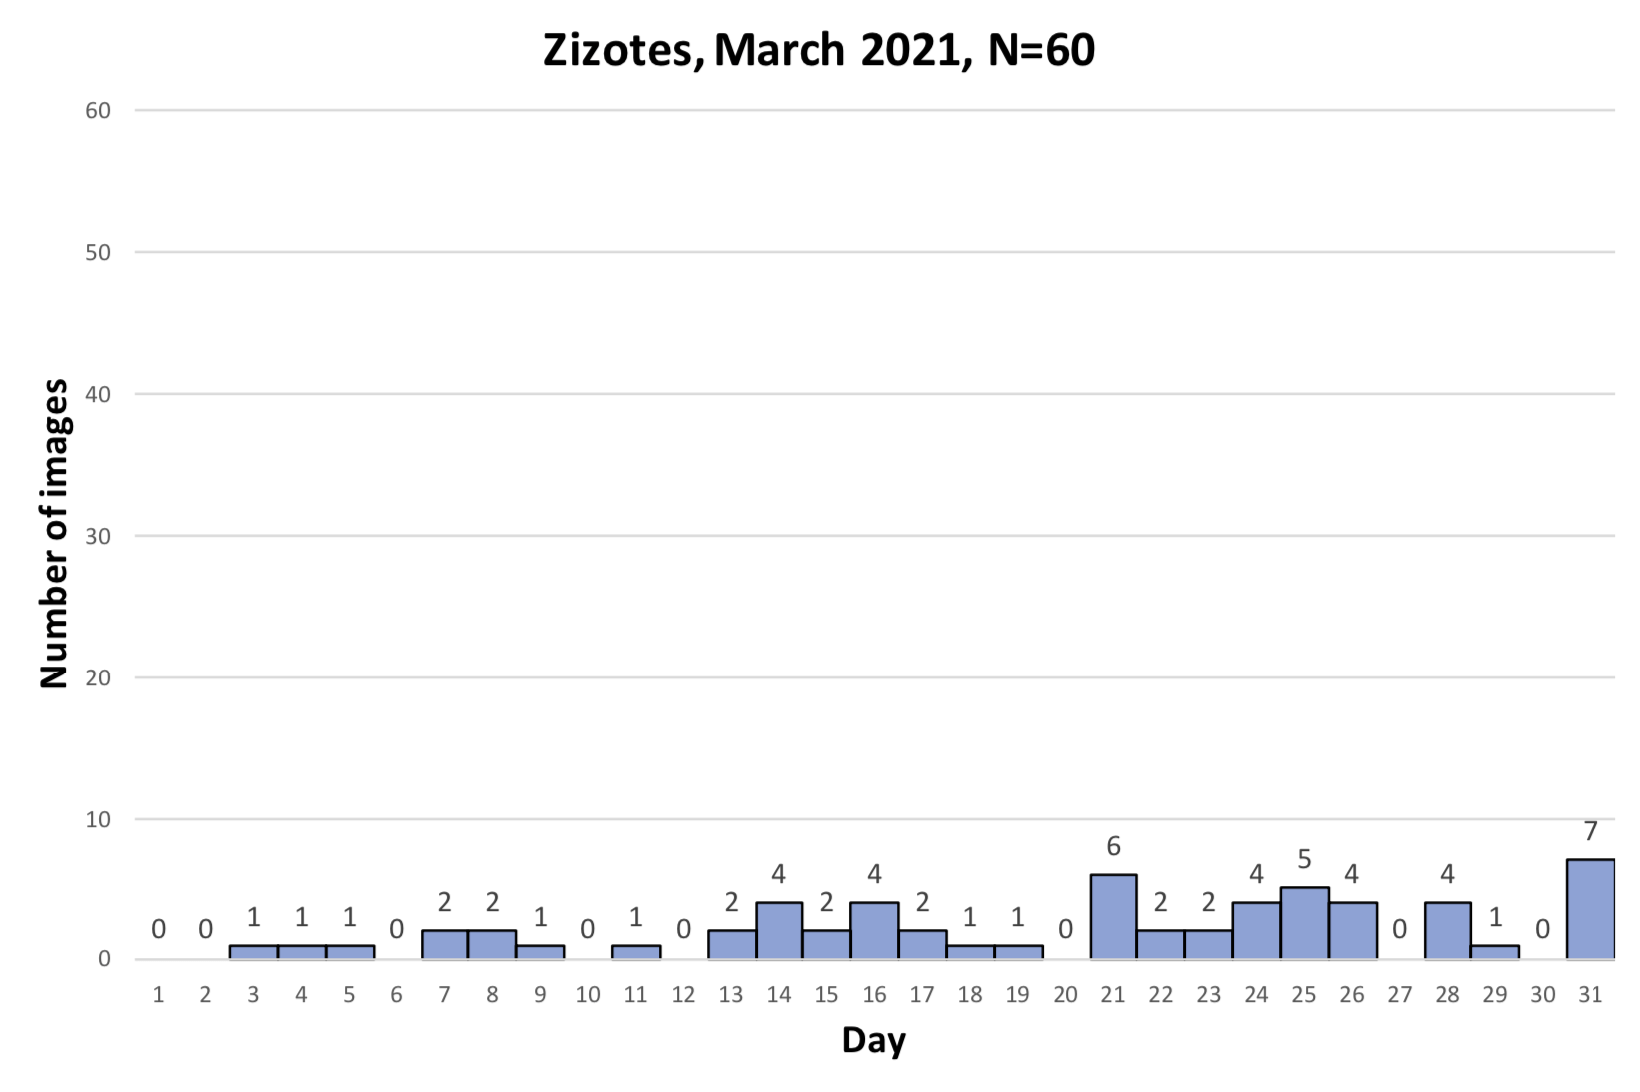
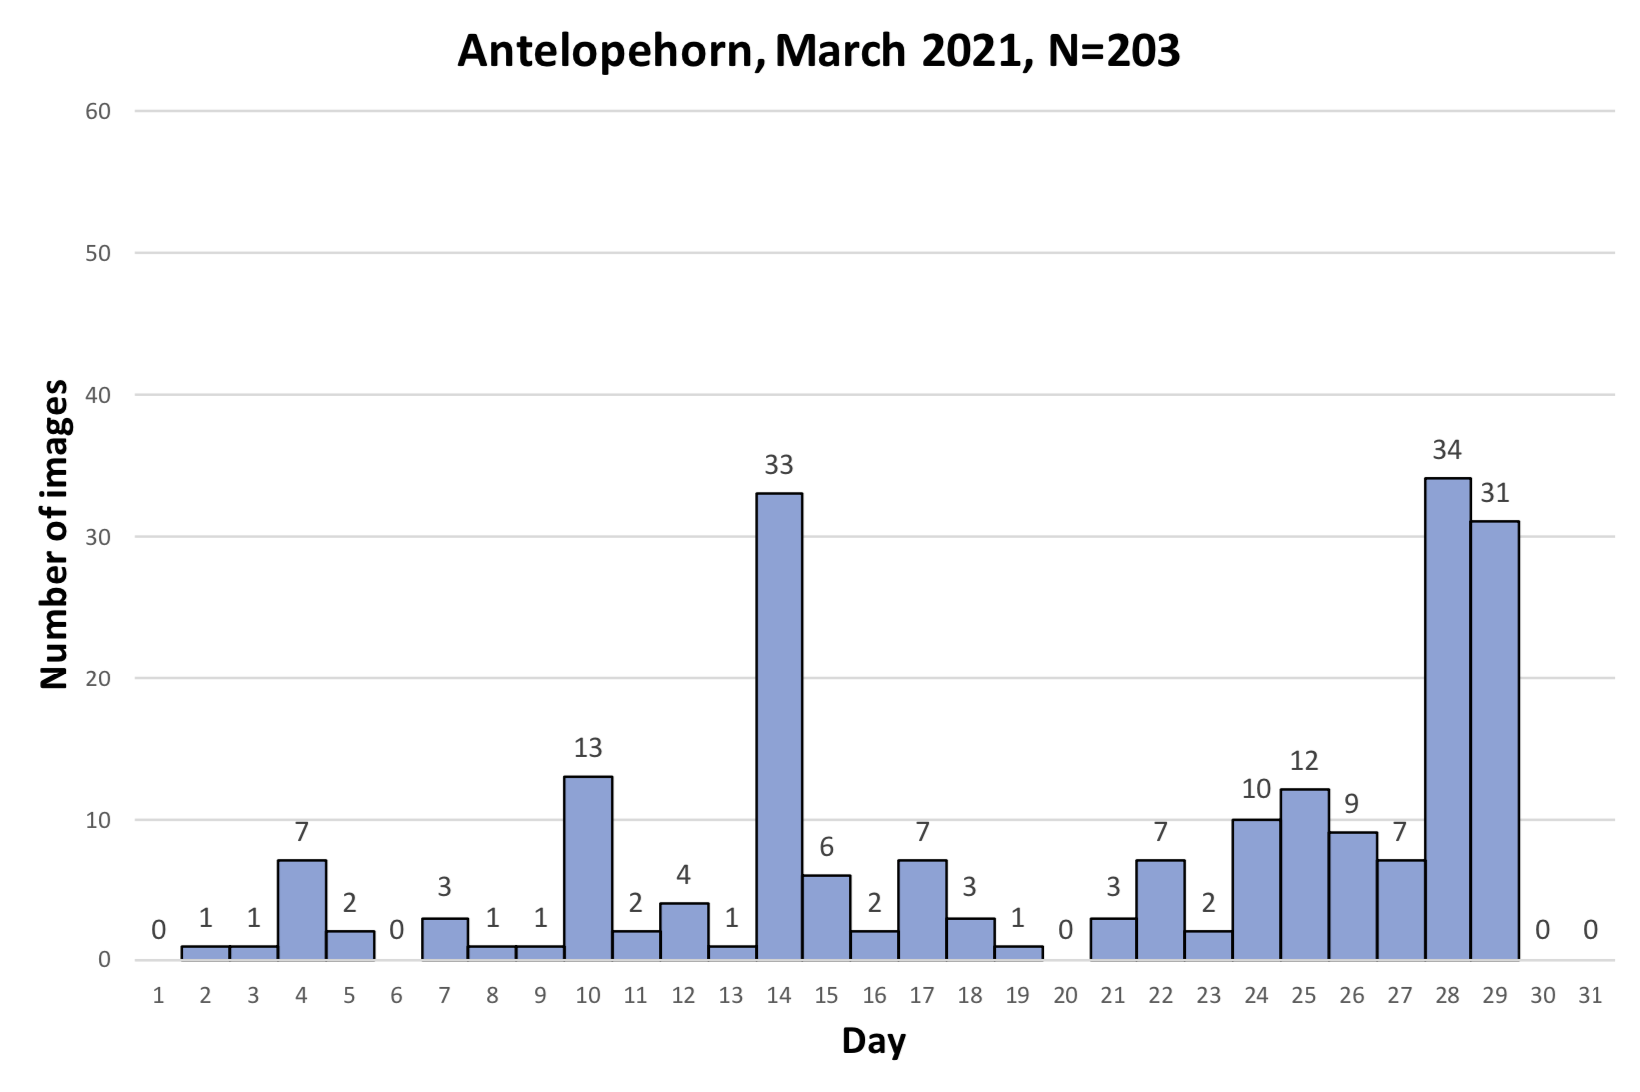
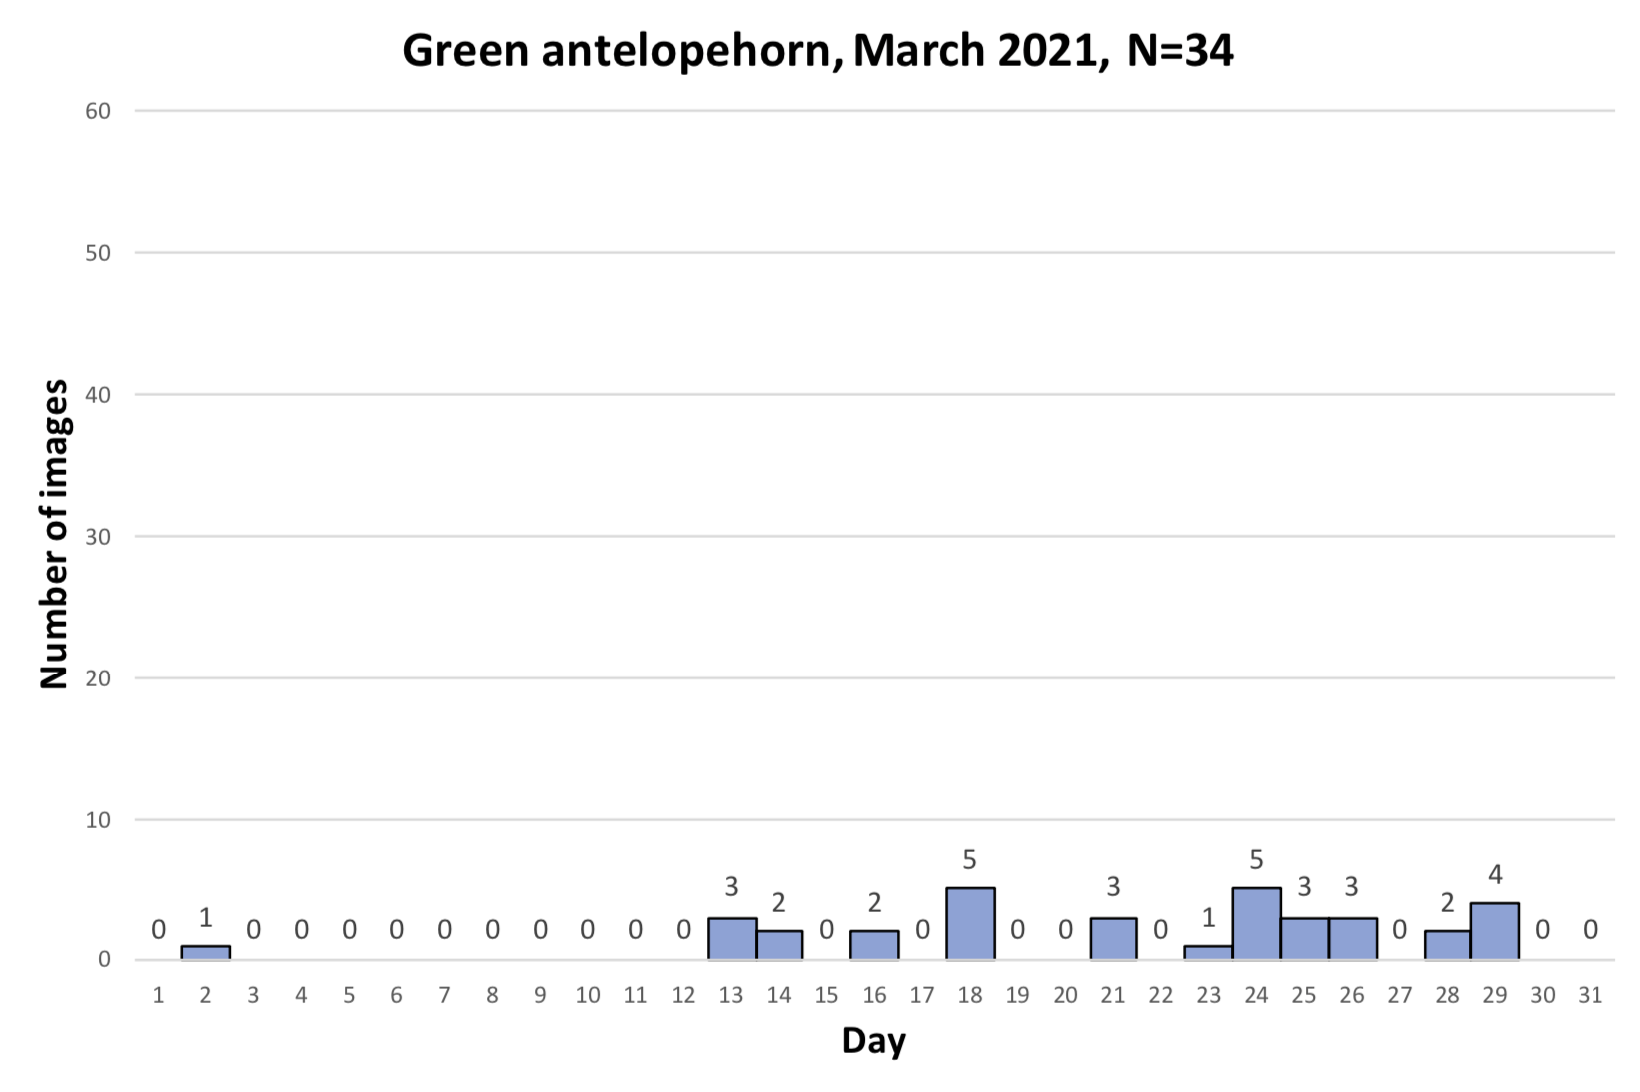
The geographic distributions of the three milkweed species based on the submitted photos are shown in Figures 2-4. The distributions of these reports through the month are shown in Figures 14-16. These figures, though based on limited data, demonstrate that zizotes (N=60), the species with the most southerly concentration, was the first to appear after the frost. The occurrence of antelope-horn milkweeds (N=203) followed with a distribution that was generally in the Edwards Plateau west of San Antonio and Austin. Last to appear was the green antelope-horn (N=34). This milkweed is the most abundant and widespread of the three major milkweed hosts used by monarchs in Texas. The low number of sightings for this species apparently lies with the distribution of people willing to report milkweeds to iNat. Green antelope-horn is the dominant milkweed in the vast area east of I-35, an area of ranches, some cropland and relatively few people. This result again demonstrates how dependent monitoring of this type is on the distribution of people.

Immatures
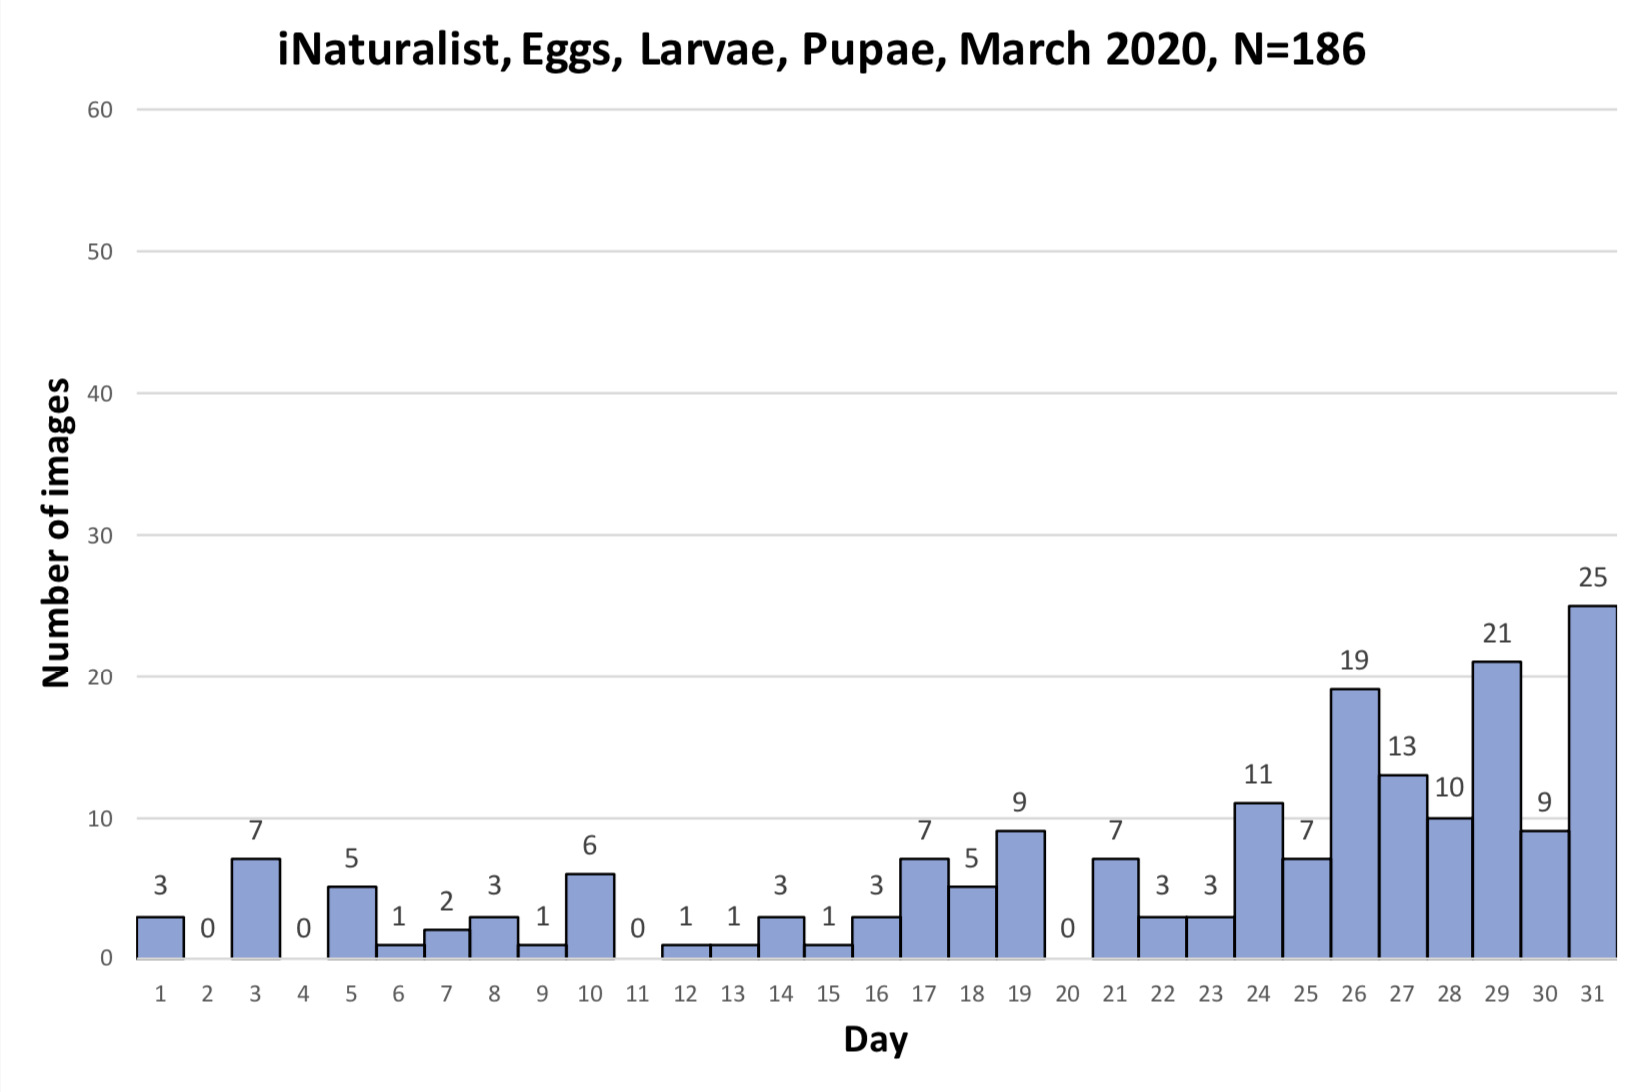
Perhaps the starkest contrast between the iNat numbers for 2020 and 2021 was the number of images of immatures (eggs, larvae and pupae) in the 2020 data (N=186, 29% of all observations) and 2021 (N=25, 5% of all observations). Further, immatures were reported throughout the month of March in 2020 (Fig. 13) but only in the second half of March in 2021 (Fig. 10). Since, the dates of arrival of monarchs in Texas were similar for both years, the contrast between the two years in the distribution of immatures may have been due to a breeding population of monarchs (offspring of overwintered monarchs) in 2020 as well as the delay in the emergence of milkweeds due to the freeze in 2021.

Nectar sources
Visual scans of the iNat images by CC for examples of monarchs nectaring at flowers produced a list of 69 species in 2021, 85 in 2020 and 41 in 2018 for a total of 123 species. Of these, only 20 were visited in all three years, while 30 of those used in 2021 were not visited in either of the other two years. Further, species used in the other two years, were either not present in 2021 or were not seen to be used by monarchs. A list of the 2021 plants is shown in Table 1.

DISCUSSION

This project was based on the concern that milkweeds and nectar sources would not be available to monarchs returning from Mexico in mid-March due to the devastating impact of the 10-20 Feb freeze experienced over much of Texas. These concerns center on three main questions: 1) would monarchs get ahead of emerging milkweeds, 2) would nectar sources be lacking and 3) would the development of the first generation be hindered due to the impact of the freeze?

While it seemed clear that some monarchs advanced northward faster than milkweeds emerged, with a number even moving into Oklahoma much too early, the numbers that advanced relative to the total number of monarchs moving into Texas was not clear. Temperatures were moderate through most of the month which may have allowed many female monarchs to survive to lay eggs once the milkweeds emerged. Subsequent reports of an abundance of eggs and larvae on milkweeds from Central to North Texas, and a delay in the advance of more monarchs into Oklahoma, suggested that most of the eggs laid by returning monarchs were laid in Texas – an outcome that is more favorable than egg laying in more northerly locations where the temperatures are lower and developmental time for immatures is longer. So, the answer to this question seems to be yes, some monarchs did get ahead of the emergence of milkweeds, yet, in spite of the late appearance of milkweeds, most eggs were laid in Texas.

As to the abundance and diversity of nectar sources, monarchs were photographed utilizing flowers of 69 different species. While this number was fewer than in 2020 (N=85), and involved sources seldom used in good years, monarchs appeared to adapt to the new conditions. While we can’t say anything about the distribution and abundance of the nectar sources across Texas in 2021, many of the nectar sources involved species that are widespread and moderately abundant. Of particular interest was the fact that of the 123 species visited by monarchs in our survey of iNat images over a three-year period only 45% (N=55) were native to Texas. This result is a testament to monarch’s adaptability but also says something about the human/urban-suburban distribution of the observers and introduced plants. A more complete analysis of the nectar plant results can be found at monarchwatch.org/blog/2021/05/25/nectar-plants-used-by-monarchs-during-march-in-texas/.

That brings us to the last and most important question. Was the development of the first generation hindered by the conditions created by the freeze? At this writing (late-May), that doesn’t appear to be the case. The number of first sightings reported to JN through 25 May is equal to or greater than the numbers reported for several years with good overwintering numbers. However, to be clear, to make predictions, we need data on the size of the first generation in the form of reports to JN and iNat of monarchs colonizing the latitudes north of 40 N from mid-May to 10 June. If the weather is favorable for recolonization and the numbers are low, that will be an indication that the first generation was affected by the spring conditions in Texas. High numbers recorded through the 10th of June would indicate that the storm had little effect on the development of the first generation. Overall, given the reports of large numbers of eggs and larvae from several Texas locations in April, there is still a reasonable possibility that the overwintering population will increase this year.

There is one more consideration of interest. Will the freeze have an impact on the incidence of O. e. in the 2021 monarch population? As noted earlier, there was a near total lack of “fresh” monarchs seen in the iNat records before 10 March for 2021. These records are in contrast with the record for 2020, 19 vs 34 (Figs. 10,13). Further, there were no eggs and larvae until mid-March in 2021 vs eggs and larvae throughout the month in 2020. The fresh monarchs in 2020 were presumed to be offspring from late winter reproduction that matured on tropical and, more rarely, native milkweeds. Since the freeze in 2021 apparently froze all above ground vegetation including milkweeds and most resident monarchs, these sources of O. e. spores would have been lacking as monarchs returning from Mexico moved into Texas in 2021. In theory, a lower contact with spore-infested plants and spore-carrying adult monarchs could result in a lower incidence of O. e. in the monarch population as the season develops. The assumption made by some observers has been that, in normal years, such as 2020, there is enough contact between spore-infested plants and spore-carrying resident monarchs to increase the incidence of O. e. through the season. The question that follows is: Will the rate of O. e. infected monarchs be lower, the same or higher at the end of the 2021 season?

Strengths and limitations of iNaturalist and Journey North monitoring of monarch numbers

We need monitoring of monarch immatures and adults throughout the year to help us understand monarch population dynamics. Dynamics means we are asking how the monarch numbers are influenced by biological factors such as predators, parasitoids, O. e. and xenobiotics (man-made chemicals) as well as by the variation in the weather throughout each year and from year-to-year. At the same time, we need to define and fully understand the strengths and weaknesses of each monitoring method. With respect to iNat, we need to acknowledge that the process of obtaining the images has inherent biases. First, the very process of taking pictures involves light with most pictures taken when the photographer determines there is enough light for a photo. Then, there are the hours that both monarchs and people overlap in the field. While both monarch and human activity probably have similar peaks in early to mid-afternoon it’s possible that there is less overlap both early and late in the day that could result in missed opportunities to record monarch activities. It may also be the case that monarchs are more active than the iNat participants when the temperatures are in the 60F. Further, it’s clear that the records are human-centric in that they are concentrated around major cities. This means that large areas in the countryside, which are usually slightly cooler and dominated by native rather than introduced vegetation, are seldom visited. There is also a matter of numbers and picture taking in that many monarchs may be seen, but only the ones that sit still long enough to be photographed get to be part of the record.

A strength of the iNat records is that we have time-coded photos, many of which provide information on monarch behavior, nectar feeding and condition of the wings. Further, the iNat observers can post numerous images/records of monarchs through an observation period. The JN first sightings data are also of great value in that they indicate the timing of colonization by monarchs returning from Mexico and later in the spring the migration of their offspring across the latitudes and longitudes to the north and northeast. These data have helped us understand how the population develops each year. However, they have one limitation – they are first sightings only and don’t capture abundance. To fully understand population growth of the monarch population, we need data on both the timing and abundance of monarchs moving in to new areas. As it stands, we have to infer abundance from the number of first sightings posted for a region. That fails when there are too few participants in a region. In effect, this means that the population of observers willing to post to JN becomes saturated. Given this limitation, to assess abundance, we need to use both iNat and JN data, perhaps in combination with other data sets. A close look at the images posted to iNat shows that there are small numbers of duplicate records (2.8% in 2021, Fig. 8). JN vets their sighting data, but there are a few errors in their data set as well. Rather than questioning all records, we ignored them due to their small number.

Future projects

The iNat data could be mined to determine how weather patterns from year-to-year affect flowering plants and monarchs. For example, it would be easy to compare the phenology of the top 10-20 flower species monarchs use and then to compare that with how frequently those flowers are visited by monarchs. This type of phenology matching is being attempted with a number of pollinators. In addition, one could examine how the use of some species is affected by the simultaneous flowering of other species. Since there is a time code associated with each photograph, it should be possible to dig a bit deeper into nectar usage. It is known that some plants only produce nectar once the daytime temperature reaches certain point. That is known to influence honey bee foraging and may well affect butterfly foraging as well. In other words, nectar feeding by monarchs could be determined not just by floral abundance but by the ambient temperature and therefore the time of day. The time codes also offer an opportunity to bracket the range of temperatures at which monarchs operate. The goal would be to not only show the range of temperature, solar and wind conditions that are recorded for a specific activity such as egg laying, mating or migrating, but to identify the optimal conditions for these activities. To make those connections between behavior and weather, we can draw on the proliferation of Tempest weather stations. I will describe how this can be accomplished in another Blog article.

To see the data provided by these weather stations, please visit our Tempest weather station at Monarch Watch via www.wunderground.com/dashboard/pws/KKSLAWRE185

Earlier, we pointed out that because the freeze ended on the 21st of February, that date could be used as a start point to determine the extent to which flowering had been delayed or eliminated in 2021 relative to the flowering of these same species in more typical seasons. We will leave that project to others.

REFERENCES

Maeckle, M., 2 March, 2021. Wildlife death toll mounts in wake of historic Texas freeze. San Antonio Report. sanantonioreport.org/wildlife-death-toll-mounts-in-wake-of-historic-texas-freeze/.

Severson, K., 5 March 2021. Texas Farmers Tally Up the Damage From a Winter Storm ‘Massacre’. N. Y. Times. www.nytimes.com/2021/03/04/dining/texas-farms-storm-damage.html.

Texas Parks and Wildlife, March 10, 2021. At least 3.8 Million Fish Killed by Winter Weather on Texas Coast. tpwd.texas.gov/newsmedia/releases/?req=20210310.

FIGURES AND TABLE

 
distribution map
Figure 1. Monarch distribution as of 6 April 2021 (N=534).

 
distribution map
Figure 2. Antelopehorn milkweed (Asclepias Asperula) distribution as of 6 April 2021 (N=203).

 
distribution map
Figure 3. Green antelopehorn milkweed (Asclepias viridis) distribution as of 6 April 2021 (N=34).

 
distribution map
Figure 4. Zizotes milkweed (Asclepias oenotheroides) distribution as of 6 April 2021 (N=60).

 
histogram
Figure 5.

 
histogram
Figure 6.

 
histogram
Figure 7.


histogram
Figure 8. *Duplicate & questionable records removed.

 
histogram
Figure 9.

 
histogram
Figure 10.

histogram
Figure 11.

 
histogram
Figure 12.

 
histogram
Figure 13.

View larger image of Figures 8-13 as a group.

 
histogram
Figure 14. Images of zizotes milkweeds (Asclepias oenotheroides) submitted to iNaturalist in March 2021.

 
histogram
Figure 15. Images of antelopehorn milkweed (Asclepias asperula) submitted to iNaturalist in March 2021.

 
histogram
Figure 16. Images of green antelopehorn milkweed (Asclepias viridis) submitted to iNaturalist in March 2021.

 
Table 1. Nectar sources visited by monarchs in March 2021.

COMMON NAMESCIENTIFIC NAME
Mexican PlumPrunus Mexicana
Crow Poison/False GarlicNothoscordum bivalve
Dakota Mock VervainGlandularia bipinnfidia (and related species)
Cherry LaurelPrunus caroliniana
Citrus spCitrus spp.
Thicket Plums/Wild Plum (collective)Prunus spp
Redbud,Cercis canadensis, multiple subspecies
DandelionTaraxicum officinale
HenbitLamium amplexicaule
LilacSyringa vulgaris
Bull Thistle/Bristle Thistle/Yellow ThistleCirsium horridulum
Crimson CloverTrifolium incarnatum
Tropical MilkweedAsclepias curassavica
Heller's MarbleseedOnosmodium helleri
Amur HoneysuckleLonicera mackii
Dewberry/BlackberryRubus spp
Bastard Cabbage/Wild MustardRapistrum rugosum
Texas RagwortSenecio ampullaceus
Yaupon HollyIlex vomitoria
PearPyrus spp., callereyana, and fruiting pears
AnacuaEhretia anacua
Mexican BuckeyeUngnadia speciosa
VerbenaVerbena spp
Indian PaintbrushCastilleja spp, only Castilleja indivisa shown
White Dutch CloverTrifolium repens
MesquiteProsopsis glandulosa
WillowSalix spp, likely Salix nigra
PhloxPhlox spp
AppleMalus
Soft MarbleseedOnosmodium bejariense
PeachPrunus persica
DurantaDuranta erecta
AstragalusAstragalus spp.
FleabaneErigeron spp, likely E. philadelphus, others?
MarigoldTagetes?
Mealy Blue SageSalvia farinacea
Texas ToadflaxNuttallanthus texanus
Pink Evening PrimroseOenothera speciosa
Possumhaw HollyIlex decidua
ButtercupsRanunculus spp
Roughleafed DogwoodCornus drummondii/Swida
AgaritaBerberis trifoliolata
Texas MadroneArbutus xalapensis
Bigtooth MapleAcer grandidentatum
Texas ThistleCirsium texanum
PetuniaPetunia sp.
CrocusCrocus sp
BrazoriaBrazoria sp
Goldenball LeadtreeLeucaea retusa
BlackJack OakQuercus marilandica
OxalisOxalis spp.
Aromatic SumacRhus trilobata, Rhus aromatica
Red BuckeyeAesculus pavia
HackberryCeltis sp.
Cutleaf /Sawtooth /Engelmann's DaisyEngelmannia peristenia
Imported HollyIlex spp
Death CamusZigadenus nuttallii
Eastern BlueStarsAmsonia tabernaemontana
Texas BluestarsAmsonia ciliata
Rabbit TobaccoDiapera sp
Cedar ElmUlmus crassifolia
PansyViola × wittrockiana
Texas EbonyEbenopsis ebano
Gerbera DaisyGerbera jamesonii
Bur CloversMedicago spp
Live Oak?Quercus virginiana
ButtonweedDiodia virginiana
Rangoon CreeperQuisqualis indica
VetchVicia spp

Filed under Monarch Biology | Comments Off on Monarchs and the freeze in Texas

Nectar plants used by monarchs during March in Texas

25 May 2021 | Author: Chip Taylor

by Chip Taylor, Director of Monarch Watch and Carol Clark, Monarch Conservation Specialist

Introduction

Extreme weather events can have short and long-term impacts on the flora and fauna of a region and can even have an impact on migratory species such as monarch butterflies, birds and bats by limiting the resources available as they arrive in areas affected by such events. So, it was with some concern that we viewed the winter freeze that unfolded in Texas in February. This 11-day cold spell (10-20 February 2021) proved to be a disaster. Freezing temperatures covered the state and extended well into Northern Mexico killing wildlife (TPDW, 2021, Maeckle, 2021) and freezing vegetation across the state. Our post-freeze assessment gave rise to the possibility that monarchs returning from Mexico in mid-March would find little or no milkweeds to lay eggs on or nectar to sustain them. As a result of these concerns, we initiated a project with iNaturalist, with the help of Tania Homayoun of the Texas Parks and Wildlife Department, in which we asked participants to submit sightings (images) of monarchs, nectar sources and milkweeds:

Texas Winter Storm 2021 Plant & Pollinator Survey
https://inaturalist.org/projects/texas-winter-storm-2021-plant-pollinator-survey

Description/justification for the project
https://inaturalist.org/projects/texas-winter-storm-2021-plant-pollinator-survey?tab=about

This project produced an amazing amount of data which will be summarized in several posts to the Monarch Watch Blog. In this text, we will summarize the diversity of nectar plants visited by monarchs in March of 2021 and will compare that list with the records for 2018 and 2020.

The iNaturalist records consist of photos taken of subjects of interest which, due to the time stamp on the photos and the locations submitted by the participant, provide a marker for the time and place of a species. These records can then be assembled to show the spatial and temporal distributions of these sightings. In some cases, the images provide evidence of associations between species and that’s the case with monarchs and nectar sources. The images of monarchs in March 2021 (N=539) showed a large number of them feeding on flowers, most of which could be identified. One of us, (CC), identified these plants for 2021 and then scanned the records for 2018 and 2020 to determine how the plants visited differed among the years.

Results

The results show substantial similarities and differences among years in the plants that were visited by monarchs. The diversity appears to differ, in part, due to the number of records submitted per year and the weather that influences plant growth each season. The records are summarized in Table 1 below. The records for 2021 indicated monarchs visited 69 species per 539 observations, 85 species per 647 observations in 2020 and 41 species per 168 images in 2018. The percentage of photos with nectar plants ranged from 12-13% in 2021 and 2020 to 24% in 2018. In all, monarchs visited 123 species for nectar and of these, 20 were visited all three years. Another 20 species visited in 2021 were recorded as visited in either 2018 or 2020. Interestingly, there were images of 30 species visited in 2021 that were not recorded as visited in the other two years. In contrast, there were 18 species that were not visited in 2021 but were visited in either 2018 or 2020. Ten of these were visited in both 2018 and 2020. Also of interest are the 38 species visited in 2020 but not recorded for either 2018 or 2021.

Discussion

Before getting into to the biological implications of these plant visitation records, we need to acknowledge that the process of obtaining these images has inherent biases such that they may not be fully representative of what monarchs visit. First, the very process of taking pictures involves light with most pictures taken when the photographer determines there is enough light for a photo. Then, there are the hours that both monarchs and people overlap in the field. While both monarch and human activity probably have similar peaks in early to mid-afternoon it’s possible that there is less overlap both early and late in the day that could result in missed opportunities to record monarch activities. It may also be the case that monarchs are more active than the iNaturalist participants when the temperatures are in the 60F range. Further, it’s clear that the records are human centric in that they are concentrated around major cities where access to native vegetation is more limited than in the broader countryside. Visits to trees and vines may be underrepresented as well.

In spite of these limitations, these records show that monarchs visited an amazing diversity of flowering species for nectar (N=123) during March in the three years we examined, and it’s likely the true number is even greater. Included among these plants are a large number of introduced species, including cultivars, ornamentals, weeds and even some invasive species. Natives are widely used as well, but the diversity of nectar plants available to monarchs presently seems likely to be greater than before European settlement.

Comparisons of the species visited from year-to-year lead to a number of interesting questions. First, if we compare 2021 with 2020, we can see that 69 species were visited in 2021 but of these only 38 were visited in 2020. Does this mean that monarchs were forced to visit a range of nectar sources in 2021 that were not visited in 2020 because the richer sources nectar sources available in 2020 were not available in 2021? Similarly, there were 18 species visited in 2018 and 2020, 10 of which were visited both years, that were not visited in 2021. Does this mean that those 18 species, or a least some of them, had not recovered from the freeze and were simply not present or abundant enough to become part of the record? And what about the 38 species visited in 2020 that were not visited in 2018 or 2021. Were they simply not present, or again, too scarce to be included in the 2021 record?

There are basic questions here about how each plant species is affected by either favorable or negative conditions. Several species, such as wild hyacinths, prairie celestials, crow poison, wild onions, and rain lilies, all of which have bulbs well underground, seemed to be unaffected by the freeze and bloomed on time in 2021 while other plants were delayed. Yet, some species such as the Indian hawthorns, so ubiquitous in Dallas landscaping, are just rows of dead bushes at this writing. Statewide, none of them bloomed this year.

While there is much to learn about the calories monarchs need per day to sustain flight, egg production, egg laying and mating, we also need to know what the flowers of each species provide and how monarchs “choose” to visit particular flowers. Though monarchs appear to be opportunistic feeders, monarchs are capable of learning (Rodrigues, et al 2010, Blackiston, et al 2011) and it is possible, perhaps likely, that they prioritize high-quality nectar plants in good years and try nearly anything in years when there is little to offer. 2021 represented a year when many flowers were no-shows at the time monarchs arrived, perhaps causing them to visit a number of species (N=30) not visited in other years.

These records indicate that floral resources available to migratory and reproductive monarchs can, and do, shift dramatically from year to year and this leads to two observations. First, that monarchs are very adaptable and can shift to new flower sources when needed and second, since monarchs can use a variety of nectar sources beyond those that occur naturally, humans can do much to sustain monarch populations by planting non-native as well as native nectar sources in managed landscapes. However, for those introducing non-natives into gardens, care should be taken to avoid the use of species that naturalize easily or are known to be invasive. A list of herbs and forbs considered to be invasive in parts of the United States can be found here https://www.invasiveplantatlas.org/herbs.cfm. There are also lists for shrubs and trees – https://www.invasiveplantatlas.org.

Table 1. Nectar plants used by monarchs during March in Texas. [View as Google Sheet instead]

COMMON NAMESCIENTIFIC NAME202120202018
RECORDED IN MARCH 2021
Mexican PlumPrunus MexicanaYYY
Crow Poison/False GarlicNothoscordum bivalveYYY
Dakota Mock VevainGlandularia bipinnfidia (and related species)YYY
Cherry LaurelPrunus carolinianaYYY
Citrus spCitrus spp.YYY
Thicket Plums/Wild Plum (collective)Prunus sppYYY
Redbud,Cercis canadensis, multiple subspeciesYYY
DandelionTaraxicum officinaleYYY
HenbitLamium amplexicauleYYY
LilacSyringa vulgarisYYY
Bull Thistle/Bristle Thistle/Yellow ThistleCirsium horridulumYYY
Crimson CloverTrifolium incarnatumYYY
Tropical MilkweedAsclepias curassavicaYYY
Heller's MarbleseedOnosmodium helleriYYY
Amur HoneysuckleLonicera mackiiYYY
Dewberry/BlackberryRubus sppYYY
Bastard Cabbage/Wild MustardRapistrum rugosumYYY
Texas RagwortSenecio ampullaceusYYY
Yaupon HollyIlex vomitoriaYYY
PearPyrus spp. , callereyana, and fruiting pearsYYN
AnacuaEhretia anacuaYNY
Mexican BuckeyeUngnadia speciosaYYN
VerbenaVerbena sppYYN
Indian PaintbrushCastilleja spp, but only Castilleja indivisa shownYYN
White Dutch CloverTrifolium repensYNN
MesquiteProsopsis glandulosaYNY
WillowSalix spp, likely Salix nigraYYN
PhloxPhlox sppYY?
AppleMalusYYN
Soft MarbleseedOnosmodium bejarienseYYN
PeachPrunus persicaYYN
DurantaDuranta erectaYYN
AstragalusAstragalus spp.YYN
FleabaneErigeron spp, likely E. philadelphus, maybe othersYNY
MarigoldTagetes?YYN
Mealy Blue SageSalvia farinaceaYYN
Texas ToadflaxNuttallanthus texanusYYN
Pink Evening PrimroseOenothera speciosaYNY
Possumhaw HollyIlex deciduaYYN
ButtercupsRanunculus sppYNN
Roughleafed DogwoodCornus drummondii/Swida YNN
AgaritaBerberis trifoliolataYNN
Texas MadroneArbutus xalapensisYNN
Bigtooth MapleAcer grandidentatumYNN
Texas ThistleCirsium texanumYNN
PetuniaPetunia sp.YNN
CrocusCrocus spYNN
BrazoriaBrazoria spYNN
Goldenball LeadtreeLeucaea retusaYNN
BlackJack OakQuercus marilandicaYNN
OxalisOxalis spp.YNN
Aromatic SumacRhus trilobata, Rhus aromaticaYNN
Red BuckeyeAesculus paviaYNN
HackberryCeltis sp.YNN
Cutleaf Daisy/Sawtooth Daisy/Engelmann's DaisyEngelmannia peristeniaYNN
Imported HollyIlex sppYNN
Death CamusZigadenus nuttalliiYNN
Eastern BlueStarsAmsonia tabernaemontanaYNN
Texas BluestarsAmsonia ciliataYNN
Rabbit TobaccoDiapera spYNN
Cedar ElmUlmus crassifoliaYNN
PansyViola × wittrockianaYNN
Texas EbonyEbenopsis ebanoYNN
Gerbera DaisyGerbera jamesoniiYNN
Bur CloversMedicago sppYNN
Live Oak?Quercus virginianaYNN
ButtonweedDiodia virginiana YNN
Rangoon CreeperQuisqualis indicaYNN
VetchVicia sppYYY
NOT RECORDED IN MARCH 2021
Texas LantanaLantana urticoidesNYY
Red Tip PhotiniaPhotinia fraseriNYY
Asian Wisteria Wisteria sinensisNYY
Lantana (tropical)Lantana camaraNYY
Indian HawthornRaphiolepis indicaNYY
Glossy PrivetLigustrum lucidumNYY
Texas Mountain LaurelDermatophyllum secundiflorum, Sophora secundifloraNYY
Drummond's SkullcapScutellaria drummondiiNYY
CoreopsisCoreopsis, likely C. grandifloraNYY
Annual SunflowerHelianthus annuusNNY
Texas OliveCordia boissieriNNY
BluebonnetLupinus texensisNYY
Texas PersimonDiospyros texanaNNY
New Jersey TeaCeanothus herbaceaNNY
Hairy Tube TongueJusticia pilosellaNNY
Spanish NeedleBidens pilosaNNY
RECORDED IN MARCH 2020 ONLY
Butterfly BushBuddleia davidii, and cultivarsNYN
Texas butterfly BushBuddleia marrubifoliaNYN
PentasPentas lanceolataNYN
Purple ConeflowerEchinacea purpureaNYN
PerfumeballsGaillardia suavisNYN
Gregg's Blue MistflowerConoclinium greggiiNYN
Texas Coneflower (Giant?)Rudbeckia texanaNYN
Berlandier's AnemoneAmenome berlandieriNYN
Cloth of GoldPhysaria SP.NYN
RosemarySalvia rosmariunusNYN
Slim MilkweedAsclepias linearisNYN
PorterweedStachytarpheta cayennensisNYN
PomegranatePunica granatumNYN
Mourning BrideScabiosa atropurpureaNYN
Texas DandelionPyrrhopappus spp.NYN
Texas SageLeucophyllum frutescensNYN
Autumn SageSalvia greggiiNYN
Kitchen OnionAllium cepaNYN
Plains OnionAllium perducleNYN
Fragrant Prairie OnionAllium canadense var. hyacinthoidesNYN
Trailing White LantanaLantana montevidiensisNYN
HawkweedCrepis/Youngia japonicaNYN
Lindheimer's GauraOenothera lindheimeriNYN
Sweet WilliamDianthus barbatusNYN
StocksMatthiola incanaNYN
Mexican Flame VineSenecio confusus (also synonyms)NYN
Antelope Horns MilkweedAsclepias asperulaNYN
Groundsel (s)Packera sppNYN
Pink Society GarlicTulbaghia violaceaNYN
Salt CedarTamarix spNYN
Dwarf DandelionKrigia sp.NYN
FirewheelGaillardia pulchellaNYN
Drummond's OnionAllium drummondiiNYN
Purple DeadnettleLamium purpureumNYN
Pale WinecupCallirhoe alcaeoidesNYN
AzaleaRhododendron sp. (horticultural selection)NYN
PittosporumPittosporum tobiraNYN
Littleleaf SumacRhus microphyllaNYN

References

Blackiston, D., A.D. Briscoe, & M.R. Weiss. 2011. Color vision and learning in the monarch butterfly, Danaus plexippus (Nymphalidae) J Exp Biol (2011) 214 (3): 509–520.

Maeckle, M., 2 March, 2021. Wildlife death toll mounts in wake of historic Texas freeze. San Antonio Report. https://sanantonioreport.org/wildlife-death-toll-mounts-in-wake-of-historic-texas-freeze/

Rodrigues, D., Goodner, B.W., & M. R. Weiss. 2010, Reversal Learning and Risk-Averse Foraging Behavior in the Monarch Butterfly, Danaus plexippus (Lepidoptera:Nymphalidae). Ethology 116 (2010) 270–280.

Severson, K., 5 March 2021. Texas Farmers Tally Up the Damage From a Winter Storm ‘Massacre’. N. Y. Times. https://www.nytimes.com/2021/03/04/dining/texas-farms-storm-damage.html

Texas Parks and Wildlife, March 10, 2021. At least 3.8 Million Fish Killed by Winter Weather on Texas Coast. https://tpwd.texas.gov/newsmedia/releases/?req=20210310c

Filed under Monarch Biology | Comments Off on Nectar plants used by monarchs during March in Texas

Monarch Watch Update April 2021

21 April 2021 | Author: Jim Lovett

This newsletter was sent via email to those who subscribe to our email updates. If you would like to receive periodic email updates from Monarch Watch, please take a moment to complete and submit the short Google Form at https://monarchwatch.org/subscribe/

Happy Early Earth Day, Monarch Watchers!

Included in this issue:
1. Monarch Watch Spring Plant Fundraiser
2. Milkweeds for California and More!
3. Monarch Tag Recoveries & A Possible Remigrant?
4. Monarch Watch Tagging Kits
5. Bicycling with Butterflies: Thank You!
6. About This Monarch Watch List

——————————————————
1. Monarch Watch Spring Plant Fundraiser
——————————————————

It’s here! Our annual Spring Plant Fundraiser is now online and we have thousands of plants looking for good homes. We are once again offering online ordering and contactless curbside pickup (or limited local delivery) for this event. To place an order you must live in, or be willing to travel to, LAWRENCE, KANSAS (we cannot ship). These plants are ideal for starting butterfly gardens or adding to established gardens and can contribute to the health of monarch and pollinator populations. Don’t miss out!

A complete list of plants and online ordering is available via the link below and pickup/delivery appointments are being scheduled for May 5-8.

Monarch Watch Spring Plant Fundraiser: https://spring.monarchwatch.org

If you are not able to participate locally, we invite you to contribute to this annual fundraiser by donating to Monarch Watch via https://monarchwatch.org/donate

Thank you!

——————————————————
2. Milkweeds for California and More!
——————————————————

Monarch Watch is excited to announce a new partnership with Great Valley Seed/Headstart Nursery in Gilroy, CA. What does this mean for Californians? In 2021, we can ship you a flat of narrowleaf milkweed for $83 a flat. And, if you apply for free milkweeds as part of a nonprofit or school that has a public garden, your organization can get these milkweeds for free. We are taking orders now!

But we don’t only have plants in California. People all over the country can purchase milkweeds through the Milkweed Market. Texas gardeners, get your orders in soon because we will begin shipping next week.

Speaking of FREE milkweeds, we still have funding to give away about 1600 more milkweed plants in 2021. The Natural Resources Defense Council has generously funded this grant for the last 7 years, and it is really helping get milkweeds into public gardens. In Chicago’s Beverly/Morgan Park neighborhood, we are distributing seven flats to the community so they can add milkweed to their pollinator gardens. See more here: http://bit.ly/bring-on-the-butterflies

Monarch Watch’s Milkweed Market: https://shop.milkweedmarket.org/

Apply for Free Milkweeds: https://monarchwatch.org/free-milkweeds

——————————————————
3. Monarch Tag Recoveries & A Possible Remigrant?
——————————————————

The codes for tags recently recovered at the overwintering sites in central Mexico have been posted online and “domestic recoveries” (within Canada, the US, and northern Mexico) are also available. So pull out a copy of your tagging records and check out the recovery lists to determine if any of your tagged butterflies were observed or recovered after release!

Monarch Watch Tag Recoveries: https://monarchwatch.org/tagrecoveries

A possible remigrant? We recently received an email about a tagged monarch that was found in a duck pen in Dimmitt, Texas (southwest of Amarillo) on the 16th of March 2021. We are still receiving and processing data from the 2020 tagging season but were able to locate the tag record that indicated this monarch was a wild male that was released 9-14-2020 from Oskaloosa, Iowa.

Based on the details provided, it seems likely that this monarch was a remigrant that left Iowa in the fall, overwintered in Mexico, started the trek north in the spring and then died shortly before it was found.

——————————————————
4. Monarch Watch Tagging Kits
——————————————————

Monarch tagging is an important tool to help us understand the overall dynamics of the monarch population. Tagging Kits for the 2021 fall tagging season are available for preorder and we will ship them out in the fall, ahead of the migration in your area.

Monarch Watch Tagging Kits are only shipped to areas east of the Rocky Mountains. Each tagging kit includes a set of specially manufactured monarch butterfly tags (you specify quantity), a data sheet, tagging instructions, and additional monarch / migration information. Tagging Kits for the 2021 season start at only $15 and include your choice of 25, 50, 100, 200, or 500 tags.

Monarch Watch Tagging Kits and other materials (don’t forget a net!) are available via the Monarch Watch Shop online at https://shop.monarchwatch.org – where each purchase helps support Monarch Watch.

Monarch Watch Tagging Program: https://monarchwatch.org/tagging

Please return your tag data! Although we prefer that you submit your tag data to us once your tagging season is over (and by December 1st if possible), it is never too late to send in your data. Online submission is preferable and the most efficient method, but you may also mail in paper sheets as well. Thank you!

——————————————————
5. Bicycling with Butterflies: Thank You!
——————————————————

In 2017 outdoor educator Sara Dykman became the first person to bicycle the entire route of the migrating monarch butterfly. Last week, hundreds of you from all over the world joined us online as we presented Sara and her new book “Bicycling with Butterflies” in conversation with Monarch Watch Director Chip Taylor. In total, we had more than 1,100 registrants – nearly 700 attended live and hundreds more have since viewed the recorded event.

If you were not able to attend the live event, no worries – you can replay the entire hour-long event at your convenience via https://monarchwatch.org/bicyclingwithbutterflies

“Told with a writer’s eye for detail and a biologist’s sensitivity to the fragile nature of the systems that support wildlife and humans . . . a keen observer of the human condition, Sara draws attention to some of the patterns in our society that are in conflict with the greater good. Her narrative is an important wake-up call for the need to stay connected to nature.” —Dr. Orley Taylor, director of Monarch Watch

Order your copy of Sara’s new book “Bicycling with Butterflies: My 10,201-Mile Journey Following the Monarch Migration” from Monarch Watch via https://monarchwatch.org/book/9781643260457

For those of you who preordered Sara’s book from Monarch Watch ahead of the April 13th publication date, we are still busy sending them out and you should receive your copy soon!

A BIG THANK YOU goes out to everyone who made this special live online event a huge success!

——————————————————
6. About This Monarch Watch List
——————————————————

Monarch Watch ( https://monarchwatch.org ) is a nonprofit education, conservation, and research program affiliated with the Kansas Biological Survey at the University of Kansas. The program strives to provide the public with information about the biology of monarch butterflies, their spectacular migration, and how to use monarchs to further science education in primary and secondary schools. Monarch Watch engages in research on monarch migration biology and monarch population dynamics to better understand how to conserve the monarch migration and also promotes the protection of monarch habitats throughout North America.

We rely on private contributions to support the program and we need your help! Please consider making a tax-deductible donation. Complete details are available at https://monarchwatch.org/donate or you can simply call 785-832-7452 (KU Endowment) for more information about giving to Monarch Watch.

If you have any questions about this email or any of our programs, please feel free to contact us anytime.

Thank you for your continued interest and support!

Jim Lovett
Monarch Watch
https://monarchwatch.org

You are receiving this mail because you were subscribed to the Monarch Watch list via monarchwatch.org or shop.monarchwatch.org – if you would rather not receive these periodic email updates from Monarch Watch (or would like to remove an old email address) you may UNSUBSCRIBE via https://monarchwatch.org/unsubscribe/

If you would like to receive periodic email updates from Monarch Watch, you may SUBSCRIBE via https://monarchwatch.org/subscribe/

This e-mail may be reproduced, printed, or otherwise redistributed as long as it is provided in full and without any modification. Requests to do otherwise must be approved in writing by Monarch Watch.

Filed under Email Updates | Comments Off on Monarch Watch Update April 2021

Monarch Watch Update March 2021

19 March 2021 | Author: Jim Lovett

This newsletter was sent via email to those who subscribe to our email updates. If you would like to receive periodic email updates from Monarch Watch, please take a moment to complete and submit the short Google Form at https://monarchwatch.org/subscribe/

Greetings Monarch Watchers!

Included in this issue:
1. Bicycling with Butterflies: Free Live Online Event
2. Monarch Watch Spring Plant Fundraiser
3. Monarch Population Status
4. Returning Monarchs & Spring Resources
5. Monarch Tag Recoveries
6. Submitting Tag Data
7. Monarch Calendar Project
8. About This Monarch Watch List

——————————————————
1. Bicycling with Butterflies: Free Live Online Event
——————————————————

You are invited to join Monarch Watch Director Chip Taylor and Author & Outdoor Educator Sara Dykman at 7:00pm CDT on 13 April 2021 for an online event hosted by Monarch Watch and The Raven Book Store. Hear stories from Dykman’s inspirational ride alongside the monarchs, learn about monarch conservation efforts, and participate in a Question & Answer session. There is no software to download and you will be able to view and interact with participants within a standard web browser (Chrome, Safari, Firefox, Edge, etc.) via the link below.

Register today for the April 13th online event via https://monarchwatch.org/bicyclingwithbutterflies

In 2017 Sara Dykman became the first person to bicycle the entire route of the migrating monarch butterfly. She traveled from Mexico to Canada and back on an old mountain bike weighted down with all the supplies she would need for nine months on the road. Along her 10,201-mile route Dykman gave presentations to people about the monarchs and what people can do to protect the migration. She became a voice for the monarchs. Now her voice has the potential to travel even further, with the launch of her book, Bicycling with Butterflies. Part science, part adventure, part love letter to nature, Dykman hopes her book will inspire people to see the beauty of our own backyards and the power each of us has to be part of the solution.

Order your copy of Bicycling with Butterflies from Monarch Watch by April 13th to receive a copy signed by the author. As a bonus, the first 30 copies will also include an art print created by Sara. Visit https://monarchwatch.org/book/9781643260457 to preorder her book and we will ship your signed copy out to you in early April.

“I corresponded with Sara Dykman before her venture started to help her with her route and the timing and also connected her with a few people and venues. I met her briefly when she came through Lawrence. I was skeptical of the entire venture, as were most who advised or met Sara. We were wrong to doubt her. She completed her mission of tracing the annual two-way migration undertaken by millions of monarch butterflies. It was an extraordinary feat, a compelling quest by a strong yet sensitive person who struggles with her self-doubt, anger, vulnerabilities and occasionally her decision making. Yet, Sara persevered and stayed the course. She made a connection with and commitment to monarchs and herself. Through her narrative, told with a writer’s eye for detail and a biologist’s sensitivity to the fragile nature of the systems that support wildlife and humans, she helps us see how everything is connected. Sara also exposes the readers to some of the patterns in our society that are in conflict with the greater good and she will connect many with monarchs for the first time. Her narrative is an important wake-up call for the need to stay connected to nature.” –Chip Taylor

——————————————————
2. Monarch Watch Spring Plant Fundraiser
——————————————————

Our annual Spring Plant Fundraiser is coming soon and we will once again have thousands of plants looking for good homes! As many of you already know, we have moved to online ordering and local curbside pickup (or limited local delivery) for this event. To place an order you must live in, or be willing to travel to, LAWRENCE, KANSAS (we cannot ship). These plants are ideal for starting butterfly gardens or adding to established gardens and can contribute to the health of monarch and pollinator populations. Don’t miss out!

A complete list of plants and online ordering will available beginning in mid-April; contactless curbside pickup appointments will be scheduled for May 6-8. Please note that dates are subject to change. We plan to make a brief announcement via email, Facebook, etc. once online ordering is available but you may also check the link below in a few weeks and it will take you to the Spring Plant Fundraiser.

Monarch Watch Spring Plant Fundraiser: https://spring.monarchwatch.org

If you are not able to participate locally we invite you to contribute to this fundraiser by donating to Monarch Watch via https://monarchwatch.org/donate

Thank you!

——————————————————
3. Monarch Population Status —by Chip Taylor
——————————————————

In recent years, I’ve written extensively about the development of the monarch population from early March through September, often ending with predictions about the size of the overwintering population. My prediction this year was close. In an earlier post to the Blog, I wrote “I’ll be surprised, and pleased, if the total population measures over 2 hectares”. On 25 February 2021, World Wildlife Fund Mexico in collaboration with CONANP and the Monarch Butterfly Biosphere Reserve (MBBR) announced that the total forest area occupied by overwintering monarch colonies was 2.1 hectares, a 26% decrease from the previous season (see https://monarchwatch.org/blog/2021/02/25/monarch-population-status-45/). My prediction was based on the timing and patterns of recolonization, the summer and September temperatures and what I know from tagging about the probabilities that monarchs originating from different regions will survive to overwinter in Mexico.

The size of the monarch population from generation to generation and ultimately the number of migrants in the last generation is determined by spring and summer conditions, including the quantity and quality of host and nectar sources available. In 2020, the pattern of recolonization and population development from March to early June was modest at best in the Upper Midwest and disappointing in the Northeast. Recolonization was followed by a hot summer (June–August) in both the Upper Midwest (2.7°F above average) and the Northeast (3.2°F above average). Mean summer temperatures greater than 2°F in the Upper Midwest are usually associated with low numbers of migrants and a decline from the previous year in overwintering numbers. The best reports of monarch numbers late in the summer were from west of 90°W (west of Madison, Wisconsin) and mostly north of Iowa. That’s a small area of high productivity relative to most years. These conditions and various reports throughout the summer led to the expectation that the migratory population would be smaller than in 2019. Later, reports from taggers indicated that fewer taggers were using all their tags, again suggesting a smaller migration.

Nevertheless, it was apparent that conditions during the 2020 migration were more favorable than in 2019. The migration was not late, as it was in 2019, and there was no shortage of nectar this year due to a drought in Texas and northeast Mexico. Both the lateness of the migration and the Texas drought were factors that contributed to the low numbers of migrants reaching the overwintering sites in Mexico in 2019. Monarchs were more or less on time this year with conditions more like those seen in the mid 1990s than seen in recent years. The monarchs also arrived in late October in time for the Day of the Dead (November 1–2).

Whether monarchs rebound this year will depend on the number of returning monarch females, nectar and host plant availability (see text on spring conditions in Texas), March and early April temperatures, and then the conditions the from May to September. I will try to keep everyone updated about the development of the population this year.

——————————————————
4. Returning Monarchs & Spring Resources —by Chip Taylor
——————————————————

The monarch breeding season starts each year with the arrival in Texas of monarchs that overwintered in Mexico in mid-March. Both sexes visit flowers for nectar to fuel flight and mating and females search out milkweeds on which to lay eggs as the return migration continues to advance to the north and east. But what will they find in the way of resources this year given the prolonged freeze in Texas in mid-February?

I expressed my concern about this situation and outlined my intent to create a community science project to assess the status of milkweeds and nectar sources on the Monarch Watch discussion list Dplex-L in late February. My intent was to recruit a large number of volunteers for this project, but given the short time frame and the complexities of how to report the data, I asked for advice. John Barr quickly offered that instead of trying to create something new, that I ask iNaturalist to create a special project along these lines. That was good advice, and the folks at iNaturalist kindly obliged. Below you will find the link to this project along with the first paragraphs that explain the justification for this effort. As the season progresses, we will be able to compare the observations recorded this year with those logged to the site previously.

Texas Winter Storm 2021 Plant & Pollinator Survey: https://www.inaturalist.org/projects/texas-winter-storm-2021-plant-pollinator-survey

The February freeze damaged vegetation across Texas. We’d like your help tracking the recovery of plants that flower in March along with milkweeds. Both are resources used by monarchs returning from Mexico in mid-March and their availability will determine how well the monarch population develops in 2021.

The 11-day cold spell (10-20 February) in Texas was a disaster. Freezing temperatures covered the state and extended well into Northern Mexico. While many of the immediate effects of the freeze are clear, season long and multiple year effects may linger. The damage to the flora was extraordinary, and it is likely that nearly all above ground insects died over a wide area. Plants already in flower may have been so damaged as to not flower this year. We are seeking help to record that damage and the recovery of plants that flower in March along with the appearance of milkweed shoots and buds. Both are resources used by monarchs returning from Mexico in mid-March. We also need help recording the number of returning monarchs. ALL monarch observations are of value. How well the monarch population will develop in 2021 will be determined by the March conditions in Texas.

——————————————————
5. Monarch Tag Recoveries
——————————————————

The tagging program provides us with two main sources of information: the tagging records themselves and the recoveries of tagged monarchs in Mexico. By virtue of the records on the returned data sheets, we can infer the timing and pace of the migration for each year. The resulting year to year comparisons have been helpful in helping us understand the influence of weather patterns on the development of the populations each year in different regions of the country as well as the success of the migration. The recoveries, on the other hand, tell us about the relative success of migrants due to timing and area of origin.

As you know, in Mexico, guides and local residents look for tags among the dead butterflies that litter the forest floor beneath the trees with monarch clusters. In recent years, people representing Monarch Watch, most often Monarch Conservation Specialists, have paid for these recoveries and have returned them to us in Kansas. That has worked well, but what about this year of Covid-19 and restricted travel? We worked on several scenarios to recover tags, but all the options posed difficulties. We needed someone to step up and someone did. Diane Pruden, a Monarch Conservation Specialist of long-standing and frequent visitor to Mexico, declared that, after a long winter in Michigan, she needed a shot of Mexico in addition to her two vaccinations.

Diane recently traveled to Mexico where, working with Estela Romero and Ellen Sharp, she was able to purchase over 650 tags. Our thanks to everyone for acquiring these tags. Obtaining these recoveries is a major achievement given the lower number of visitors to the colonies this season and the general restrictions imposed by Covid-19. We will process these records and update the recoveries on our website in April. The list of “domestic recoveries” (those within the US, Canada and northern Mexico) was updated recently.

Monarch Watch Tag Recoveries: https://monarchwatch.org/tagrecoveries

——————————————————
6. Submitting Tag Data
——————————————————

Thousands of you have already submitted your 2020 season tag data to us by mail or via our online submission form – thank you! If you haven’t submitted your data yet (from any season) please review the “Submitting Your Tagging Data” information on the tagging program page then send us your data at your earliest convenience via the Tagging Data Submission Form.

Complete information is available at https://monarchwatch.org/tagging/ if you have questions about submitting your data to us and we have conveniently placed a large orange “Submit Your Tagging Data” button on our homepage at https://monarchwatch.org that will take you directly to the online form.

There you can upload your data sheets as an Excel or other spreadsheet file (PREFERRED; download a template file from https://monarchwatch.org/tagging/) or a PDF/image file (scan or photo).

If you have any questions about getting your data to us, please feel free to drop Jim a line anytime via JLOVETT@KU.EDU

——————————————————
7. Monarch Calendar Project
——————————————————

Monarch Watch is again seeking the assistance of hundreds of monarch enthusiasts in collecting observations of monarchs in their area during specific periods of the spring and fall. If you would like to participate this year, all you have to do is: 1. REGISTER (just so we know where you are located and how to reach you), 2. RECORD (keep a record of the number of monarch butterflies you observe each day during the time period dictated by your location) and 3. SUBMIT (at the end of the observation period in the fall we will send participants a link to an online form to submit their observation data).

As before, please make note of your daily monarch observations using whatever recording system works for you (spreadsheets, printed calendar sheets, notebooks, etc.) and we will send out links to the online submission forms once the observation periods have closed for both the north and south regions.

Complete details and a link to the short registration form are available at https://monarchwatch.org/calendar/

Please note that OBSERVATION PERIOD 1 began March 15th for those in the South (latitude less than 35N) and begins April 1st for those in the North (latitude greater than 35N). It is not too late to join in!

Happy monarch watching and stay safe!

——————————————————
8. About This Monarch Watch List
——————————————————

Monarch Watch (https://monarchwatch.org) is a nonprofit education, conservation, and research program affiliated with the Kansas Biological Survey at the University of Kansas. The program strives to provide the public with information about the biology of monarch butterflies, their spectacular migration, and how to use monarchs to further science education in primary and secondary schools. Monarch Watch engages in research on monarch migration biology and monarch population dynamics to better understand how to conserve the monarch migration and also promotes the protection of monarch habitats throughout North America.

We rely on private contributions to support the program and we need your help! Please consider making a tax-deductible donation. Complete details are available at https://monarchwatch.org/donate/ or you can simply call 785-832-7452 (KU Endowment) for more information about giving to Monarch Watch.

If you have any questions about this update or any of our programs, please feel free to contact us anytime.

Thank you for your continued interest and support!

Jim Lovett
Monarch Watch
https://monarchwatch.org

If you would like to receive periodic email updates from Monarch Watch, you may SUBSCRIBE via https://monarchwatch.org/subscribe/

This update may be reproduced, printed, or otherwise redistributed as long as it is provided in full and without any modification. Requests to do otherwise must be approved in writing by Monarch Watch.

Filed under Email Updates | Comments Off on Monarch Watch Update March 2021

Monarch Population Status

25 February 2021 | Author: Jim Lovett

World Wildlife Fund Mexico in collaboration with CONANP and the Monarch Butterfly Biosphere Reserve (MBBR) announced the total forest area occupied by overwintering monarch colonies today. Nine (9) colonies were located this winter season with a total area of 2.10 hectares, a 26% decrease from the previous season (2.83 ha):

monarch-population-figure-monarchwatch-2021
Figure 1. Total Area Occupied by Monarch Colonies at Overwintering Sites in Mexico.

WWF release (in spanish): Menor presencia de mariposa Monarca y aumento de la degradación en los bosques donde hiberna

Filed under Monarch Population Status | Comments Off on Monarch Population Status

Insect Population Dynamics

19 January 2021 | Author: Chip Taylor

Insect Population Dynamics:
Potential fecundity, realized fecundity and reproductive success

I’ve mentioned realized fecundity from time to time in my posts to the Monarch Watch Blog. It’s a subject that gets little attention perhaps because it is more of a hypothetical deductive construct than a measurable outcome of the interaction between a female (or cohort of females) and the immediate environmental context in which reproduction occurs. Yet, there is ample evidence that realized fecundity needs to be understood if we are to understand how monarchs, pollinators and invertebrates in general deal with average weather conditions, substantial deviations from long-term norms, extreme weather events and xenobiotics.

As you may recall from earlier discussions, realized fecundity for most insects is defined as the lifetime number of eggs oviposited. This number is distinguished from potential fecundity, which is the realized fecundity plus any eggs or well-developed oocytes that remain at death. These values are distinguished from reproductive success which is defined by the number of offspring that not only reach the adult stage but reproduce themselves. There is a presumption that higher realized fecundity leads to higher numbers of progeny reaching the adult stage and successfully reproducing. While there are no expectations that there is a linear relationship between realized fecundity and reproductive success, realized fecundity is the base such that low values are likely to stifle, while high values more effectively enable, population growth. In short, if we want to understand how populations respond to environmental conditions, we have to start with realized fecundity.

Studies of reproduction in lab cultures have been used to assess the differences between realized fecundity, potential fecundity and reproductive success. While we can’t easily make those distinctions in the field, we can make some strong inferences based on how populations respond to environmental conditions. For example, when the mean June–August temperatures are 2°F or higher above the long term mean, monarch populations decline. Why is that the case and how is that result related to realized fecundity and reproductive success?

To answer these questions, I try to think about the impact of temperatures on all actors in the play. We can postulate that as temperatures increase, monarch metabolism increases, and with that, there is an increased demand for water and carbohydrates from nectar to maintain bodily functions, including egg and sperm production, and the functioning of neuroendocrine and accessory glands. However, meeting these demands becomes increasingly difficult as temperatures increase since nectar secretion declines at higher temperatures and flowering duration shortens with both declining if the high temperatures occur during drought conditions. In addition, milkweeds experiencing physiological stress mature more rapidly and quality, as measured by nutrient content and percentage of usable proteins, probably decrease as well. In many plants, secondary plant products evolved to deter herbivory tend to increase during periods of stress further diminishing their palatability to herbivores. In other words, there can be a cascade of negative effects after temperatures significantly exceed long-term averages, effects that can be amplified if droughts occur simultaneously. These conditions could impact both adult and larval monarchs. The lifespan of adult monarchs, capacity to reproduce and number of hours of activity could be reduced. The latter due to the tendency for monarchs to seek shelter when temperatures are in the 90s. These conditions likely result in a lower number of eggs laid per female lifetime and thus a reduced realized fecundity for generations experiencing these conditions. It follows that reproductive success could also decline during these conditions if larvae reduce feeding at times when the temperatures are extremely high or the host plants are physiologically stressed. Any such interactions that affect plant quality and larval feeding success or developmental rate of larvae would have a negative effect on population growth.

When thinking about realized fecundity, we need to be careful to distinguish between individual and cohort or generation outcomes. In the spring, as monarchs returning from Mexico have reached Lawrence, I’ve made an effort to catch and dissect a few female monarchs to assess their reproductive condition. Most monarchs reaching eastern Kansas in late April are battered and torn and barely able to fly and can sometimes be seen crawling from plant to plant to lay eggs. Upon dissection most of these females contain fewer than 10 eggs with none developing in the ovaries and an almost completely depleted fat body. These end-of-life females appeared to have maxed out their reproductive potential. While this was true for the monarchs I caught, to what extent was this true of the entire cohort moving north in those years? We don’t know. But what about other years? In 2012 and 2017, overwintering female monarchs reached eastern Kansas in early April in excellent condition and full of eggs (see “Monarch Population Status” (5-11-2017)). Rather than laying most of their eggs in Texas and southern Oklahoma, these monarchs moved rapidly to the north and distributed their eggs over a broader range of latitudes than in most years. Massive numbers of eggs were laid in eastern Kansas in both 2012 and 2017, which would seem to be a good thing, yet, the winter counts that followed showed that the population had declined in each case.

If we assume that these cohorts of females also maxed out their reproductive potential, did the more northerly distribution of eggs have a role in determining the size of the migratory population and overwintering numbers? Probably. A more northerly distribution of eggs appears to reduce reproductive success and slow population growth in several ways. First, moving into northern latitudes too soon can mean that females are searching for milkweeds that have yet to emerge, second, due to a shortage of newly sprouting milkweeds, too many eggs can be laid per milkweed shoot to support all the developing larvae and third, lower average temperatures in more northerly latitudes slow development. Slowing development has the effect of exposing larvae for longer periods to predation and parasitism while increasing the mean age to first reproduction. The latter is probably the most important effect. It is a basic tenant of demography that populations with the shortest age to first reproduction increase most rapidly. With monarchs, any generation that takes longer to develop has a negative effect on the size of next generation. With only three generations per year, if monarchs start the year with a delayed mean age to first reproduction, it is almost impossible to reach numbers typical of average conditions by the end of the season.

We also need to factor in extreme weather events such as catastrophic mortality due to winter storms in Mexico, massive fires that kill the breeding population, floods and periods of extreme heat. To those natural causes of mortality, we can add mowing when larvae are present, insecticide drift from crops into areas with milkweeds and nectar sources and other sorts of chemical contamination. Mortality during or after the migration due to storms, etc., has the effect of reducing reproductive success the following year by reducing the number of monarchs that have the potential to reproduce in the spring. The other sources of mortality mentioned have an impact on the reproductive success of that particular generation, which, if severe, is likely to negatively affect the growth of the next generation. The impact of all these causes of mortality needs further study. We know little about the survival of monarch adults and larvae when temperatures exceed 110°F for a number of days. To these considerations, we can add mortality caused by predators and parasites. Again, these causes of mortality affect the number reaching the adult stage and therefore the potential reproductive success of that generation. Predation and parasitism appear to vary over generations as well as regionally and from year to year making it difficult to assess the importance of these factors as determinants of overall population growth.

Xenobiotics could also have an impact on population development. Xenobiotics are man-made chemicals that are both intentionally and inadvertently widespread in the environment. Although different from stressors associated with weather, chemical stressors could have similar effects – subtle, sublethal effects, that reduce reproductive success. While we tend to think of insecticides, herbicides and fungicides as probable agents in insect declines, there are literally hundreds of other widespread compounds that could be acting as single agents or synergistically with other compounds in ways that could affect realized fecundity. All that would be required is an interaction that causes a slight increase or decrease in metabolic rates. As mentioned, higher metabolic rates could lead to shorter life spans with lower reproductive output, while lower metabolic rates could lead to longer generation times, slower egg maturation, less reproductive activity and ultimately slower population growth. Metabolic rates are but one example as to how trace amounts of man-made compounds could be affecting invertebrates. Such compounds could affect the nervous system in ways that alter key functions such as the ability to produce gametes or respond to environmental stimuli in a manner that interferes with the ability to locate host plants or locate nest sites.

Realized fecundity can also be affected by the spatial distribution of resources. It takes energy to move through the environment in search of resources, and it follows that the costs associated with finding resources, let’s say nectar and host plants, are a function of the spatial distribution and abundance of those resources. In the context of the present-day conditions, involving mega cities, intensive farming and reduction of roadside vegetation through mowing or herbicides, it’s clear that monarchs are dealing with an increasingly fragmented environment. It is likely that fragmentation requires more time and energy for monarchs to find the needed nutrients and host plants to maximize their reproductive potential. How these conditions affect monarchs is not known, but it’s reasonable to expect there is a cost. To appreciate the landscape monarchs must traverse to find milkweeds and nectar sources in the Midwest, you need to drive across central Illinois, Iowa or Minnesota in mid-summer. The fragments with few or no milkweeds and nectar plants are huge. I’ve made those trips, and if my car ran on nectar rather than gasoline, even if an ounce of nectar was equal to a gallon of gas, I certainly couldn’t have completed those trips. It’s not easy being a monarch, and it’s getting harder.

It should be clear that everything I’ve just described for monarchs applies to honey bees, bumble bees, solitary bees, other pollinators and most other insects. I can envision scenarios based on the above that account for population declines of all of these organisms.

For an additional discussion dealing with monarch population dynamics, please see https://monarchwatch.org/blog/2020/02/25/why-monarchs-are-an-enzyme-part-2/

Those readers interested in taking a deeper dive into population dynamics will find the following Wikipedia entry helpful: https://en.wikipedia.org/wiki/Population_dynamics

Filed under General | Comments Off on Insect Population Dynamics

ESA listing decision for the monarch

15 December 2020 | Author: Chip Taylor

In a press release today, the U.S. Fish and Wildlife Service announced its decision with respect to the petition to declare the monarch a “threatened” species under the Endangered Species Act:

“After a thorough assessment of the monarch butterfly’s status, the U.S. Fish and Wildlife Service (Service) has found that adding the monarch butterfly to the list of threatened and endangered species is warranted but precluded by work on higher-priority listing actions. With this decision, the monarch becomes a candidate for listing under the Endangered Species Act (ESA), and its status will be reviewed each year until it is no longer a candidate.”

When asked to respond to this decision, my immediate response was the following:

“The warranted but precluded decision for monarchs is the right one at this time. It acknowledges the need for continued vigilance due to the numerous threats to the population while emphasizing the need to continue support for programs that create and sustain habitats for monarchs.”

“Warranted” in the above means that monarchs should be considered threatened due to the near- and long-term threats to the population. Stated another way, monarchs are vulnerable to falling below what biologists have identified as an extinction threshold, a low number from which the population is unable to recover. The term “precluded” means that among the long list of species whose populations are threatened or endangered, monarchs are less at risk than others at this time. Effectively, this places monarchs on a watch list in which favorable outcomes in the form of an increase in population numbers could result in removal from threatened status or negative trends that could result in regulations and further measures to protect the species. This ruling also means that monarchs are not subject to regulations at this time and that funding is insufficient to support monarch conservation. It follows that, in the near future at least, habitat restoration will have to be funded by the private sector.

There are many threats to the monarch population, including habitat loss, fragmentation of habitats, loss of nectar resources, widespread use of herbicides and pesticides, excessive mowing and climate change. From my point of view, the most serious near-term and long-term threats to the monarch population involve climate change. That effect can already be seen in the West. Temperatures have been increasing in the West at an alarming rate with significant consequences for the western monarchs that appear to have fallen below the extinction threshold for that region. In an earlier Blog post, I presented a preliminary analysis of the temperatures and monarch numbers along the California coast during the winter months (see “Monarchs and climate in the West“). Briefly, that analysis shows that overwintering sites are disappearing in the southern counties with an increasing proportion of the overwintering population being found in more northerly counties. These changes appear to be due to increasing temperatures during January–February along the coast. The changes in the mean temperatures during the growing season since 1901 to 2020 are shown in Figure 1 and the overall pattern of temperature changes per decade for the entire United States is shown in Figure 2. (I will provide further explanation for Figure 2 in another Blog article). Extreme temperatures, mean temperatures that are well above the long-term average, together with drought stress, appear to account for the rapid monarch decline in the West.

A rapid decline could occur in the East as well, if the overwintering population is decimated by a winter storm and followed by unfavorable conditions during the growing season such as those in 2012. I’m concerned about the winter storms in Mexico. These storms are a real and immediate threat to the longevity of the monarch migration. Temperatures in the mid-Pacific have increased, resulting in warm, moisture-rich weather systems that sweep eastward toward the Americas in the winter months. In the last two decades those weather systems have entered central Mexico in mid-winter which, when they hit the mountains, result in heavy rains, sleet, snowfall and freezing temperatures that have killed 50–70% of the overwintering monarchs. There have been 4 such events in recent years: 2002, 2004, 2010 and 2016. Fortunately, all of these events have occurred when the population was robust enough such that the numbers of survivors were sufficient to reestablish a substantial population in the spring. Still, you can see the impact of the 2004 and 2016 winter kills on the size of the population the following year. If there is a winter kill at the 70% level that hits an overwintering population of less than two hectares, it will be years before the population recovers – and it may not, if other unfavorable events such as an extremely warm March and summer, e.g. 2012, follow.

Long-term, we will lose the monarch migration due to increases in March temperatures in Texas, increasing summer temperatures in the Upper Midwest, warmer than average temperatures that delay the fall migrations, an increase in drought conditions in the South Region during the fall, and higher than average temperatures at the overwintering sites in Mexico UNLESS we significantly reduce greenhouse gasses. That said, there will be monarchs in the future, but the populations will be local, limited to southern latitudes and mostly non-migratory.

Yes, I know, the above scenario is pretty grim, but it is a reality we have to deal with. So, the question becomes: what are we going to do to sustain the monarch migration? To me, it’s clear. We have to do all we can to restore and sustain monarch habitats, and we have to support initiatives that favor the reduction of greenhouse gases.


Figure 1. Growing season mean temperatures for California in 30-year intervals starting in 1901. Note that while mean temperatures have increased from 68.4°F to 70.9°F, most of that increase (1.4°F) has occurred in the last 30 years.


Figure 2. Rate of temperature increase (°F) per decade during the growing season, 1975–2020. The rate remains unchanged for those areas with growing seasons that start earlier.


ADDITIONAL INFORMATION
Press Release: U.S. Fish and Wildlife Service Finds Endangered Species Act Listing for Monarch Butterfly Warranted but Precluded

Full report: U.S. Fish and Wildlife Service. 2020. Monarch (Danaus plexippus) Species Status Assessment Report. V2.1 96 pp + appendices.

USFWS: Assessing the status of the monarch butterfly

Filed under Monarch Conservation | Comments Off on ESA listing decision for the monarch

Monarch Watch Update November 2020

30 November 2020 | Author: Jim Lovett

This newsletter was sent via email to those who subscribe to our email updates.

Greetings Monarch Watchers!

Here’s a brief update as we head into the holiday season – stay safe!

As a reminder, if you would like to receive periodic email updates from Monarch Watch, please take a moment to complete and submit the short Google Form at

monarchwatch.org/subscribe

—————————————————————-
1. Monarch Population Status —by Chip Taylor
—————————————————————-
In recent years, I’ve written extensively about the development of the monarch population from early March through September, often ending with predictions about the size of the overwintering population. My observations and comments have been few this year because there just hasn’t been much to say. The pattern of recolonization and population development from March to early June was modest at best in the Upper Midwest and disappointing in the Northeast. Recolonization was followed by a hot summer (June–August) in both the Upper Midwest (2.7°F above average) and the Northeast (3.2°F above average). Mean summer temperatures greater than 2°F in the Upper Midwest are usually associated with low numbers of migrants and a decline from the previous year in overwintering numbers. Spring and summer conditions, including the quantity and quality of host and nectar sources available, determine the number of migrants.

In terms of production, the best reports of monarch numbers late in the summer were from west of 90°W (west of Madison, Wisconsin) and mostly north of Iowa. That’s a small area of high productivity relative to most years.

To get a better sense of the size of the migration each year, Jim Lovett, who compiles the tagging data, began keeping notes on tagging success in 2018. Although the data for this past tagging season is still arriving, the preliminary information suggests that taggers were less successful this year. For example, when asked if they had used all their tags, 33% said yes last year to only 26% so far this year. We’ll have more statistics to share in future updates.

There were some good things underway this fall. The migration was not late, as it was last year, and there was no shortage of nectar this year due to a drought in Texas and northeast Mexico. Both the lateness of the migration and the Texas drought were factors that contributed to the low numbers of migrants reaching the overwintering sites in Mexico last year. Monarchs were more or less on time this year with conditions more like those seen in the mid 1990s than seen in recent years. They also arrived in late October in time for the Day of the Dead (November 1–2).

Overall, my expectation is that survival of monarchs using the central flyway should be relatively high this year. Still, the numbers at the overwintering sites will be relatively low. I’ll be surprised, and pleased, if the total population measures over 2 hectares. That said, my record shows that I tend to underestimate the count.

—————————————————————-
2. Restoring milkweeds for monarchs
—————————————————————-
Our mission is to sustain the monarch migration and that means restoring milkweeds to landscapes from which they have been eliminated or creating new locations for milkweeds.

We work with 5 partner nurseries to distribute 2- to 4-month-old milkweed plugs for restoration and garden projects in most of the continental U.S. These plants can be used for 1) restoration projects through our free milkweed program, underwritten by generous donors, 2) through our free milkweeds for schools and non-profits, another program supported by donations or 3) purchased directly through our Milkweed Market.

Since 2010, we have distributed over 1 million milkweed plugs through these programs. Six-hundred thousand of these plants have been planted in restoration sites of 2 acres or more since 2015. Milkweeds have also been distributed to over 950 schools and non-profits. Many private and public gardens with milkweeds have been created and registered as part of our Monarch Waystation program as well. Monarchs, pollinators and many species that share the same resources benefit from these efforts. You can contribute to monarch conservation by planting milkweeds or donating to support these efforts.

Free Milkweeds for Habitat Restoration on sites of 2 acres or more
monarchwatch.org/bring-back-the-monarchs/milkweed/free-milkweeds-for-restoration-projects/

Free Milkweeds for Schools and Non-profits
monarchwatch.org/bring-back-the-monarchs/milkweed/free-milkweeds-schools-nonprofits/

Milkweeds for Private or Public Gardens and other projects (pre-orders begin in January)
shop.milkweedmarket.org/

Donate to Monarch Watch (GivingTuesday is December 1st!)
monarchwatch.org/donate/

—————————————————————-
3. Submitting Tag Data
—————————————————————-
Thousands of you have already submitted your 2020 season tag data to us by mail or via our online submission form – thank you! If you haven’t submitted your data yet (from any season) please review the “Submitting Your Tagging Data” information on the tagging program page then send us your data at your earliest convenience via the Tagging Data Submission Form.

Complete information is available at monarchwatch.org/tagging if you have questions about submitting your data to us and we have conveniently placed a large orange “Submit Your Tagging Data” button on our homepage at monarchwatch.org that will take you directly to the online form.

There you can upload your data sheets as an Excel or other spreadsheet file (PREFERRED; download a template file from monarchwatch.org/tagging) or a PDF/image file (scan or photo).

If you have any questions about getting your data to us, please feel free to drop Jim a line anytime via JLOVETT@KU.EDU

—————————————————————-
About This Monarch Watch List
—————————————————————-
Monarch Watch (monarchwatch.org) is a nonprofit education, conservation, and research program affiliated with the Kansas Biological Survey at the University of Kansas. The program strives to provide the public with information about the biology of monarch butterflies, their spectacular migration, and how to use monarchs to further science education in primary and secondary schools. Monarch Watch engages in research on monarch migration biology and monarch population dynamics to better understand how to conserve the monarch migration and also promotes the protection of monarch habitats throughout North America.

We rely on private contributions to support the program and we need your help! Please consider making a tax-deductible donation. Complete details are available at monarchwatch.org/donate or you can simply call 785-832-7374 (KU Endowment Association) for more information about giving to Monarch Watch.

If you have any questions about this update or any of our programs, please feel free to contact us anytime.

Thank you for your continued interest and support!

Jim Lovett
Monarch Watch
monarchwatch.org

If you would like to receive periodic email updates from Monarch Watch, you may SUBSCRIBE via monarchwatch.org/subscribe

This update may be reproduced, printed, or otherwise redistributed as long as it is provided in full and without any modification. Requests to do otherwise must be approved in writing by Monarch Watch.

Filed under Email Updates | Comments Off on Monarch Watch Update November 2020

Monarch coloration, milkweed toxins, and predation by birds

5 November 2020 | Author: Chip Taylor

This text is both a preamble and addendum to the “Monarch Fallout and A Predator Story” blog article posted recently by Brad Guhr of the Dyck Arboretum (republished below, with permission).

PREAMBLE
Predation by birds has been offered as the explanation for monarchs’ aposematic coloration. This contrasting orange and black color combination is thought to be a feature that effectively advertises the toxic cardiac glycosides (also called cardenolides) sequestered in the tissues of adult butterflies from the milkweeds consumed during the larval stage. This interpretation is strongly supported by the experiments and numerous analyses conducted by Lincoln Brower and his colleagues. Among these tests were feeding experiments with caged naïve blue jays. Young jays, that had never seen a monarch, would unhesitatingly eat one when it was first presented as a food item. Within a short interval, the jays would vomit up the monarch due to the emetic properties of the cardiac glycosides. A picture of this reaction is iconic (see “The Case of the Barfing Blue Jay“), having graced the pages of Scientific American and many a biology textbook. The jays thereafter refused to eat monarchs when presented among food items. This learning by experience, though some monarchs are consumed in the process, is said to provide monarchs, as a population, with a degree of protection from bird predation since birds, being highly visual, recognize the contrasting colors and, after a feeding experience, subsequently avoid feeding on monarchs or perhaps all species displaying these colors. Indeed, observations of birds feeding on monarchs, other than the black-backed orioles and black-headed grosbeaks that prey on monarchs clustered in the oyamel fir trees in Mexico, are rare.

Yet, now and then, we hear of instances in which observers have reported seeing scissor-tailed flycatchers and Mississippi kites feeding on monarchs during the migration. Unlike blue jays, that stopped eating monarchs after one experience, the scissor-tails and Mississippi kites appear to be undeterred by the cardiac glycosides in the monarchs. Still, the stories that reach us have always been fragmentary. The following blog article created by Brad Guhr, of the Dyck Arboretum, in Hesston, KS, and the wing collection assembled by Karen and Dick Fulk, describe an instance of intense predation by 5 immature Mississippi kites on migratory monarchs that had taken temporary shelter within the grounds of the arboretum.


Monarch Fallout and A Predator Story
By Brad Guhr on Oct 07, 2020

Monarch Fallout
It happened again in 2020. The convergence of the peak of the September monarch southerly migration over Southcentral Kansas was met by a strong south wind, causing a “fallout” of monarchs at the Dyck Arboretum. Rather than waste energy fighting the headwind, monarchs find a place of refuge to rest and sip nectar. I would estimate that I’ve seen this phenomenon happen five times in the Arb since 2005 and this year’s was the most memorable for a few different reasons including big numbers, fallout location, and a predator story.


Monarchs in the Hedge Row at Dyck Arboretum, 9/20/2020 – Photo by Gerry Epp

Big Numbers
The monarch numbers I observed on Monday, 9/21/2020 seemed to me to be more stunning than I can ever remember. I estimated conservatively in a report to Journey North, there were at least 500 monarchs resting in the Arboretum that day. But after giving it more consideration and talking to a local monarch tagger, Karen Fulk, I wonder if that number was more accurately in the thousands.

Karen’s many years of efforts to tag monarchs in Hesston has her keenly in touch with monarch phenology and migration patterns. She reports that the peak of migration through south central Kansas is usually between 9/22 and 9/27. This year, however, she started seeing an uptick in numbers when a cold front and north wind jump-started the southerly monarch migration a bit earlier.

Karen usually tags 300 annually during the fall migration. This year, Chip Taylor at Monarch Watch, knowing that migration numbers were higher this year, suggested that Karen start with 500 tags. She was able to apply most of those 500 tags when the fallout began Friday 9/18/2020 through Sunday 9/20/2020. Arboretum member, Gerry Epp, further documented this event by posting photos of the fallout on his Facebook page, 9/20/2020.


Monarchs on Seven Son Flower at Dyck Arboretum, 9/20/2020 – Photo by Gerry Epp

Fallout Location
With some repetition now in seeing these fallouts occur in the same place, I want to give some thought to why they congregate where they do at Dyck Arboretum. Karen usually tags at three places in Hesston based on the ability to catch and tag the maximum number in one place, and Dyck Arboretum is where she does the majority of her work. She estimated that 95% of her tagging this year happened at the Arboretum, based on seeing the greatest number of butterflies here.

I would hypothesize that they repeatedly congregate in the small 1/8th-acre area at the Arboretum amphitheater/pinetum for three reasons. One, they are seeking protection from the elements of wind and heat. This is about energy conservation. By escaping the wind and congregating in large groups on the north side of the dense hedge row of Osage orange trees, they are finding a microclimate that is cooler, more humid, and less turbulent than they would find on the south side.


Monarchs on Seven Son Flower at Dyck Arboretum, 9/20/2020 – Photo by Gerry Epp

Two, this location is next to a number of nectar sources. Why not rest where you can eat/drink too? Nearby native plant beds and a reconstructed prairie had a timely profusion of flowering from many species of the genera Helianthus (sunflower), Solidago (goldenrod), Symphotrichium (aster), Liatris (gayfeather), Eryngium (eryngo), and Heptacodium (seven son flower).

Three, a number of white pines in this location may resemble the trees of the Oyamel fir forests in Mexico. I don’t have any proof of this theory, but it seems plausible to me.

Predator Story
The newest wrinkle of this monarch fallout experience was the side story of five immature Mississippi kites. They were probably migrating with the monarchs and decided also to not fight the strong south wind. For a day and a half that I observed, this hungry bunch of pentomic predators took advantage of an abundant food supply. They hung out in the top of one of the white pines and took turns swooping through the monarch clouds to easily catch a snack.


Mississippi Kite Eating A Monarch at Dyck Arboretum, 9/22/2020 – Photo by Janelle Flory Schrock

Sometimes they missed catching their target, but usually, these agile insect catchers snagged their prey. Typically they would return to their perch to eat their catch, but sometimes they would eat in flight or “on the wing” as I hear experienced birders say. At one point, I counted approximately 120 monarch wings that had fluttered down to form what I’ll call a monarch confetti debris field. At four wings per monarch, that represented the carnage of about 30 monarchs. However, a number of wings had already been collected by onlookers, so it is not unreasonable to think that the number of monarchs preyed upon were double or triple what I saw.


Monarch Wings at Dyck Arboretum, 9/20/2020 – Photo by Brad Guhr

Monarch Toxicity
This predator behavior was a surprising observation. Monarch larvae eat milkweed and sequester in the mature butterfly wings and exoskeleton the milkweed toxins called cardiac glycosides. These heart poisons can seriously affect vertebrate predators, including birds, and often cause them to vomit and subsequently avoid eating them further. However, these young kites not only ate monarchs all day Monday, but they continued their feeding frenzy the next morning. Either their stomachs weren’t too adversely soured, or the calories needed to continue this migratory journey were simply too important.

A Google literature review turned up no articles mentioning this habit of Mississippi kites eating monarchs. However, a follow-up conversation with University of Kansas Professor, Brad Williamson, helped me understand that this observation is not so irrational. He explained that the monarch population is not 100% toxic.

“The individual toxicity depends a lot on the particular milkweed species that hosted the larval stage. Asclepias syriaca (common milkweed) and Cynanchum laeve (honeyvine milkweed) are not nearly as toxic as A. verticillata (whorled milkweed). There is an entire range of toxicity and it makes for some great mathematical modeling questions–just how much toxicity (percent toxic) in the population is necessary for protection for the entire population? How much metabolic costs are there for monarchs trying to process highly toxic host plants? Turns out that only 25-40% of the population being toxic confers protection for the remaining population.” (I will include below a bibliography on monarch toxicity that Dr. Williamson provided if any of you are interested as I am in learning more about this topic.)

There were a lot of interesting biological and ecological issues at play here with these monarchs and kites. It was just one more interesting natural history story with subplots to be observed by those of us living in the Monarch Flyway. Until I’m able to one day witness the hundreds of millions of monarchs wintering in the the Oyamel forests of central Mexico, I am completely content having a front row seat to this fascinating migration phenomena right here in Kansas.


Monarch butterflies observed at the Monarch Butterfly Biosphere Reserve in Michoacán, Mexico.
Video by Beatrix Amstutz, February 7, 2020.

Plant Milkweed
To assist the monarchs and their annual migration, plant milkweed host plants and other native nectar plants for adults. Check out our annual spring and fall Flora Kansas native plant sales.

Articles on Monarch Toxicity
Brower, L. P., and C. M. Moffitt. “Palatability Dynamics of Cardenolides in the Monarch Butterfly.” Nature 249, no. 5454 (1974): 280–283.

Brower, Lincoln P. “Avian Predation on the Monarch Butterfly and Its Implications for Mimicry Theory.” The American Naturalist 131 (1988): S4–S6.

Brower, Lincoln P., and Susan C. Glazier. “Localization of Heart Poisons in the Monarch Butterfly.” Science 188, no. 4183 (1975): 19–25.

Brower, Lincoln P., Peter B. McEvoy, Kenneth L. Williamson, and Maureen A. Flannery. “Variation in Cardiac Glycoside Content of Monarch Butterflies from Natural Populations in Eastern North America.” Science 177, no. 4047 (1972): 426–429.

Fink, Linda S., and Lincoln P. Brower. “Birds Can Overcome the Cardenolide Defence of Monarch Butterflies in Mexico.” Nature 291, no. 5810 (1981): 67–70.Malcolm, S. B., and L. P. Brower. “Evolutionary and Ecological Implications of Cardenolide Sequestration in the Monarch Butterfly.” Experientia 45, no. 3 (1989): 284–295.

Malcolm, Stephen B. “Milkweeds, Monarch Butterflies and the Ecological Significance of Cardenolides.” Chemoecology 5, no. 3–4 (1994): 101–117.

Malcolm, Stephen B., Barbara J. Cockrell, and Lincoln P. Brower. “Cardenolide Fingerprint of Monarch Butterflies Reared on Common Milkweed, Asclepias Syriaca L.” Journal of Chemical Ecology 15, no. 3 (1989): 819–853.

Nelson, C. J., J. N. Seiber, and L. P. Brower. “Seasonal and Intraplant Variation of Cardenolide Content in the California Milkweed, Asclepias Eriocarpa, and Implications for Plant Defense.” Journal of Chemical Ecology 7, no. 6 (1981): 981–1010.

Roeske, C. N., J. N. Seiber, L. P. Brower, and C. M. Moffitt. “Milkweed Cardenolides and Their Comparative Processing by Monarch Butterflies (Danaus Plexippus L.).” In Biochemical Interaction between Plants and Insects, 93–167. Springer, 1976.

Zalucki, Myron P., Lincoln P. Brower, and Alfonso Alonso-M. “Detrimental Effects of Latex and Cardiac Glycosides on Survival and Growth of First-Instar Monarch Butterfly Larvae Danaus Plexippus Feeding on the Sandhill Milkweed Asclepias Humistrata.” Ecological Entomology 26, no. 2 (2001): 212–224.

The post Monarch Fallout and A Predator Story appeared first on Dyck Arboretum.


ADDENDUM
Karen Fulk had been tagging monarchs in the area at the time of this event, and wings of seven of her tagged monarchs were found among the scattering of wings in the area of intense feeding by the Mississippi kites. Curious to learn more, Karen made a search for all the wings she could find. She collected many, but some were evidently collected by others. Still, the collection gives us a rough idea of the total number killed and the sex ratio of those consumed.

Karen gave a quick look at the wings and concluded that the sample represented over 90 monarchs. Since it was of interest to determine the sex of each forewing to determine the sex ratio of the sample, Karen being less certain of those determinations, sent the collection to me.

The results of sorting the wings by sex and left verses right are given below.

  FOREWING HINDWING
Left Right Left Right
Male 37 43 43 36
Female 50 47 28 31

This tabulation suggests that AT LEAST 50 females and 43 males, or 93 in total, were killed and eaten by these birds while the monarchs were roosting in and passing through the arboretum. It would seem that the cardenolides had minimal effect, if any, on the feeding habits of these Mississippi kites. Curiously, I saw no signs of beak marks on any of the wings.


Bag of monarch forewings


Left and right female monarch hindwings


Hindwings of tagged monarchs eaten by Mississippi kites at the Dyck Arboretum 21-22 of September 2020.

Filed under Monarch Biology | Comments Off on Monarch coloration, milkweed toxins, and predation by birds