Monarch Watch Update April 2022
22 April 2022 | Author: Jim LovettThis newsletter was recently sent via email to those who subscribe to our email updates. If you would like to receive periodic email updates from Monarch Watch, please take a moment to complete and submit the short form at monarchwatch.org/subscribe/
Happy Earth Day, Monarch Watchers!
Included in this issue:
1. Monarch Watch Open House & Spring Plant Fundraiser
2. Follow Monarch Watch on LinkedIn
3. Monarch Population Status
4. Monarch Tag Recoveries from Mexico
5. Monarch Puzzle Wrap Up
6. Directional Flight
7. Free Milkweeds for Restoration Projects
8. About This Monarch Watch List
——————————————————
1. Monarch Watch Open House & Spring Plant Fundraiser
——————————————————
It’s here! Our annual Spring Plant Fundraiser is now online at https://spring.monarchwatch.org and we have thousands of plants looking for good homes. We are once again offering online ordering and contactless curbside pickup (or limited local delivery) for this event. To place an order you must live in, or be willing to travel to, LAWRENCE, KANSAS (we cannot ship). These plants are ideal for starting butterfly gardens or adding to established gardens and can contribute to the health of monarch and pollinator populations. Don’t miss out!
A complete list of plants and online ordering is available via the link below and pickup/delivery appointments are being scheduled for May 3-7.
Monarch Watch Spring Plant Fundraiser: https://spring.monarchwatch.org
We are also having an in-person component of our Spring Open House & Plant Fundraiser on Saturday, May 7th. This will be an outdoor-only event and there will be tours of our gardens, games, activities, monarch butterflies, caterpillars, and lots of butterfly plants available for your own garden! Complete details at https://monarchwatch.org/openhouse/
If you are not able to participate locally, we invite you to contribute to this annual fundraiser by donating to Monarch Watch via https://monarchwatch.org/donate
Thank you!
——————————————————
2. Follow Monarch Watch on LinkedIn
——————————————————
Monarch Watch has established a presence on LinkedIn so if you’d like make a connection and follow us on that platform, head on over to our new page at https://linkedin.com/company/monarchwatch and hit that Follow button!
See you there 🙂
——————————————————
3. Monarch Population Status —by Chip Taylor
——————————————————
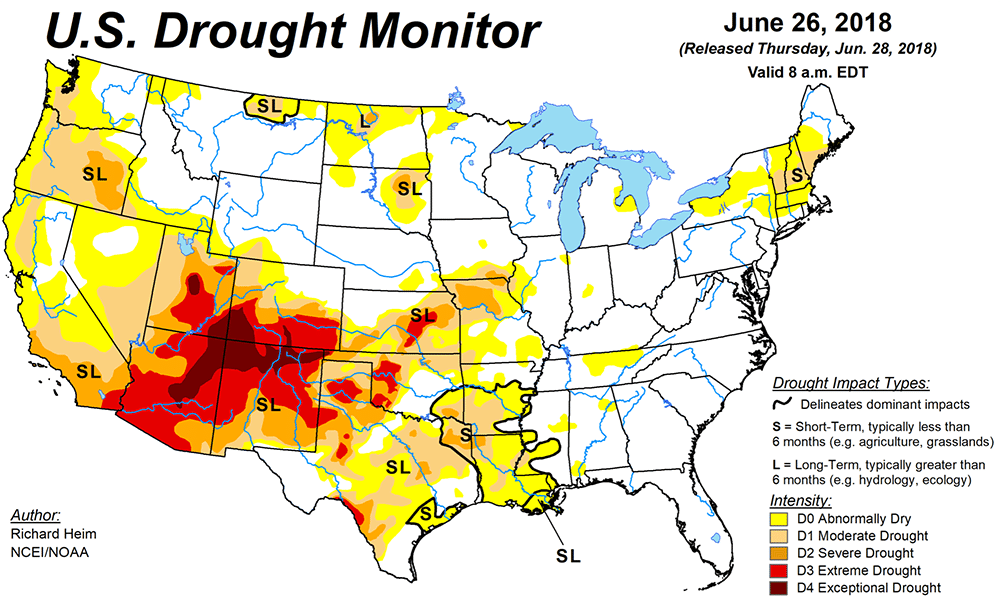
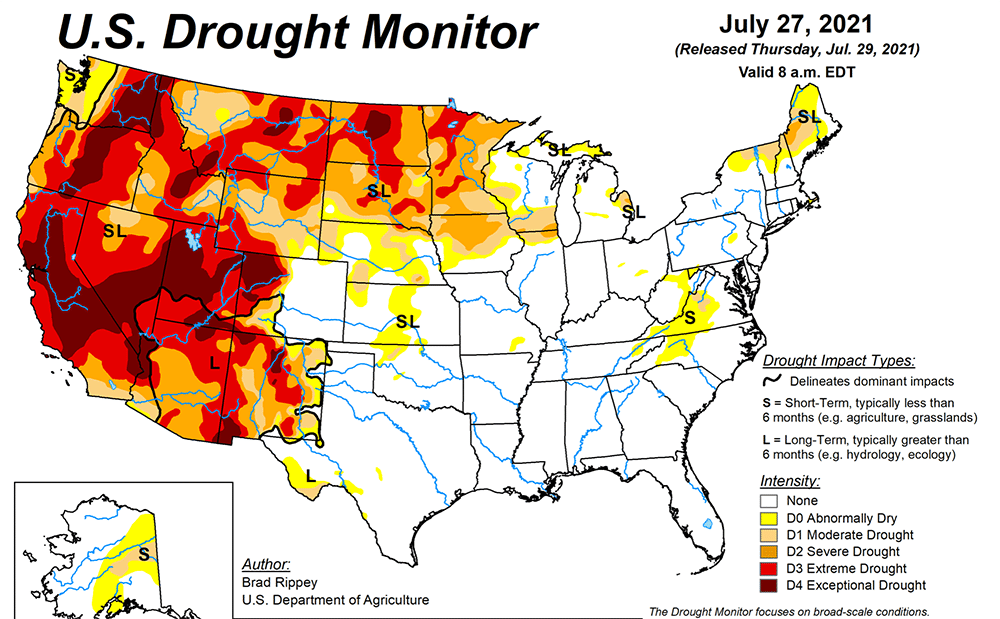
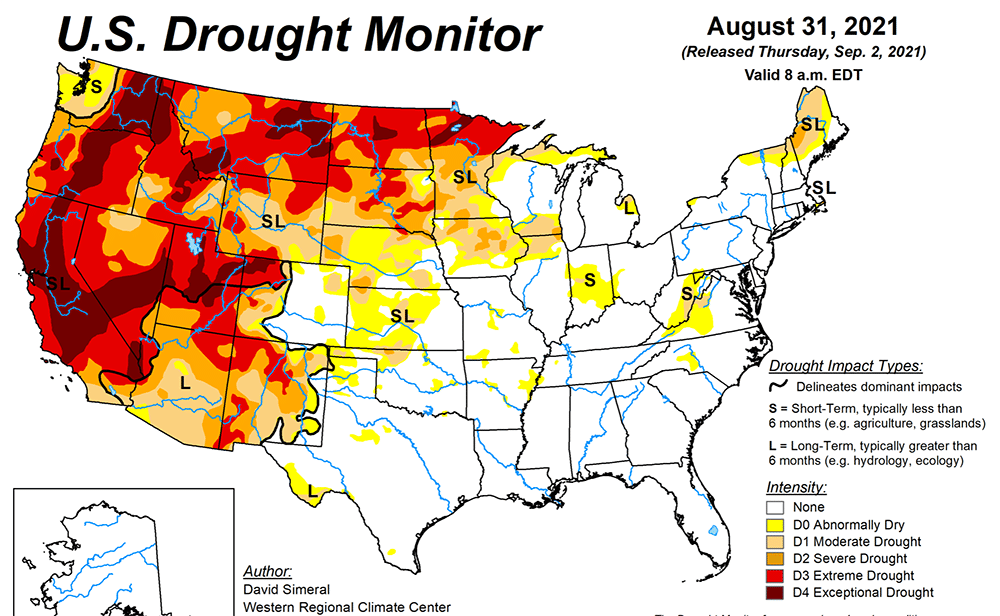
I have looked at a lot of monarch and weather data over the years in attempts to understand the factors that influence the development of the population. These factors include the number of monarchs returning to Texas from Mexico, whether the migration is early or late, the mean temperatures in March, the timing of the emergence of milkweeds, the abundance of nectar sources and the temporal and spatial distribution of egg laying by returning females. Additional weather-related factors include soil moisture and rainfall.
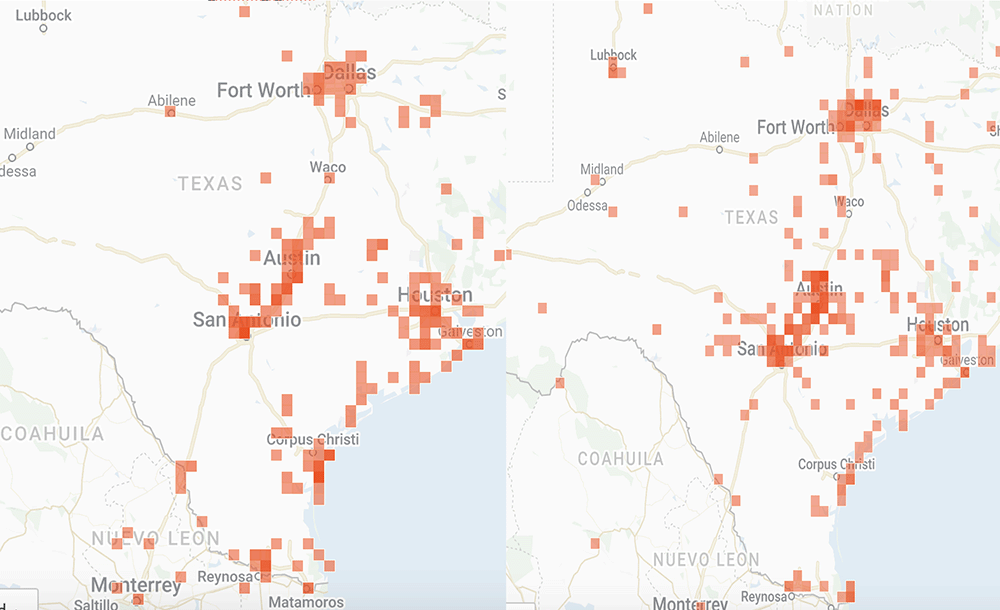
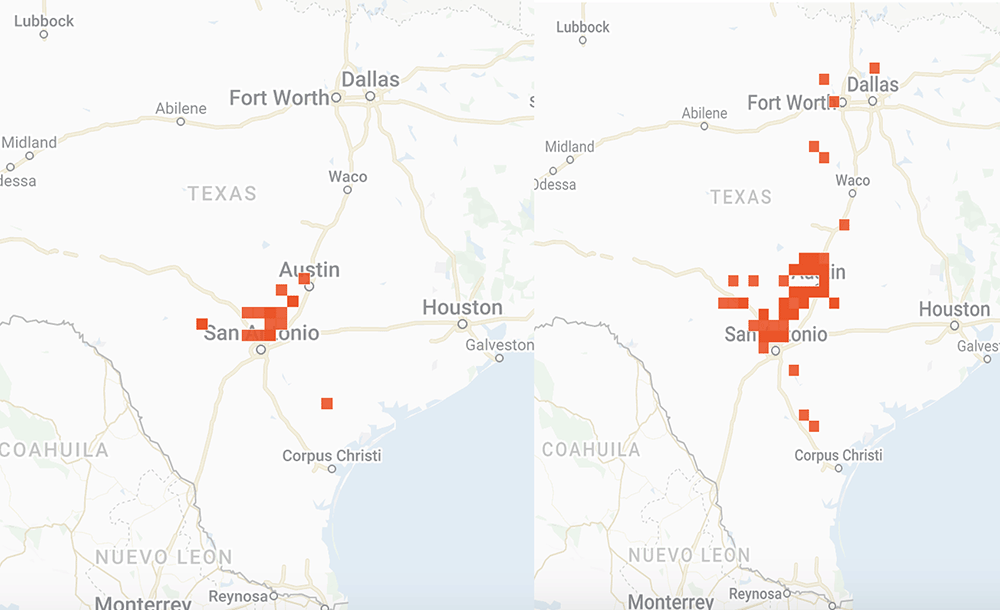
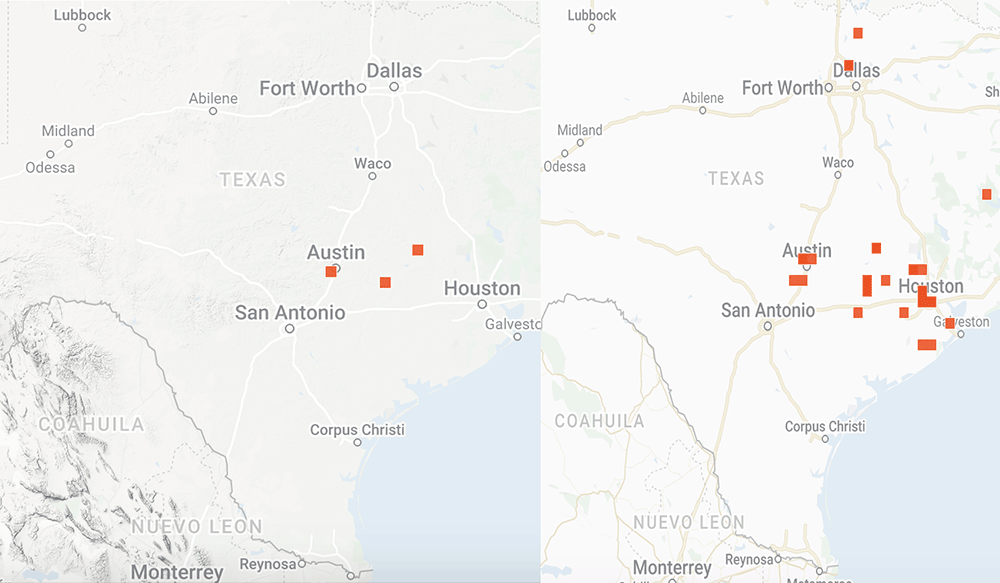
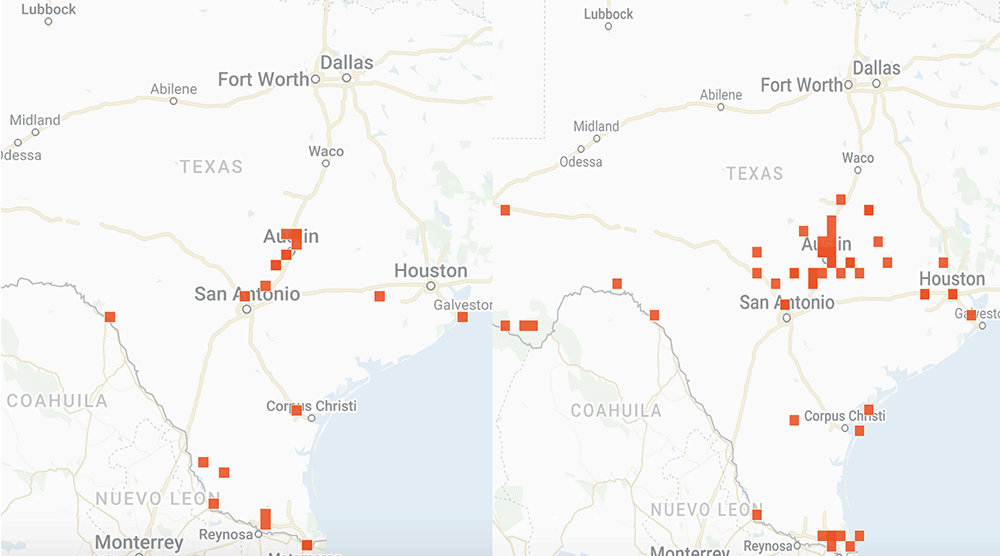
That’s a lot to track and it gets confusing when trying to sort through the data over decades since the impact of some factors is affected by others. For example, droughts have a greater impact when temperatures are high than when they are low. While it will take months to sort out how the population develops this year, I’ve put together some distribution maps of monarchs and milkweeds based on photos submitted to iNaturalist to see how the conditions this year compare to those in 2021. As you will see, the numbers this year do not compare well with last year. The numbers of returning monarchs were lower this past March and the numbers of photos of milkweeds were also lower. Monarchs seem to be well ahead of emerging milkweed.
Overall, the population doesn’t appear to be off to a good start. However, the numbers could be somewhat misleading. Last year, we had a special project with iNaturalist based on an attempt to determine how severely the massive freeze in Texas in February 2021 affected monarchs and nectar sources. It’s possible that our appeal for help last year generated an unusual number of submissions. Still, as I write (6 April), the first monarch has been reported in southern Kansas well ahead of the milkweeds.
Here are links to the reports generated through the collaboration with iNaturalist last year:
Monarchs and the freeze in Texas
https://monarchwatch.org/blog/2021/06/01/monarchs-and-the-freeze-in-texas/
Nectar plants used by monarchs during March in Texas
https://monarchwatch.org/blog/2021/05/25/nectar-plants-used-by-monarchs-during-march-in-texas/
And if you are interested in the distribution Maps I mentioned above, please see
https://monarchwatch.org/blog/2022/04/22/monarch-population-status-47/
——————————————————
4. Monarch Tag Recoveries from Mexico
——————————————————
We are in the process of vetting the tag recoveries from the overwintering sites in Mexico (about 900 of them in total) and we will post the complete list online very soon so stay tuned!
Monarch Watch tag recoveries: https://monarchwatch.org/tagrecoveries
——————————————————
5. Monarch Puzzle Wrap Up —by Chip Taylor
——————————————————
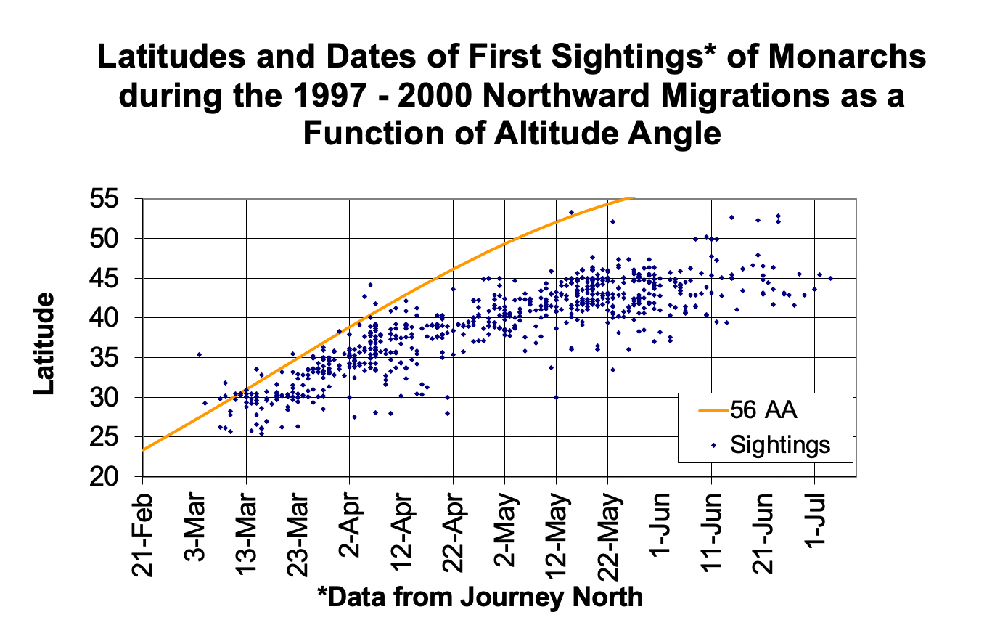
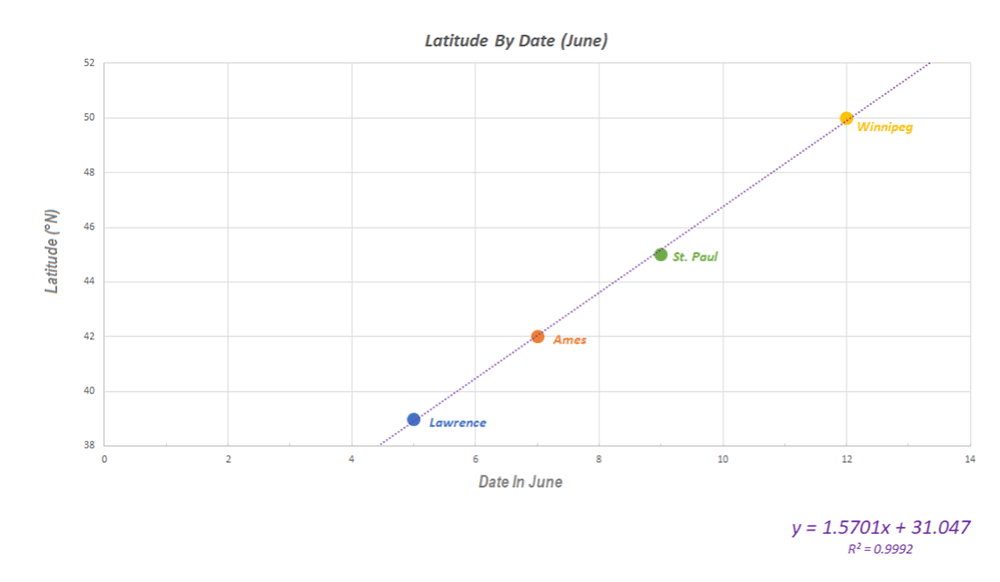
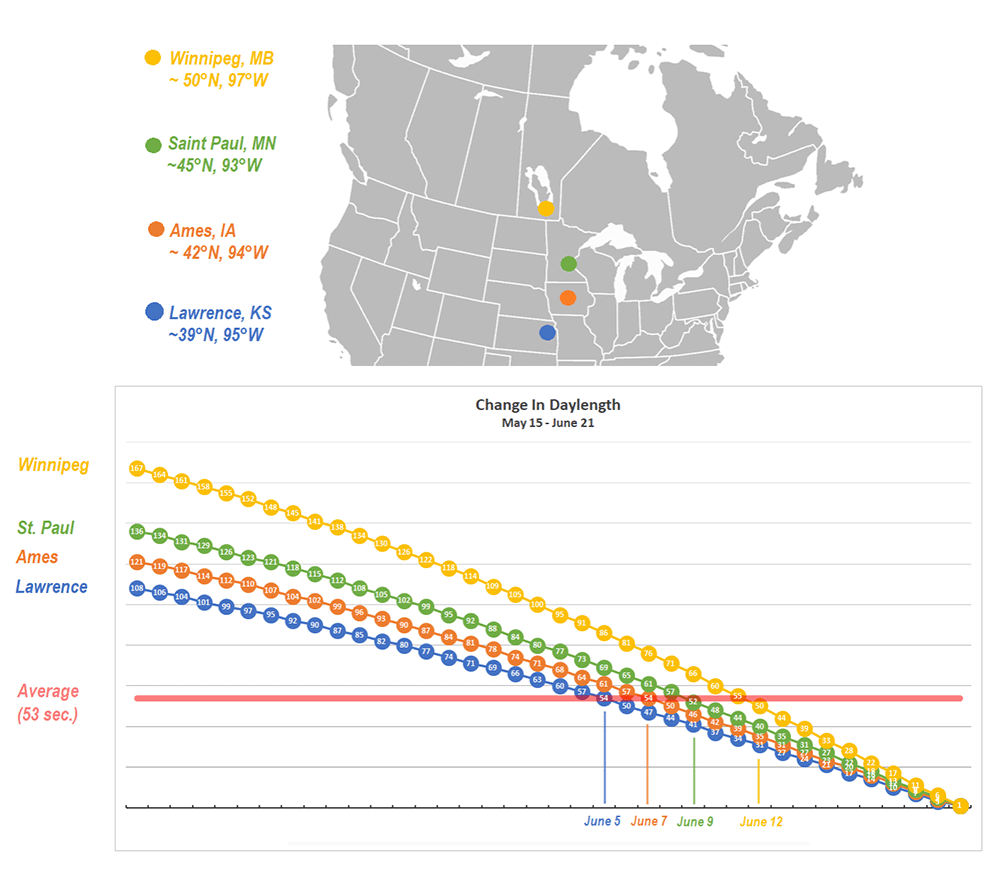
I want to thank all of you who participated in the puzzle. I challenged you to come up with the same possible explanation I did for why first-generation monarchs appear to stop directional flight on specific dates in June at different latitudes (cities). I had been thinking about the question for decades and it took me a long time to come up with the answer. I did so the hard way by looking at how a lot of variables changed with the change in the seasons. The answer ultimately was so simple that I couldn’t believe that I hadn’t thought of it. Many of you had difficulties as well. It comes down to conceptualizing what happens to day length in both the spring and early summer and later in the season from late summer through fall. I didn’t ask you to think about the symmetry of the seasonal changes, but it probably would have helped.
There were 22 submissions to the puzzle contest. I had intended to award the Mariposas board game to the first three participants with the correct answer or something close to it. It turned out that the puzzle was harder than I suspected and we had to go through three rounds in which I tried to leave word crumbs that participants could follow with each iteration. I finally had to admit that it’s difficult to conceptualize an increasing function that is progressively decreasing even though those are the seasonal conditions we live with twice a year and that many of us learned as children. So, for those who kept trying, and especially for those who seemed to be on the right track, I coached them by adding a few more word crumbs they could follow. Ultimately, I ended up awarding the Mariposas board game to 5 participants. One of the interesting things for me was the number of times when dealing with the answers I had to go back to suncalc.org to make some more calculations. The puzzle was a learning process for me as well as for many of the participants. From my standpoint, that’s a good outcome.
For a more complete discussion and puzzle wrap up please see
https://monarchwatch.org/blog/2022/04/22/monarch-puzzle-wrap-up/
——————————————————
6. Directional Flight —by Chip Taylor
——————————————————
As a follow-up to the puzzle challenge, the next steps involve teaching citizen scientists how to distinguish directional flight from meandering behavior. It’s distinctive, and once learned by volunteers, we can ask “flight spotters” to record whether they are seeing directional flight through May and June. We now have a hypothesis to test based on dates and latitudes. So, for any one site all an observer would have to do is record whether directional flight was observed (weather permitting) over the short period involved. I have already lined up one team in Michigan who will be making these observations. They will also be recording data from the nearest “Tempest” weather station in an effort to closely associate their observations with the behavior of the monarchs. Having a good location where the passing monarchs can be highlighted against the sky will be key. A compass will be needed as well.
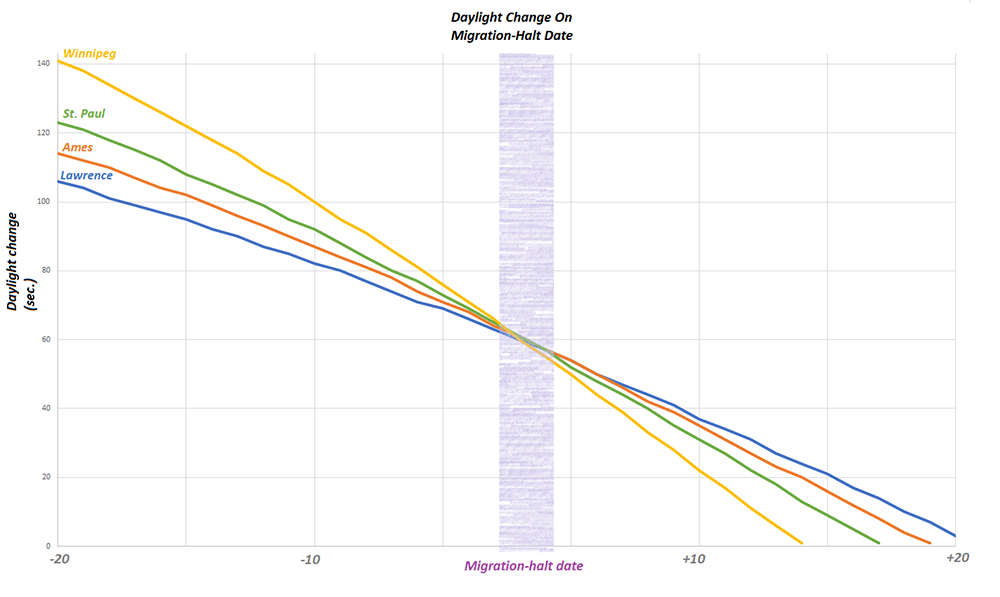
I should mention that the shut down of directional flight might not be as abrupt as suggested in the puzzle. Rather, there might be a decline in directional flight over several days rather than an abrupt cutoff. Since we would be looking for a behavior that is declining with fewer individuals showing directional flight each day, it may be difficult to identify the exact date when directional flight ceases at each location.
Oh, almost forgot. There is one more thing that makes me believe that this line of research is worth pursuing – the converse.
What is the rate of change from one day to the next when the monarchs first arrive at the overwintering sites in Mexico at the end of October? Again, the rate of change drops below 1 minute – ranging from -58 to -56 seconds from 29 Oct to 2 Nov at Angangueo. In this case, in contrast to stopping directional flight, the migration toward the overwintering sites continues southward through Mexico until sometime in early December when the change per day is about -20 seconds. That gives us another mystery, doesn’t it? Why would monarchs experiencing increasing daylength that is increasing at a decreasing rate stop directional flight while monarchs that are experiencing decreasing daylength that is decreasing at a decreasing rate keep flying? Every aspect of monarch biology seems to be complicated, doesn’t it?
——————————————————
7. Free Milkweeds for Restoration Projects
——————————————————
We are in need of CALIFORNIA applicants!
The Free Milkweeds for Habitat Restoration program focuses on distributing free milkweed plugs for large-scale habitat restoration projects throughout the range of the western monarch butterfly population in California and the eastern population east of the Rocky Mountains. The focus is on the main migration routes.
In California we currently have milkweed seed ecotypes for the Central Valley and Southern California. Only projects in these areas will be eligible for free milkweeds this spring. Projects must be a minimum of one acre.
More info and to apply: https://monarchwatch.org/free-milkweed-restoration
For projects east of the Rockies, the application is still open and there are a few milkweeds still available for 2+ acre projects.
——————————————————
8. About This Monarch Watch List
——————————————————
Monarch Watch ( https://monarchwatch.org ) is a nonprofit education, conservation, and research program affiliated with the Kansas Biological Survey & Center for Ecological Research at the University of Kansas. The program strives to provide the public with information about the biology of monarch butterflies, their spectacular migration, and how to use monarchs to further science education in primary and secondary schools. Monarch Watch engages in research on monarch migration biology and monarch population dynamics to better understand how to conserve the monarch migration and also promotes the protection of monarch habitats throughout North America.
We rely on private contributions to support the program and we need your help! Please consider making a tax-deductible donation. Complete details are available at https://monarchwatch.org/donate or you can simply call 785-832-7374 (KU Endowment Association) for more information about giving to Monarch Watch.
If you have any questions about this email or any of our programs, please feel free to contact us anytime.
Thank you for your continued interest and support!
Jim Lovett
Monarch Watch
https://monarchwatch.org
You are receiving this mail because you were subscribed to the Monarch Watch list via monarchwatch.org or shop.monarchwatch.org – if you would rather not receive these periodic email updates from Monarch Watch (or would like to remove an old email address) you may UNSUBSCRIBE via https://monarchwatch.org/unsubscribe
If you would like to receive periodic email updates from Monarch Watch, you may SUBSCRIBE via https://monarchwatch.org/subscribe
This e-mail may be reproduced, printed, or otherwise redistributed as long as it is provided in full and without any modification. Requests to do otherwise must be approved in writing by Monarch Watch.
Filed under Email Updates | Comments Off on Monarch Watch Update April 2022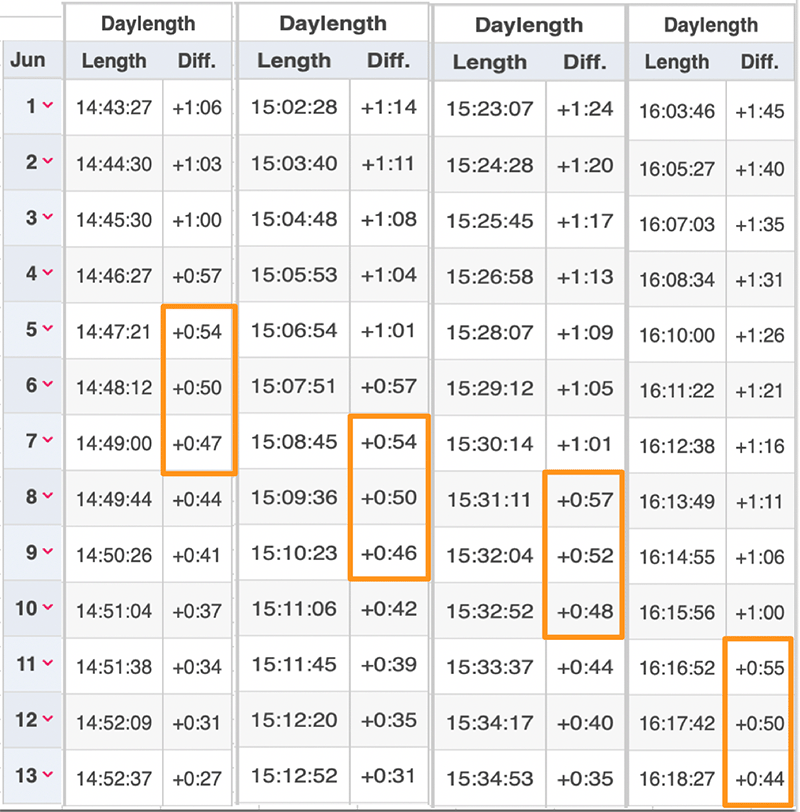
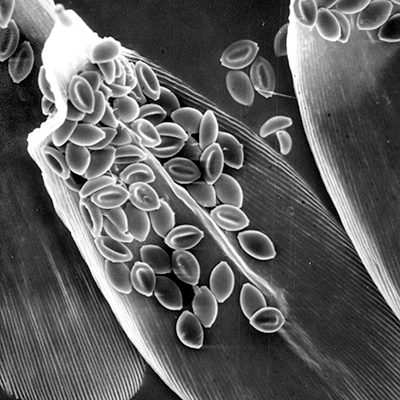 There have been many papers written on the relationship between monarchs and their neogregarine parasite Ophryocystis elektroscirrha, hereafter referred to as O.e. These papers have covered a number of topics including, infection rates, how spores are distributed by infected adults, how the relative attractiveness and overwintering persistence of tropical milkweed appears to contribute to the frequency of O.e., the relationship of sublethal infections on the fitness of monarchs, especially as it determines the ability to migrate, and frequency as it relates to continuous breeding and geographic distributions and others. These studies constitute a useful baseline or foundation for further studies. In this short article, I’m going to argue that to fully understand the relationship between monarchs and O.e. we need a more comprehensive approach, one that accounts for the seasonal and geographic dynamics of the monarch population, the density and frequency dependent interactions in the system, the impacts of other predators and parasites and the effects of weather on the outcomes. While I’m advocating a holistic approach, I’m not attacking the research conducted to date nor am I claiming to have the answers. However, I do feel that a broader understanding of the complexities of the interactions in monarchs’ annual cycle and its interactions with all components in the system will be helpful. There are some obvious relationships that are begging for data.