How many hectares in 2021-2022?
Thursday, January 6th, 2022 at 12:30 pm by Chip TaylorFiled under Monarch Population Status | Comments Off on How many hectares in 2021-2022?
Each year, at about this time, I administer a test – to myself. I have one question. How big, in term of hectares*, will the overwintering population be this year? Technically, I fail the test every time and expect to. Realistically, it would be virtually impossible to correctly predict the overwintering numbers given the number of variables involved in each migration. For example, there is no way to predict the weather conditions in Mexico that determine how tightly the monarchs are clustered when measured during mid-December. There are other variables in Mexico as well – such as the density of the forest. What I’m alluding to is that a hectare in one part of the forest could represent a widely different number of monarchs from a hectare in another location. So, the bottom line is that everything is an estimate, and we don’t know how well the hectares from one year compare to those of another. While that is true, the hectare measure seems to represent the size of the population fairly well. For example, the number of monarchs tagged in the Midwest each fall is strongly correlated with the overwintering number. That would not be true if there was a lot of error in the number of hectares and the number of butterflies per hectare following each migration.
So, if the number of tagged butterflies can be used to predict the overwintering population, why don’t I just use those numbers as predictors? Unfortunately, it takes months and months to assemble all the tagging records for a given year. Therefore, I have to look to other measures or conditions and draw on the historical record to arrive at a prediction. The conditions during the spring in Texas, the recolonization of the northern breeding areas in May, the summer temperatures, the weather during the migration and the availability of nectar sources in Texas all differ from year to year and all factor into the number of monarchs that reach the overwintering sites. The challenge for me is to assess each of these conditions for a given year and to compare these outcomes with the record that goes back to 1994.
After considering all of these factors for this past season, I came up with the following estimate – 0.8-1.2 hectares. Ouch! That’s low and lower than the 2.01 hectares measured last year. In fact, if 1.2 hectares this year, that would be the lowest number since the winter of 2014-2015. I know that that is not what anyone wants to hear, and I don’t want to accept those numbers myself, but that is what my assessment tells me. My history with these estimates is fair, but I usually underestimate the size of the population which means that I’m overestimating the negative impact of one or more factors. These over and under estimates speak to my goal which is to develop a deep understanding of all the factors that determine the size of the population. Being wrong goes along with learning how to refine my estimates. Last year my estimate for the hectare total was almost spot on – 2.0 hectares vs a measured 2.01 hectares. It was more of a guess than a data-based prediction, but I’ll take credit for being close. There are reasons to think I will be close again this year and other reasons to predict that the number will be higher.
In the following paragraphs I’ll summarize the reasons for why my prediction might be right or wrong. Although I evaluate data from the entire range of the eastern monarch range, my prediction is largely based on what I can glean about the colonization and population growth that occurs from 90-100W – a region from just west of Madison, WI to the central Dakotas. Tagging results indicate that about 70% of the monarchs that reach the overwintering sites originate from this region.
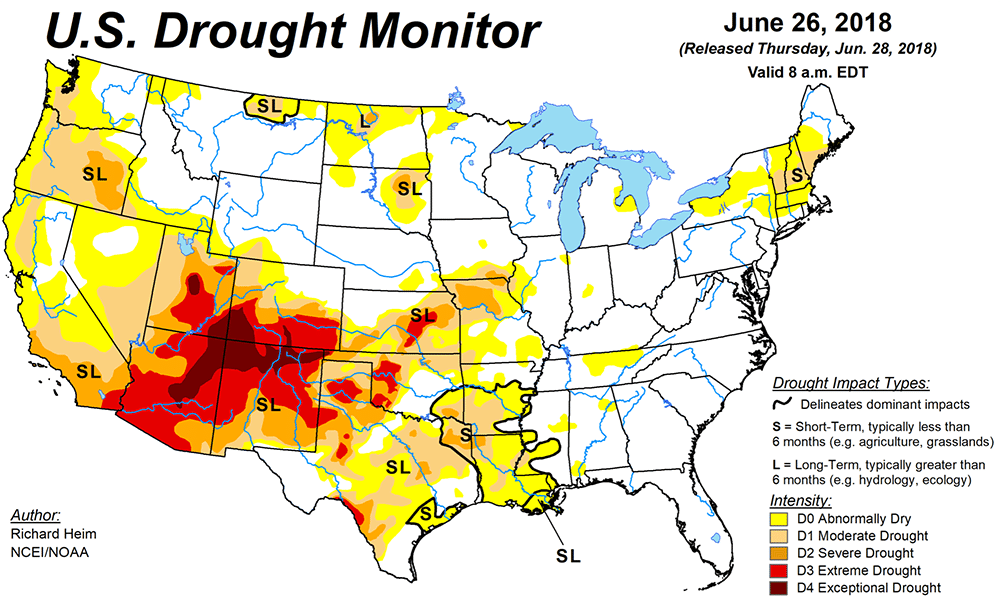
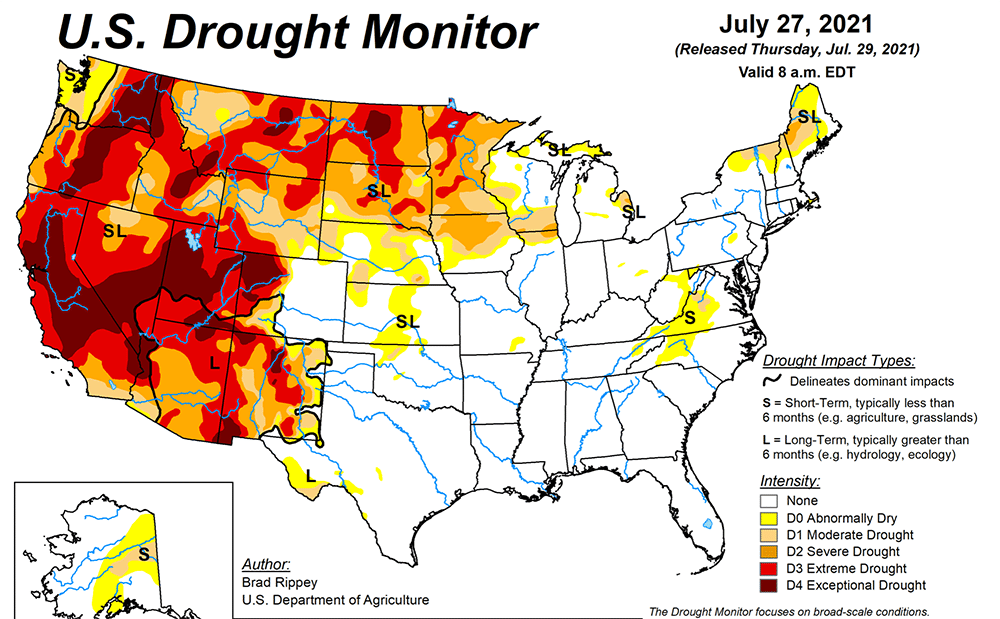
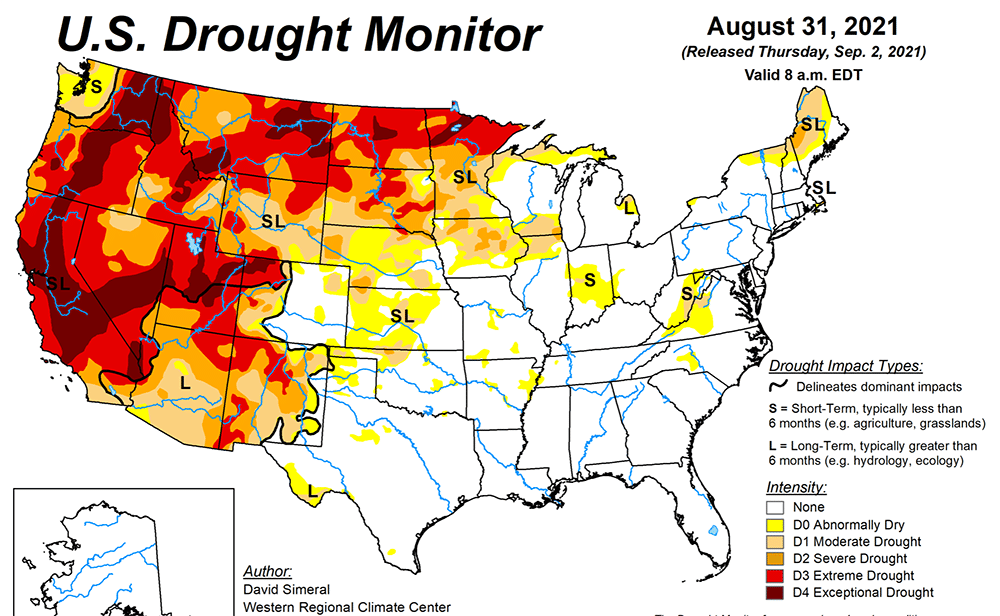
There are several reasons the monarch numbers at the overwintering sites might be lower this winter than in recent years. First, as shown in the drought monitor images for this past summer (Figs 1-3), there was a severe drought in the Dakotas that extended eastward well into Minnesota. Droughts have a strong negative impact on monarch population development since plant growth is stunted, plant quality declines and nectar is more limited. These conditions decrease monarch longevity and reproductive success. High temperatures, which often accompany drought conditions, also negatively influence population growth. This year, the first sightings posted to Journey North indicated that monarchs arrived in the northern breeding areas on time and in good numbers. However, post arrival, the regional and state temperatures were substantially above the long-term averages for June through August. For example, the average temperatures were +3.1F for the Upper Midwest, +1.2F of the Ohio Valley and +2.8F for the Northeast. The temperatures in the states in the drought areas were +4.3 for North Dakota, +3.9 for South Dakota and +3.8F for Minnesota. The temperature for Minnesota was the second highest since 1895. The temperatures are significant since the record shows that populations decline when the mean temperatures exceed +2F. These above average temperatures persisted into September in the Upper Midwest and the effect was to delay the migration. Again, the tagging data shows that late migrations are associated with lower numbers reaching the overwintering sites.
As to numbers in the migration, Journey North tallies the number of roosts reported by observers. These sightings include estimates of the number of monarchs. A quick scan of these estimates suggested that the numbers for all sightings this year were about half those in 2020. The observations by Harlen and Altus Aschen near Port Lavaca, TX suggested that the flow of monarchs along the Gulf coast, many of which probably originated from the Northeast, was late and involved a relatively small number of monarchs.
In summary, all of the metrics used to assess the size of the summer and migratory populations indicated that the population reaching the overwintering sites would be substantially lower than the number measured in 2020.
There are also reasons why my estimates might be overly pessimistic. A recent report from El Rosario offered that the population this year was about a third larger than last year. Further, in early December, the counts of trees occupied by monarchs at Chincua, Cerro Pelon and Herrada were all greater than I would have expected based on my assessments. We will have to wait for the official counts. I’d be delighted to be wrong – on the low side that is.
*One hectare is equal to 2.47 acres. One acre is approximately the area of a football field exclusive of the end zones.

Figure 1. June Drought Monitor

Figure 2. July Drought Monitor

Figure 3. August Drought Monitor


Sorry, comments for this entry are closed at this time.