Monarch Watch Blog

IUCN Red List and the status of monarchs

21 July 2022 | Author: Jim Lovett

The recent news about the IUCN’s Red List does not change the status of monarchs in the U.S. In a December 15, 2020 press release, the U.S. Fish and Wildlife Service announced its decision with respect to the petition to declare the monarch a “threatened” species under the Endangered Species Act:

“After a thorough assessment of the monarch butterfly’s status, the U.S. Fish and Wildlife Service (Service) has found that adding the monarch butterfly to the list of threatened and endangered species is warranted but precluded by work on higher-priority listing actions. With this decision, the monarch becomes a candidate for listing under the Endangered Species Act (ESA), and its status will be reviewed each year until it is no longer a candidate.”

Upon that announcement, we wrote that the “warranted but precluded” decision for monarchs is the right one at this time. It acknowledges the need for continued vigilance due to the numerous threats to the population while emphasizing the need to continue support for programs that create and sustain habitats for monarchs. It also should be clear that it is the North American monarch migration that is threatened and not the species, which is widely distributed in the Americas and elsewhere.

Please see our full response to this posted via our blog at monarchwatch.org/blog/2020/12/15/esa-listing-decision-for-the-monarch/

Thank you for your interest and concern!

Filed under Monarch Conservation | Comments Off on IUCN Red List and the status of monarchs

Monarch numbers in Mexico: predictions and reality

24 May 2022 | Author: Chip Taylor

I was wrong, really, really wrong, and I’m happy about it. The numbers are in and they are much greater – 2.84 hectares – than I predicted. In my January 6 post “How many hectares in 2021-2022?“, I went to great lengths to explain why I expected the overwintering monarch numbers to be somewhere close to 0.80-1.2 hectares. I based my expectations on the anticipated impact of the drought in much of the Upper Midwest last summer, the extreme temperatures in July and August in that region, the later than average migration, the lower number of roosts reported to Journey North and the lack of emails declaring that large numbers of monarchs had been seen. None of those metrics hinted at a population larger than the 2.1 hectares recorded in 2020. Everything tended lower.

So, how did these metrics fail me or how did I fail to grasp their meaning? I’m not sure. I’ll try to reassess my approach. Alternatively, are there better metrics? The answer is yes. In the future, I will be using a different set of measures, ones that appear to be better at predicting how the population develops each year. Or, maybe I should follow John Pleasant’s lead and work out a way to count “eggs per stem” at a specific time each year. That’s what John does near Ames, Iowa and his predictions are often better than mine. This year, John wrote “My estimate was 2.1 with a margin that topped out at about 3”. Not bad – 2.84 vs “about 3”. Beats me!

Filed under Monarch Population Status | Comments Off on Monarch numbers in Mexico: predictions and reality

Monarch Population Status

24 May 2022 | Author: Jim Lovett

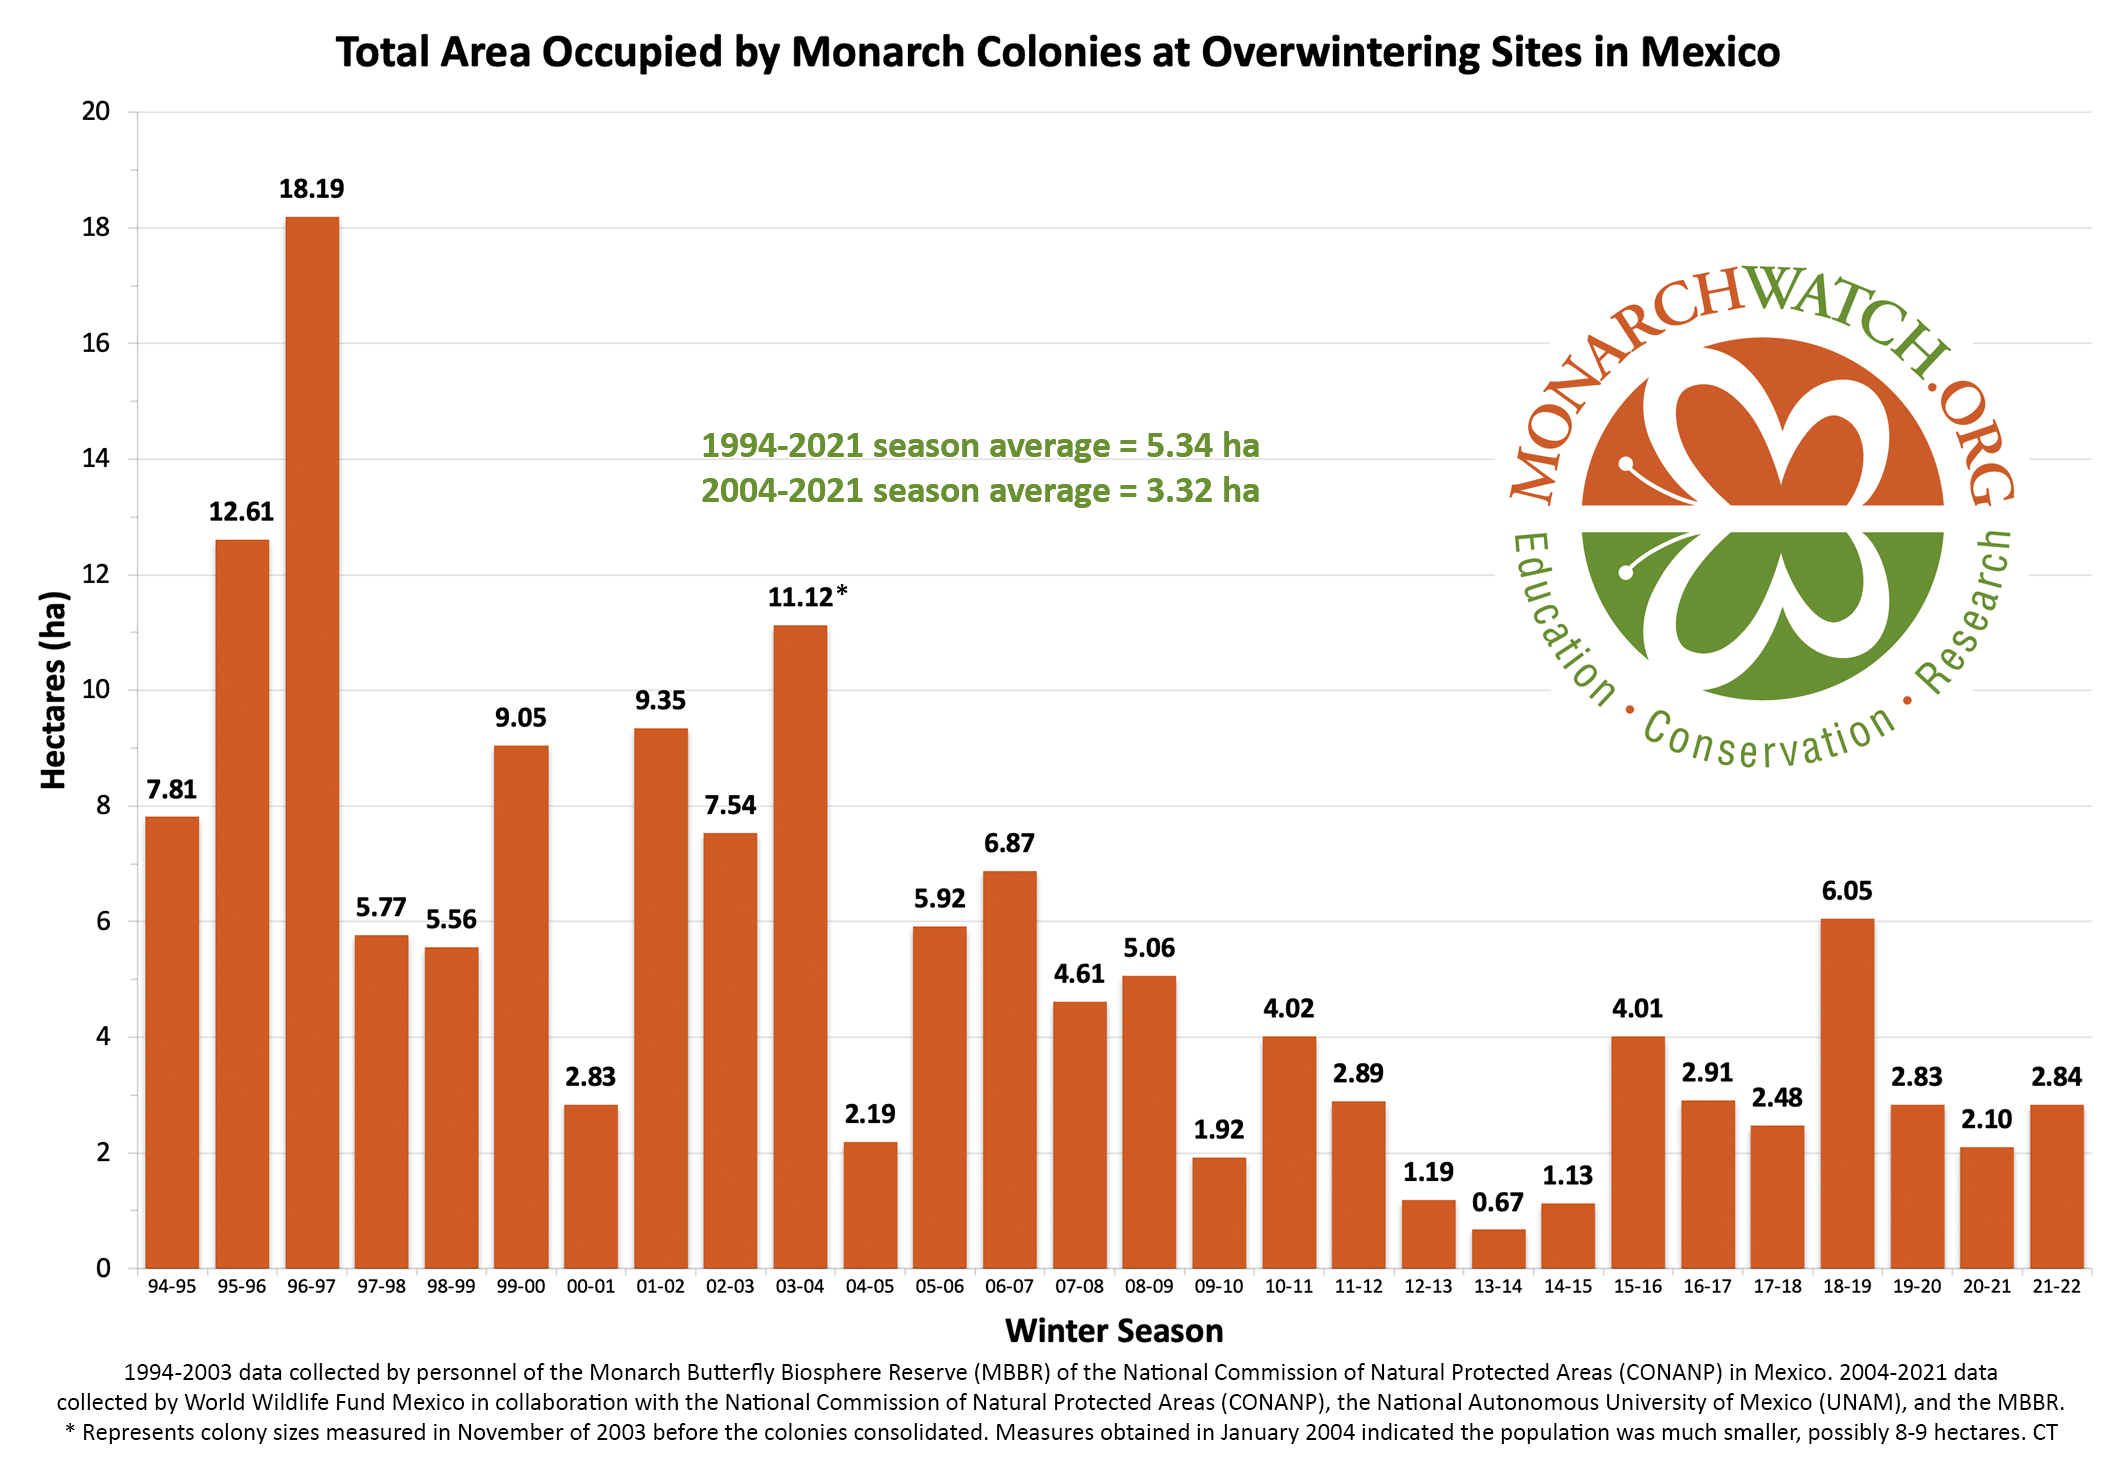
The WWF-Telmex Telcel Foundation Alliance, in collaboration with the National Commission of Natural Protected Areas (CONANP), the National Autonomous University of Mexico (UNAM), and the Monarch Butterfly Biosphere Reserve (MBBR), announced the total forest area occupied by overwintering monarch colonies today. Ten (10) colonies were located this winter season with a total area of 2.84 hectares, a 35% increase from the previous season (2.10 ha):

monarch-population-figure-monarchwatch-2022
Figure 1. Total Area Occupied by Monarch Colonies at Overwintering Sites in Mexico.

WWF notice: Aumenta 35% la presencia de mariposas Monarca en los bosques de hibernación de Michoacán y el Estado de México

Report (spanish): Monitoreo de la colonias de hibernación de la mariposa monarca en México

WWF story: Eastern monarch butterfly population shows signs of recovery

Report (english): Areas of forest occupied by the colonies of monarch butterflies in Mexico during the 2021-2022 overwintering period

The WWF-TELMEX Telcel Foundation Alliance collaborates with CONANP to systematically monitor the hibernation of the Monarch since 2004, and they join the Institute of Biology of the National Autonomous University of Mexico (UNAM) to analyze changes in forest cover in the area core of the Monarch Butterfly Biosphere Reserve in order to have scientific bases that support the implementation of conservation strategies for the benefit of the species, ecosystems and human beings.

Filed under Monarch Population Status | Comments Off on Monarch Population Status

Monarch Watch Update May 2022

21 May 2022 | Author: Jim Lovett

This newsletter was recently sent via email to those who subscribe to our email updates. If you would like to receive periodic email updates from Monarch Watch, please take a moment to complete and submit the short form at monarchwatch.org/subscribe/

Greetings, Monarch Watchers!

Included in this issue:
1. Monarch Watch Open House & Spring Plant Fundraiser
2. Follow Monarch Watch on LinkedIn
3. Monarch Population Status
4. Monarch Tag Recoveries from Mexico
5. When monarchs are like corn
6. New Project: Monarch Directional Flight
7. About This Monarch Watch List

——————————————————
1. Monarch Watch Open House & Spring Plant Fundraiser
——————————————————

Monarch Watch hosted its first in-person Open House and Plant Fundraiser since 2019 on May 7th. An enthusiastic turnout for the presale (online orders and local pickup) and in-person event made it our biggest plant fundraiser ever! In addition, hundreds of visitors enjoyed outdoor family activities and displays, including seed ball making, a kids’ activity guide, butterfly card craft, emergence of monarch butterflies, and lots of caterpillars to see. The Douglas County Extension Master Gardeners were on hand for garden tours and to help visitors choose the right butterfly plants for their gardens and the KU Natural History Museum also participated by hosting a booth.

Thank you to everyone who made this year’s event a success – see you next spring!

——————————————————
2. Follow Monarch Watch on LinkedIn
——————————————————

Monarch Watch has established a presence on LinkedIn so if you’d like make a connection and follow us on that platform, head on over to our new page at https://linkedin.com/company/monarchwatch and hit that Follow button!

See you there 🙂

——————————————————
3. Monarch Population Status
——————————————————

We are eagerly awaiting the official report from WWF-Mexico with the 2021 overwintering season monarch population numbers and we anticipate we will have that for you in the near future. As soon as the news breaks, it will be reported via our blog and Facebook page so stay tuned!

Monarch Watch Blog: https://monarchwatch.org/blog

Monarch Watch Facebook: https://facebook.com/monarchwatch

In the meantime, be sure to check out the recent “Development of the 2022 monarch population so far” blog post at https://monarchwatch.org/blog/2022/05/18/development-of-the-2022-monarch-population-so-far/

——————————————————
4. Monarch Tag Recoveries from Mexico
——————————————————

More than 900 Monarch Watch tags were recovered from monarch overwintering sites in central Mexico during the 2021 tagging season. All of the tags have been examined and the “Tag recoveries from central Mexico” list has been updated. By default, this list is sorted by the report season then by tag code and now includes nearly 21,000 records.

Get out your tag codes and check out the updated list 🙂

Monarch Watch tag recoveries: https://monarchwatch.org/tagrecoveries

As a reminder, it is never too late for data so if you have not yet submitted your records, please do so at your earliest convenience via https://monarchwatch.org/tagging

Thank you to everyone who tagged monarchs in 2021 and also those who assisted with the recovery efforts!

——————————————————
5. When monarchs are like corn —by Chip Taylor
——————————————————

I’m going to tell you why and when monarchs are like corn. It’s been on my list to do so for some time. A recent headline gave me the motivation to start this discussion. Let’s start with the obvious, corn doesn’t fly, lay eggs, visit flowers or migrate, but it does grow and every farmer knows that yields are dependent on numerous factors and that two of the most important are timing of planting and temperatures. There’s the similarity – timing and temperature.

The existence of data on both monarchs and corn that can be related to temperatures and weather extremes allows for many comparisons. Similar relationships surely exist for a large number of co-occurring plants and animals.

Explore the complete “When monarchs are like corn” article at https://monarchwatch.org/blog/2022/05/17/when-monarchs-are-like-corn/

——————————————————
6. New Project: Monarch Directional Flight
——————————————————

During the spring and mid-summer migrations, there are powered directional flights with no gliding and soaring. Most flight is rapid at speeds of 10-12 mph at 4-10 meters above the ground. Nectaring occurs mostly in the morning and late afternoon. There is some mating and egg laying as these migrations progress. These migrations appear to advance at rates of 30-55 miles per day. In the spring, there are two generations of migrants, the monarchs returning from Mexico have headings that are primarily to the N and NE. This migration generally ends with the death of most of the overwintered monarchs by the end of April. The offspring of the overwintered migrants begin to reach maturity at the end of April and they too tend to move to the N and NE. It is these first-generation monarchs that recolonize the northern breeding area. Curiously, this migration appears to stop at different latitudes as the season progresses northward. This observation gives rise to several questions: do they stop and, if so, when do they stop and why?

Monarch Watch is seeking the immediate assistance of monarch enthusiasts (community scientists) in collecting directional flight observations of monarchs in their area during the spring migration in May and June. Register today to participate!

Complete details are available on the project’s page at https://monarchwatch.org/directional-flight/

——————————————————
7. About This Monarch Watch List
——————————————————

Monarch Watch ( https://monarchwatch.org ) is a nonprofit education, conservation, and research program affiliated with the Kansas Biological Survey & Center for Ecological Research at the University of Kansas. The program strives to provide the public with information about the biology of monarch butterflies, their spectacular migration, and how to use monarchs to further science education in primary and secondary schools. Monarch Watch engages in research on monarch migration biology and monarch population dynamics to better understand how to conserve the monarch migration and also promotes the protection of monarch habitats throughout North America.

We rely on private contributions to support the program and we need your help! Please consider making a tax-deductible donation. Complete details are available at https://monarchwatch.org/donate or you can simply call 785-832-7374 (KU Endowment Association) for more information about giving to Monarch Watch.

If you have any questions about this email or any of our programs, please feel free to contact us anytime.

Thank you for your continued interest and support!

Jim Lovett
Monarch Watch
https://monarchwatch.org

You are receiving this mail because you were subscribed to the Monarch Watch list via monarchwatch.org or shop.monarchwatch.org – if you would rather not receive these periodic email updates from Monarch Watch (or would like to remove an old email address) you may UNSUBSCRIBE via https://monarchwatch.org/unsubscribe

If you would like to receive periodic email updates from Monarch Watch, you may SUBSCRIBE via https://monarchwatch.org/subscribe

This e-mail may be reproduced, printed, or otherwise redistributed as long as it is provided in full and without any modification. Requests to do otherwise must be approved in writing by Monarch Watch.

Filed under Email Updates | Comments Off on Monarch Watch Update May 2022

Development of the 2022 monarch population so far

18 May 2022 | Author: Chip Taylor

Predicting how the population will develop each year is a challenge. As recently as the 22nd of April, we posted a rather dismal account of the status of the population. This assessment was based on reports to Journey North, iNaturalist and from some emails received from people in Texas. Overall, there wasn’t a lot of reason to be optimistic.

As one who is trying to understand how the population functions, I get into trouble when I rely too much on the available data. There may be another example of such over-reliance in what happened in early May – a dramatic early advance of first-generation monarchs into the summer breeding area north of 40 North. The paragraphs below summarize what I posted to Dplex-L on the 11th of May. That will be followed by a brief account of how this rapid colonization compares with that of other years and what it could mean for the rest of the breeding season.

The big push of 9-10 May 2022

If you follow monarchs closely, you are aware that there have been numerous reports to Journey North of monarchs being sighted north of 40N (roughly the latitude of St Joseph, MO) in the last two days. These sightings are significant for three reasons. First, because this advance represents colonization of the area north of 40N – the primary area that produces the migratory population that reaches Mexico in Oct-Dec. Second, this advance is a bit earlier than usual. And third, this advance was extraordinarily fast.

I have put together some quick notes to provide some context to what happened during 9-10 May.

There were 44 reports to JN in 9-10 May and of those 42 were in the Midwest and N of 40N.

Most sightings were from 41-42N with one at 45.1N

In contrast, there were only 9 reports from 7-8 May with 6 in the Midwest and only 1 >40N

Most sightings (N=13) from 1 May through 8 May in the Midwest were from 38-39N.

There are 69 miles (111 km) per degree of latitude. The calculations are rough, and only provide an estimate, but if we average 38-39N as a starting point (38.5) and 41-42N as the end point (41.5), that means that the population advanced approximately 207 miles (333 km) in two days. That said, 14/44 of the sightings were from >43N indicating that a number of the monarchs may have advanced more than 300 miles in 2 days.

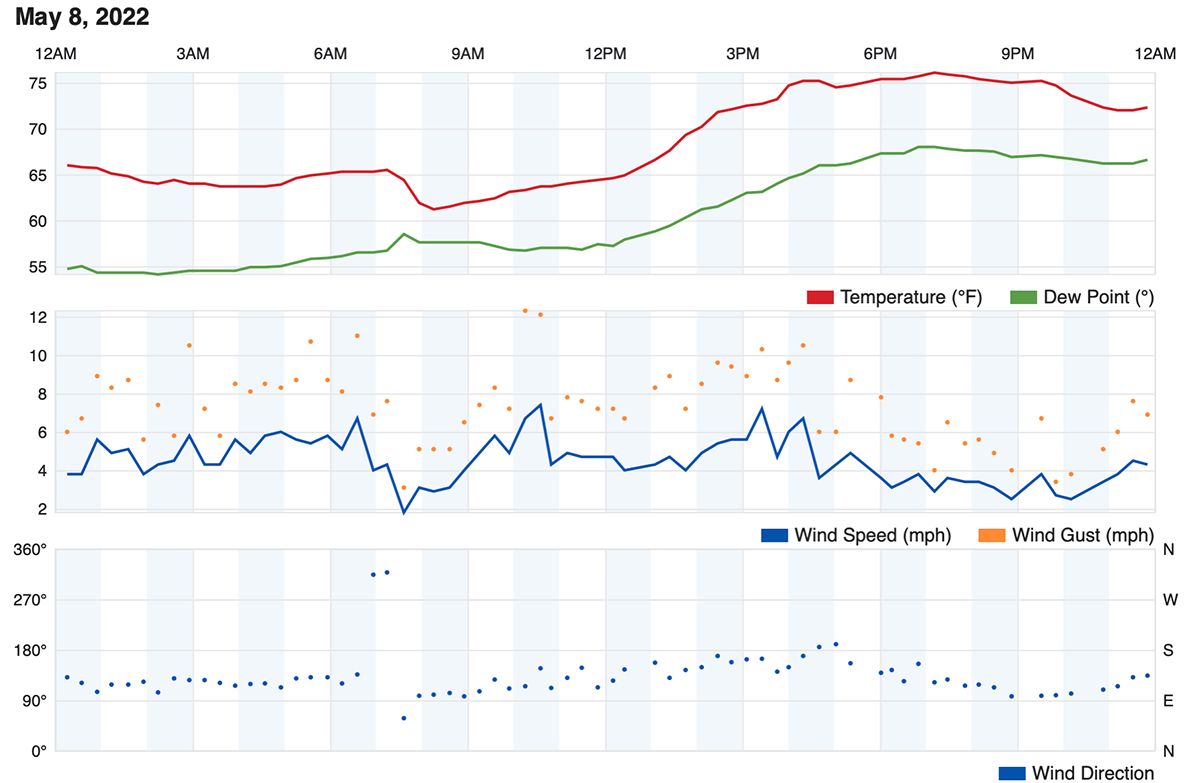
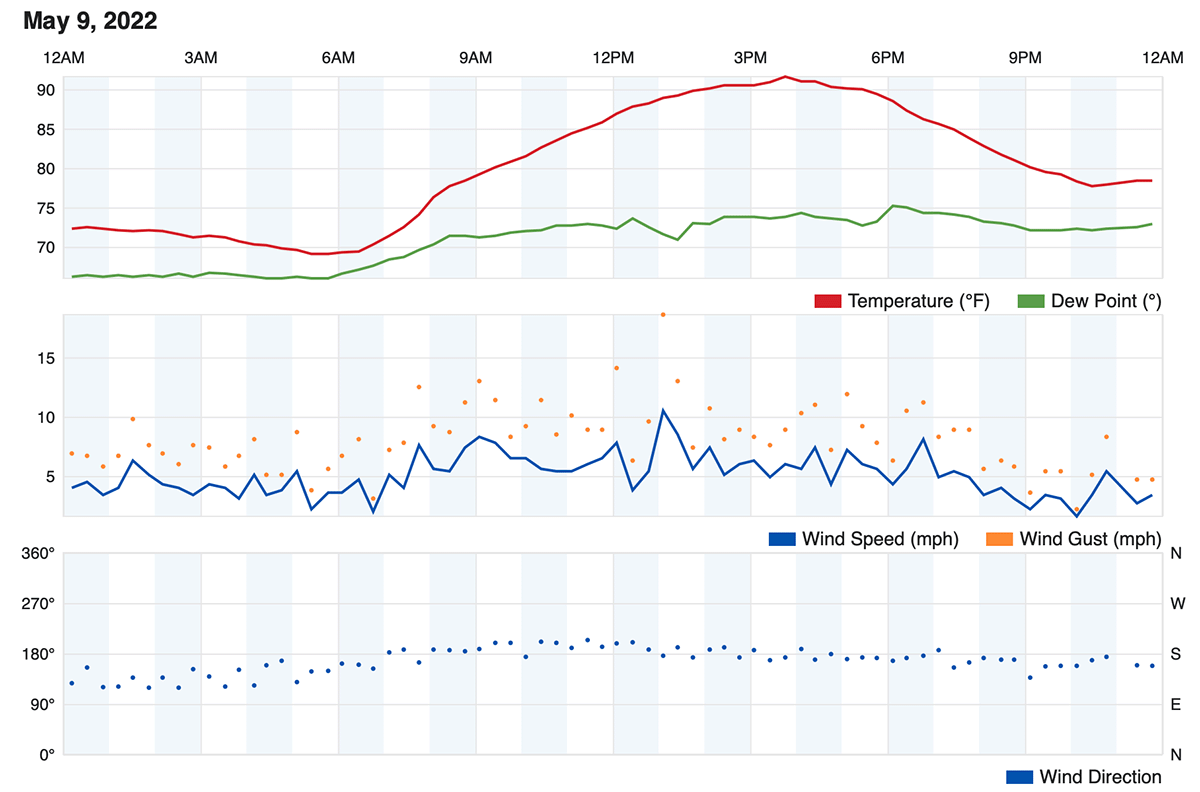
This movement was aided by strong winds mostly from the south and southwest – see below. This rate of advance rivals that seen in early April 2017 when there was a similar wind aided advance that carried monarchs from northern Oklahoma to mid Nebraska, again a distance of approximately 300 miles.

As in 2017, the newly arriving monarchs N of 40N are well ahead of the emergence of milkweeds with few emerged north of mid Iowa except in burned over areas and some gardens. The difference between that advance and this one is that the former involved butterflies returning from Mexico while this one involves first-generation offspring migrating north from Texas. Being young and still maturing, the first-generation migrants should be able to “wait” for the emergence of milkweeds in these northern areas.

Below are graphs of the temperature, wind speed and wind direction data from my weather station in Berryton, Kansas from 8 through 10 May. The pattern for the 8th was typical for this area and date. The records for the 9th and 10th show extremely gusty winds along with temperatures well above the long-term average.

May 8, 2022

May 9, 2022

May 10, 2022

The timing of the colonization of the northern breeding areas varies from year to year. There are both early and late years. Early years are of interest because they have the potential to give a jump start to the development of a large population. The most recent early year was 2018 which was followed by the largest overwintering population (6.05 hectares) since 2006 (6.87 hectares). However, being early can have negative consequences. The 2012 recolonization appears to have been too early, well in advance of the emergence of milkweeds and a recolonization that involved a number of partially reproductively spent monarchs that returned from Mexico rather than a cohort only of newly emerged first-generation monarchs with a substantial reproductive capacity. The overwintering count during the winter of 2012-2013 as only 1.19 hectares. (There were other factors that contributed to the low number at the end of 2012, but the early start was surely a factor).

So, how does the recolonization this year compare to that of 2018 and 2012? There are a couple of ways of summarizing the data on Journey North. First, we can just list all the sightings from 1 May through 15 May exclusive of sightings from west of the Rockies and east of 80W (western PA). Second, we can count only those sightings that occur N of 40N during that period.

Sightings from 1-15 May exclusive of western states and sightings east of 80W.

YearTotalRevised Total>40N%
202230426519272.5
201826522612153.5
201243536333492.0

These are the three years in the record in which the area north of 40N has been colonized the earliest. In 2018, the population grew to 6.05 hectares from 2.48 the previous year while in 2012, it declined from 2.89 hectares to 1.19. Going back through all the years with first sightings, the pattern of the timing of colonization and growth in 2001, an increase from 2.83 hectares in 2000 to 9.35 hectares at the end of 2001, is similar to that of 2018. Given these precedents, it looks like the colonization of early May this year will lead to an increase in numbers through the summer, into the fall and will eventually result in an increase in numbers next winter. Still, it’s early, and we need to watch how the colonization progresses from now through the 14th of June. After that, we need to follow how the population develops during the summer, how the migration progresses in the fall and more. I’m hoping for a good year.

Filed under Monarch Population Status | Comments Off on Development of the 2022 monarch population so far

When monarchs are like corn

17 May 2022 | Author: Chip Taylor

I received an email this past week (<1May) that referenced an article with an alarming headline. "US corn planting slowest since 2013, yield risks still premature". Why should this be alarming? Well, I’m going to tell you why and when monarchs are like corn. It’s been on my list to do so for some time. This headline gave me the motivation to start this discussion. Let's start with the obvious, corn doesn't fly, lay eggs, visit flowers or migrate, but it does grow and every farmer knows that yields are dependent on numerous factors and that two of the most important are timing of planting and temperatures. There's the similarity – timing and temperature. Do you remember the size of the monarch overwintering population in 2013? It was the lowest ever measured, a mere 0.67 hectares. The number was alarmingly low, a number so shocking that it led to an international agreement between the governments of Canada, the United States and Mexico and a White House invitation to stakeholders to a meeting at the Eisenhower Office Building in D. C. to discuss the issue. This meeting was followed by a Presidential Memorandum on the 20th of June 2014 asking 14 Federal Agencies to actively pursue actions that would benefit monarchs and pollinators. Later, five parties petitioned the Department of Interior to declare monarchs a threatened species. The sharp decline in monarch numbers in 2013 led to an abundance of research directed at trying to understand monarch biology as well as how best to address the loss of habitat which was seen as the major cause for the decline. For my part, I tried to focus on how monarch population growth was affected by seasonal conditions and wrote the following about the decline: Monarch population crash in 2013. Most of this text is still relevant though I know more about monarch population growth now than I did then. Here are the main reasons for the decline.

“The low number of monarchs reported at the overwintering sites in Mexico in the winter of 2013-2014 appears to have been the result of a series of negative weather events that began in the summer of 2011. Excessive temperatures and droughts in 2011 and 2012 followed by low initial colonizing numbers in the spring of 2013 account for the decline. More favorable conditions for population growth allowed the population to increase in 2014 and 2015.” In addition, the timing of the returning monarchs in 2013 was late, in fact, the latest in the record. Which brings me back to corn and timing and temperature.

Both corn and monarchs were affected negatively by these conditions. Corn yields in 2012 were the lowest since the early 90’s – estimated to be -22.2% below the long-term trend. And monarchs were the lowest measured (1.19 hectares) since the start of record keeping in 1994. Corn yields were also below the long-term average in 2013 and monarchs were, as mentioned, were even lower in the winter of 2013.

To get a sense about how the weather this spring compares with that of 2013, I looked up the the deviations from long term mean temperatures for March-May from Texas to Minnesota for both 2013 and 2022.

Month-YearTXOKKSIAMN
Mar-130.9-1.8-2.1-5.6-4.7
Mar-220.81.21.62.60.8
Apr-13-1.8-4.7-5.1-4.3-7.3
Apr-2241.50.5-4.3-5.5
May-130-1-0.1-0.8-1
May-22

As you can see, the March temperatures in 2013 were substantially below normal except for Texas. April means were universally low. Though this spring is later than many in recent years, the mean temperatures for March were above average. April temperatures were lower and the first week of May has been colder than predicted from past means. If May temperatures continue to be cooler than normal, the northern movement of first-generation monarchs originating in Texas will be delayed and so will corn planting, resulting in a lower fall population for monarchs and a lower corn yield per acre. At the time of this writing (1 May), it seems likely that the overwintering number next winter will be higher than in 2013. However, the number will certainly be no more than 3 hectares and perhaps much lower.

Monarchs dipped and recovered from 2011-2015 and so did corn. The general pattern is similar. So, in the sense that both responded similarly to the physical conditions, monarchs are like corn and the converse. This response exists in spite of the fact that the areas represented in the measures of monarchs and corn are quite different. Most monarchs that reach the overwintering sites originate from the western part of the Midwest while corn production includes large areas with lower monarch recovery rates in Mexico. Corn recovered from the downturn faster than monarchs and that’s to be expected due to the manner of propagation. Corn starts with similar acreage each year whereas monarchs start with the number and timing of those returning from Mexico which can vary greatly from year to year.

YearCorn
(bushels per acre)
Monarchs
(hectares)
2010152.64.02
2011146.82.89
2012123.11.19
2013158.10.67
2014171.01.13
2015168.44.01

The existence of data on both monarchs and corn that can be related to temperatures and weather extremes allows for these comparisons. Similar relationships surely exist for a large number of co-occurring plants and animals. Soybeans also declined from 2010 through 2012 yet increased again in 2013. However, the overall similarity between crop yields and monarch numbers is compromised in this case by the adoption of new varieties and better production methods through the years. The larger point here is that what happened to monarchs from 2010-2015 was not unique. It’s likely that a large number of species were similarly affected during this interval.

Addendum
As of 13 May, the warmer weather in the Midwest that began on the 8th has changed the outlook for both the corn growers and monarchs. Planting has intensified and the northward migration of first-generation monarchs has been aided in an extraordinary manner by strong winds from the south and southwest. Again, these improvements demonstrate that corn, monarchs and many other species respond in a similar manner to weather conditions.

Filed under General | Comments Off on When monarchs are like corn

Tag recovery list updated

16 May 2022 | Author: Jim Lovett

More than 900 Monarch Watch tags were recovered from monarch overwintering sites in central Mexico during the 2021 tagging season. All of the tags have been examined and the “Tag recoveries from central Mexico” list has been updated. By default, this list is sorted by the report season then by tag code and now includes nearly 21,000 records.

To view the tag recovery lists, please visit monarchwatch.org/tagrecoveries

Thank you to everyone who tagged monarchs in 2021 and also those who assisted with the recovery efforts!

Filed under Monarch Tagging | Comments Off on Tag recovery list updated

Monarch Watch Update April 2022

22 April 2022 | Author: Jim Lovett

This newsletter was recently sent via email to those who subscribe to our email updates. If you would like to receive periodic email updates from Monarch Watch, please take a moment to complete and submit the short form at monarchwatch.org/subscribe/

Happy Earth Day, Monarch Watchers!

Included in this issue:
1. Monarch Watch Open House & Spring Plant Fundraiser
2. Follow Monarch Watch on LinkedIn
3. Monarch Population Status
4. Monarch Tag Recoveries from Mexico
5. Monarch Puzzle Wrap Up
6. Directional Flight
7. Free Milkweeds for Restoration Projects
8. About This Monarch Watch List

——————————————————
1. Monarch Watch Open House & Spring Plant Fundraiser
——————————————————

It’s here! Our annual Spring Plant Fundraiser is now online at https://spring.monarchwatch.org and we have thousands of plants looking for good homes. We are once again offering online ordering and contactless curbside pickup (or limited local delivery) for this event. To place an order you must live in, or be willing to travel to, LAWRENCE, KANSAS (we cannot ship). These plants are ideal for starting butterfly gardens or adding to established gardens and can contribute to the health of monarch and pollinator populations. Don’t miss out!

A complete list of plants and online ordering is available via the link below and pickup/delivery appointments are being scheduled for May 3-7.

Monarch Watch Spring Plant Fundraiser: https://spring.monarchwatch.org

We are also having an in-person component of our Spring Open House & Plant Fundraiser on Saturday, May 7th. This will be an outdoor-only event and there will be tours of our gardens, games, activities, monarch butterflies, caterpillars, and lots of butterfly plants available for your own garden! Complete details at https://monarchwatch.org/openhouse/

If you are not able to participate locally, we invite you to contribute to this annual fundraiser by donating to Monarch Watch via https://monarchwatch.org/donate

Thank you!

——————————————————
2. Follow Monarch Watch on LinkedIn
——————————————————

Monarch Watch has established a presence on LinkedIn so if you’d like make a connection and follow us on that platform, head on over to our new page at https://linkedin.com/company/monarchwatch and hit that Follow button!

See you there 🙂

——————————————————
3. Monarch Population Status —by Chip Taylor
——————————————————

I have looked at a lot of monarch and weather data over the years in attempts to understand the factors that influence the development of the population. These factors include the number of monarchs returning to Texas from Mexico, whether the migration is early or late, the mean temperatures in March, the timing of the emergence of milkweeds, the abundance of nectar sources and the temporal and spatial distribution of egg laying by returning females. Additional weather-related factors include soil moisture and rainfall.

That’s a lot to track and it gets confusing when trying to sort through the data over decades since the impact of some factors is affected by others. For example, droughts have a greater impact when temperatures are high than when they are low. While it will take months to sort out how the population develops this year, I’ve put together some distribution maps of monarchs and milkweeds based on photos submitted to iNaturalist to see how the conditions this year compare to those in 2021. As you will see, the numbers this year do not compare well with last year. The numbers of returning monarchs were lower this past March and the numbers of photos of milkweeds were also lower. Monarchs seem to be well ahead of emerging milkweed.

Overall, the population doesn’t appear to be off to a good start. However, the numbers could be somewhat misleading. Last year, we had a special project with iNaturalist based on an attempt to determine how severely the massive freeze in Texas in February 2021 affected monarchs and nectar sources. It’s possible that our appeal for help last year generated an unusual number of submissions. Still, as I write (6 April), the first monarch has been reported in southern Kansas well ahead of the milkweeds.

Here are links to the reports generated through the collaboration with iNaturalist last year:

Monarchs and the freeze in Texas
https://monarchwatch.org/blog/2021/06/01/monarchs-and-the-freeze-in-texas/

Nectar plants used by monarchs during March in Texas
https://monarchwatch.org/blog/2021/05/25/nectar-plants-used-by-monarchs-during-march-in-texas/

And if you are interested in the distribution Maps I mentioned above, please see
https://monarchwatch.org/blog/2022/04/22/monarch-population-status-47/

——————————————————
4. Monarch Tag Recoveries from Mexico
——————————————————

We are in the process of vetting the tag recoveries from the overwintering sites in Mexico (about 900 of them in total) and we will post the complete list online very soon so stay tuned!

Monarch Watch tag recoveries: https://monarchwatch.org/tagrecoveries

——————————————————
5. Monarch Puzzle Wrap Up —by Chip Taylor
——————————————————

I want to thank all of you who participated in the puzzle. I challenged you to come up with the same possible explanation I did for why first-generation monarchs appear to stop directional flight on specific dates in June at different latitudes (cities). I had been thinking about the question for decades and it took me a long time to come up with the answer. I did so the hard way by looking at how a lot of variables changed with the change in the seasons. The answer ultimately was so simple that I couldn’t believe that I hadn’t thought of it. Many of you had difficulties as well. It comes down to conceptualizing what happens to day length in both the spring and early summer and later in the season from late summer through fall. I didn’t ask you to think about the symmetry of the seasonal changes, but it probably would have helped.

There were 22 submissions to the puzzle contest. I had intended to award the Mariposas board game to the first three participants with the correct answer or something close to it. It turned out that the puzzle was harder than I suspected and we had to go through three rounds in which I tried to leave word crumbs that participants could follow with each iteration. I finally had to admit that it’s difficult to conceptualize an increasing function that is progressively decreasing even though those are the seasonal conditions we live with twice a year and that many of us learned as children. So, for those who kept trying, and especially for those who seemed to be on the right track, I coached them by adding a few more word crumbs they could follow. Ultimately, I ended up awarding the Mariposas board game to 5 participants. One of the interesting things for me was the number of times when dealing with the answers I had to go back to suncalc.org to make some more calculations. The puzzle was a learning process for me as well as for many of the participants. From my standpoint, that’s a good outcome.

For a more complete discussion and puzzle wrap up please see
https://monarchwatch.org/blog/2022/04/22/monarch-puzzle-wrap-up/

——————————————————
6. Directional Flight —by Chip Taylor
——————————————————

As a follow-up to the puzzle challenge, the next steps involve teaching citizen scientists how to distinguish directional flight from meandering behavior. It’s distinctive, and once learned by volunteers, we can ask “flight spotters” to record whether they are seeing directional flight through May and June. We now have a hypothesis to test based on dates and latitudes. So, for any one site all an observer would have to do is record whether directional flight was observed (weather permitting) over the short period involved. I have already lined up one team in Michigan who will be making these observations. They will also be recording data from the nearest “Tempest” weather station in an effort to closely associate their observations with the behavior of the monarchs. Having a good location where the passing monarchs can be highlighted against the sky will be key. A compass will be needed as well.

I should mention that the shut down of directional flight might not be as abrupt as suggested in the puzzle. Rather, there might be a decline in directional flight over several days rather than an abrupt cutoff. Since we would be looking for a behavior that is declining with fewer individuals showing directional flight each day, it may be difficult to identify the exact date when directional flight ceases at each location.

Oh, almost forgot. There is one more thing that makes me believe that this line of research is worth pursuing – the converse.

What is the rate of change from one day to the next when the monarchs first arrive at the overwintering sites in Mexico at the end of October? Again, the rate of change drops below 1 minute – ranging from -58 to -56 seconds from 29 Oct to 2 Nov at Angangueo. In this case, in contrast to stopping directional flight, the migration toward the overwintering sites continues southward through Mexico until sometime in early December when the change per day is about -20 seconds. That gives us another mystery, doesn’t it? Why would monarchs experiencing increasing daylength that is increasing at a decreasing rate stop directional flight while monarchs that are experiencing decreasing daylength that is decreasing at a decreasing rate keep flying? Every aspect of monarch biology seems to be complicated, doesn’t it?

——————————————————
7. Free Milkweeds for Restoration Projects
——————————————————

We are in need of CALIFORNIA applicants!

The Free Milkweeds for Habitat Restoration program focuses on distributing free milkweed plugs for large-scale habitat restoration projects throughout the range of the western monarch butterfly population in California and the eastern population east of the Rocky Mountains. The focus is on the main migration routes.

In California we currently have milkweed seed ecotypes for the Central Valley and Southern California. Only projects in these areas will be eligible for free milkweeds this spring. Projects must be a minimum of one acre.

More info and to apply: https://monarchwatch.org/free-milkweed-restoration

For projects east of the Rockies, the application is still open and there are a few milkweeds still available for 2+ acre projects.

——————————————————
8. About This Monarch Watch List
——————————————————

Monarch Watch ( https://monarchwatch.org ) is a nonprofit education, conservation, and research program affiliated with the Kansas Biological Survey & Center for Ecological Research at the University of Kansas. The program strives to provide the public with information about the biology of monarch butterflies, their spectacular migration, and how to use monarchs to further science education in primary and secondary schools. Monarch Watch engages in research on monarch migration biology and monarch population dynamics to better understand how to conserve the monarch migration and also promotes the protection of monarch habitats throughout North America.

We rely on private contributions to support the program and we need your help! Please consider making a tax-deductible donation. Complete details are available at https://monarchwatch.org/donate or you can simply call 785-832-7374 (KU Endowment Association) for more information about giving to Monarch Watch.

If you have any questions about this email or any of our programs, please feel free to contact us anytime.

Thank you for your continued interest and support!

Jim Lovett
Monarch Watch
https://monarchwatch.org

You are receiving this mail because you were subscribed to the Monarch Watch list via monarchwatch.org or shop.monarchwatch.org – if you would rather not receive these periodic email updates from Monarch Watch (or would like to remove an old email address) you may UNSUBSCRIBE via https://monarchwatch.org/unsubscribe

If you would like to receive periodic email updates from Monarch Watch, you may SUBSCRIBE via https://monarchwatch.org/subscribe

This e-mail may be reproduced, printed, or otherwise redistributed as long as it is provided in full and without any modification. Requests to do otherwise must be approved in writing by Monarch Watch.

Filed under Email Updates | Comments Off on Monarch Watch Update April 2022

Monarch Puzzle Wrap Up

22 April 2022 | Author: Chip Taylor

I want to thank all of you who participated in the puzzle. I challenged you to come up with the same possible explanation I did for why first-generation monarchs appear to stop directional flight on specific dates in June at different latitudes (cities). I had been thinking about the question for decades and it took me a long time to come up with the answer. I did so the hard way by looking at how a lot of variables changed with the change in the seasons. The answer ultimately was so simple that I couldn’t believe that I hadn’t thought of it. Many of you had difficulties as well. It comes down to conceptualizing what happens to day length in both the spring and early summer and later in the season from late summer through fall. I didn’t ask you to think about the symmetry of the seasonal changes, but it probably would have helped.

So, what does happen to day length through the seasons? We all know that day length increases in the spring, but it is easy to forget that it increases at a decreasing rate. The same, but different, change occurs after the summer solstice (21 June). In this case, the day length decreases, but again, at a decreasing rate.

As you may recall from how the puzzle was framed, I started with a single observation, namely that first generation monarchs “appeared” to stop directional flight in our area sometime after the 5th of June. Then I asked what was the difference between all the variables from one day to the next and then the next. Again, since I knew that the migration stopped sometime in early June at all latitudes, I asked if the rate of change seen from the 5th to the 6th of June followed a similar pattern with increasing latitudes. I chose Ames, St Paul and Winnipeg to see if the pattern matched. I chose the probable day before the migration stopped at each city based on the distance from Lawrence. Then I used suncalc.org to calculate the increase in day length from one day to the next. Eureka! There is a three-day match for the four sites with the rate of increase being similar from one day to the next. When I worked back through earlier dates, I realized that the results represented a point in time for each location at which the rate of change dropped below one minute per day. Specifically, I noted that the difference between the hypothetical last day of flight and the proposed stop day ranged from 50-55 seconds. That was my “Eureka” moment. What those data suggested to me was that the rate of change had become so small from one day to the next that the change could no longer be detected by the monarchs and they stopped directional flight. In other words, it was a loss of signal issue such that without a detectable rate of change per day the monarchs simply stopped migratory flight. That ultimately might not be the correct explanation, but it constitutes a working hypothesis to be tested. I will get into next steps below, but one of the things that happened by raising the issue of stopping directional flight was learning from Carol Clark that monarchs appeared to stop directional flight in the Dallas area in the first days of June. That led me to run the numbers for Dallas starting with 31 May. Bingo! Another match. That’s confirmation of the pattern – a good first step in testing the hypothesis.

There were 22 submissions to the puzzle contest. I had intended to award the Mariposas board game to the first three participants with the correct answer or sometime close to it. It turned out that the puzzle was harder than I suspected and we had to go through three rounds in which I tried to leave word crumbs that participants could follow with each iteration. I finally had to admit that it’s difficult to conceptualize an increasing function that is progressively decreasing even though those are the seasonal conditions we live with twice a year and that many of us learned as children. So, for those who kept trying, and especially for those who seemed to be on the right track, I coached them by adding a few more word crumbs they could follow. Ultimately, I ended up awarding the Mariposas board game to 5 participants. One of the interesting things for me was the number of times when dealing with the answers I had to go back to suncalc.org to make some more calculations. The puzzle was a learning process for me as well as for many of the participants. From my standpoint, that’s a good outcome.

There are three puzzle submissions I have to tell you about, one by Chris Mentrek who created a graphic solution, one by Cammie Machholz who concentrated on sunrise and sunset data and one by Jill Larson who discovered a website that does all the work for you.

To quote from Jill’s email – “I found a better website to use, and you don’t need to calculate! Of course, discovered after I used paper and pen. Try out timeanddate.com. There is a drop down for Sun & Moon, and you enter the location. Then you can see whole months at a time with the difference in duration of daylight listed in the chart. Pretty neat.” This discovery demonstrates that I do things the hard way and asked you to do the same. Sorry about that. No wonder this was difficult. I should mention that the readout for each day at this site shows the time of sunrise and sunset as well as the sun angle at solar noon (SASN).

To show the change from the hypothetical last day of directional flight to the next two days for each location, I have combined screen shots for Lawrence, Ames, St Paul and Winnipeg from the time and date site. There are 1 second differences between the data from this site and suncalc.org.


(For those of you who are curious about how daylength changes through the entire year, enter your location and then track the rates of increase and decrease from December to December. When starting on the 21st of Dec you will notice a slow increase in daylength which will increase and then the positive rate of change will slow as the 20 March equinox is approached. After the 20th of March, daylength keeps increasing but the rate of increase declines to 0 on the 21st of June).


Cammie Machholz focused on the change in the rate of increase in sunset and sunrise. She concluded that the similarities of the differences in sunrise and sunset across the latitudes could be why monarchs stopped directional flight. Indeed, these are components of the 50-55 second increase and show the same pattern as the total increase.

Sunrise
Dallas – May 31 to June 1 – 17 seconds earlier
Lawrence – June 5 to June 6 – 15 seconds earlier
Ames – June 7 to June 8 – 15 seconds earlier
St. Paul – June 8 to June 9 – 16 seconds earlier
Winnipeg – June 11 to June 12 – 14 seconds earlier

Sunset
Dallas – May 31 to June 1 – 35 seconds later
Lawrence – June 5 to June 6 – 36 seconds later
Ames – June 7 to June 8 – 37 seconds later
St. Paul – June 8 to June 9 – 37 seconds later
Winnipeg – June 11 to June 12 – 36 seconds later

Cammie’s data suggests another hypothesis namely that the cue could involve a change perceived or not perceived on the horizon, possibly at the end of the day. There are other possible hypotheses, but we have a good place to start.


Below are Chris Mentrek’s graphical solutions. His graphs nicely show the convergence of dates and locations and easily beat my summary. Chris’s answer was more than I expected from any participant. Other winners simply showed the similarities among sites in the rate of change from one day to the next.

The migration-halt dates for the four cities in question DO follow a nicely-predictable pattern:


Here’s something that’s similar for these cities on the dates in question: the amount of change in daylight.


However, unless the butterflies are carrying this chart in their heads (along with an ability to sense latitude and the date), there’s probably a more-indirect clue in their environment that conditions are right to stop migrating north.


Every day in the spring, a site’s minutes-of-daylight will increase until the summer solstice — June 21st. In May and June, each day gets longer by slightly-less time than the day before. This change in the daylight length varies a lot with both date and latitude. (For example, Winnipeg sees a drop from 167 seconds-per-day to 0 from May 15th to June 21st.)

It’s not a perfect prediction, but the migration-stop dates all seem to occur when a site’s change in daylight reaches about 53 seconds. (For example, Winnipeg’s daylength drops from 55 to 50 seconds on the migration-stop date, while Lawrence’s daylength drops from 54 to 50 seconds.)

To sense this, the butterflies only need to be able to sense how much daylight they’re experiencing, and how it changes day by day. It might be a handy way to infer their latitude!


Directional Flight

As a follow-up to the puzzle challenge, the next steps involve teaching citizen scientists how to distinguish directional flight from meandering behavior. It’s distinctive, and once learned by volunteers, we can ask “flight spotters” to record whether they are seeing directional flight through May and June. We now have a hypothesis to test based on dates and latitudes. So, for any one site all an observer would have to do is record whether directional flight was observed (weather permitting) over the short period involved. I have already lined up one team in Michigan who will be making these observations. They will also be recording data from the nearest “Tempest” weather station in an effort to closely associate their observations with the behavior of the monarchs. Having a good location where the passing monarchs can be highlighted against the sky will be key. A compass will be needed as well.

I should mention that the shut down of directional flight might not be as abrupt as suggested in the puzzle. Rather, there might be a decline in directional flight over several days rather than an abrupt cutoff. Since we would be looking for a behavior that is declining with fewer individuals showing directional flight each day, it may be difficult to identify the exact date when directional flight ceases at each location.

Oh, almost forgot. There is one more thing that makes me believe that this line of research is worth pursuing – the converse.

What is the rate of change from one day to the next when the monarchs first arrive at the overwintering sites in Mexico at the end of October? Again, the rate of change drops below 1 minute – ranging from -58 to -56 seconds from 29 Oct to 2 Nov at Angangueo. In this case, in contrast to stopping directional flight, the migration toward the overwintering sites continues southward through Mexico until sometime in early December when the change per day is about -20 seconds. That gives us another mystery, doesn’t it? Why would monarchs experiencing increasing daylength that is increasing at a decreasing rate stop directional flight while monarchs that are experiencing decreasing daylength that is decreasing at a decreasing rate keep flying? Every aspect of monarch biology seems to be complicated, doesn’t it?

Filed under General | Comments Off on Monarch Puzzle Wrap Up

Monarch Population Status

22 April 2022 | Author: Chip Taylor

I have looked at a lot of monarch and weather data over the years in attempts to understand the factors that influence the development of the population. These factors include the number of monarchs returning to Texas from Mexico, whether the migration is early or late, the mean temperatures in March, the timing of the emergence of milkweeds, the abundance of nectar sources and the temporal and spatial distribution of egg laying by returning females. Additional weather-related factors include soil moisture and rainfall.

That’s a lot to track and it gets confusing when trying to sort through the data over decades since the impact of some factors is affected by others. For example, droughts have a greater impact when temperatures are high than when they are low. While it will take months to sort out how the population develops this year, I’ve put together some distribution maps of monarchs and milkweeds based on photos submitted to iNaturalist to see how the conditions this year compare to those in 2021. As you will see, the numbers this year do not compare well with last year. The numbers of returning monarchs were lower this past March and the numbers of photos of milkweeds were also lower. Monarchs seem to be well ahead of emerging milkweed.

Overall, the population doesn’t appear to be off to a good start. However, the numbers could be somewhat misleading. Last year, we had a special project with iNaturalist based on an attempt to determine how severely the massive freeze in Texas in February 2021 affected monarchs and nectar sources. It’s possible that our appeal for help last year generated an unusual number of submissions. Still, as I write (6 April), the first monarch has been reported in southern Kansas well ahead of the milkweeds.

Here are links to the reports generated through the collaboration with iNaturalist last year:

Monarchs and the freeze in Texas
https://monarchwatch.org/blog/2021/06/01/monarchs-and-the-freeze-in-texas/

Nectar plants used by monarchs during March in Texas
https://monarchwatch.org/blog/2021/05/25/nectar-plants-used-by-monarchs-during-march-in-texas/

Monarch – Danaus plexippus – 2022 N=392 (below left) and 2021 N=534 (below right)

Antelopehorn – Asclepias asperula – 2022 N=34 (below left) and 2021 N=207 (below right)

Green antelopehorn – Asclepias viridis – 2022 N=6 (below left) and 2021 N=45 (below right)

Zizotes – Asclepias oenotheroides – 2022 N=24 (below left) and 2021 N=68 (below right)

Filed under Monarch Population Status | Comments Off on Monarch Population Status