Insect Population Dynamics
19 January 2021 | Author: Chip TaylorInsect Population Dynamics:
Potential fecundity, realized fecundity and reproductive success
I’ve mentioned realized fecundity from time to time in my posts to the Monarch Watch Blog. It’s a subject that gets little attention perhaps because it is more of a hypothetical deductive construct than a measurable outcome of the interaction between a female (or cohort of females) and the immediate environmental context in which reproduction occurs. Yet, there is ample evidence that realized fecundity needs to be understood if we are to understand how monarchs, pollinators and invertebrates in general deal with average weather conditions, substantial deviations from long-term norms, extreme weather events and xenobiotics.
As you may recall from earlier discussions, realized fecundity for most insects is defined as the lifetime number of eggs oviposited. This number is distinguished from potential fecundity, which is the realized fecundity plus any eggs or well-developed oocytes that remain at death. These values are distinguished from reproductive success which is defined by the number of offspring that not only reach the adult stage but reproduce themselves. There is a presumption that higher realized fecundity leads to higher numbers of progeny reaching the adult stage and successfully reproducing. While there are no expectations that there is a linear relationship between realized fecundity and reproductive success, realized fecundity is the base such that low values are likely to stifle, while high values more effectively enable, population growth. In short, if we want to understand how populations respond to environmental conditions, we have to start with realized fecundity.
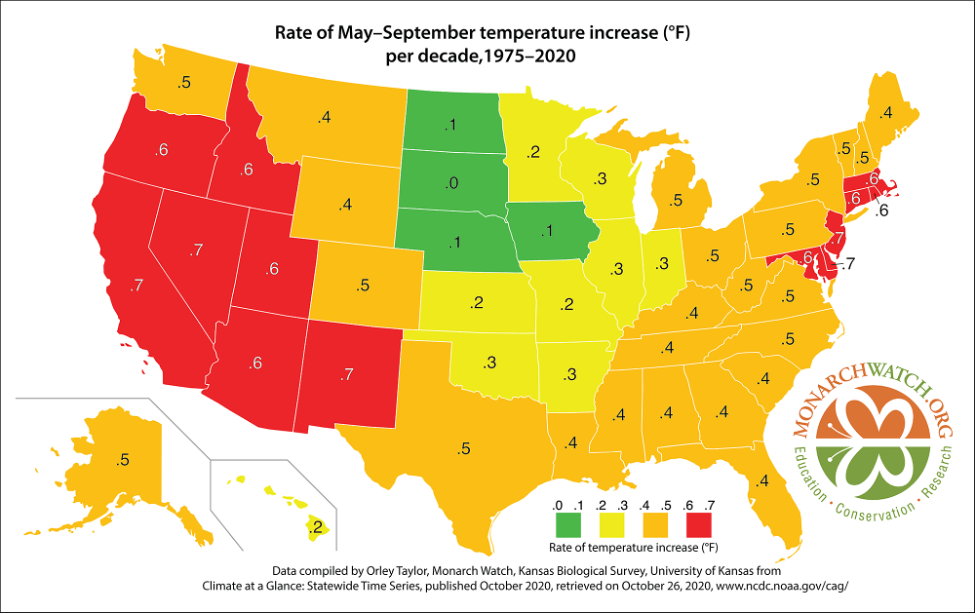
Studies of reproduction in lab cultures have been used to assess the differences between realized fecundity, potential fecundity and reproductive success. While we can’t easily make those distinctions in the field, we can make some strong inferences based on how populations respond to environmental conditions. For example, when the mean June–August temperatures are 2°F or higher above the long term mean, monarch populations decline. Why is that the case and how is that result related to realized fecundity and reproductive success?
To answer these questions, I try to think about the impact of temperatures on all actors in the play. We can postulate that as temperatures increase, monarch metabolism increases, and with that, there is an increased demand for water and carbohydrates from nectar to maintain bodily functions, including egg and sperm production, and the functioning of neuroendocrine and accessory glands. However, meeting these demands becomes increasingly difficult as temperatures increase since nectar secretion declines at higher temperatures and flowering duration shortens with both declining if the high temperatures occur during drought conditions. In addition, milkweeds experiencing physiological stress mature more rapidly and quality, as measured by nutrient content and percentage of usable proteins, probably decrease as well. In many plants, secondary plant products evolved to deter herbivory tend to increase during periods of stress further diminishing their palatability to herbivores. In other words, there can be a cascade of negative effects after temperatures significantly exceed long-term averages, effects that can be amplified if droughts occur simultaneously. These conditions could impact both adult and larval monarchs. The lifespan of adult monarchs, capacity to reproduce and number of hours of activity could be reduced. The latter due to the tendency for monarchs to seek shelter when temperatures are in the 90s. These conditions likely result in a lower number of eggs laid per female lifetime and thus a reduced realized fecundity for generations experiencing these conditions. It follows that reproductive success could also decline during these conditions if larvae reduce feeding at times when the temperatures are extremely high or the host plants are physiologically stressed. Any such interactions that affect plant quality and larval feeding success or developmental rate of larvae would have a negative effect on population growth.
When thinking about realized fecundity, we need to be careful to distinguish between individual and cohort or generation outcomes. In the spring, as monarchs returning from Mexico have reached Lawrence, I’ve made an effort to catch and dissect a few female monarchs to assess their reproductive condition. Most monarchs reaching eastern Kansas in late April are battered and torn and barely able to fly and can sometimes be seen crawling from plant to plant to lay eggs. Upon dissection most of these females contain fewer than 10 eggs with none developing in the ovaries and an almost completely depleted fat body. These end-of-life females appeared to have maxed out their reproductive potential. While this was true for the monarchs I caught, to what extent was this true of the entire cohort moving north in those years? We don’t know. But what about other years? In 2012 and 2017, overwintering female monarchs reached eastern Kansas in early April in excellent condition and full of eggs (see “Monarch Population Status” (5-11-2017)). Rather than laying most of their eggs in Texas and southern Oklahoma, these monarchs moved rapidly to the north and distributed their eggs over a broader range of latitudes than in most years. Massive numbers of eggs were laid in eastern Kansas in both 2012 and 2017, which would seem to be a good thing, yet, the winter counts that followed showed that the population had declined in each case.
If we assume that these cohorts of females also maxed out their reproductive potential, did the more northerly distribution of eggs have a role in determining the size of the migratory population and overwintering numbers? Probably. A more northerly distribution of eggs appears to reduce reproductive success and slow population growth in several ways. First, moving into northern latitudes too soon can mean that females are searching for milkweeds that have yet to emerge, second, due to a shortage of newly sprouting milkweeds, too many eggs can be laid per milkweed shoot to support all the developing larvae and third, lower average temperatures in more northerly latitudes slow development. Slowing development has the effect of exposing larvae for longer periods to predation and parasitism while increasing the mean age to first reproduction. The latter is probably the most important effect. It is a basic tenant of demography that populations with the shortest age to first reproduction increase most rapidly. With monarchs, any generation that takes longer to develop has a negative effect on the size of next generation. With only three generations per year, if monarchs start the year with a delayed mean age to first reproduction, it is almost impossible to reach numbers typical of average conditions by the end of the season.
We also need to factor in extreme weather events such as catastrophic mortality due to winter storms in Mexico, massive fires that kill the breeding population, floods and periods of extreme heat. To those natural causes of mortality, we can add mowing when larvae are present, insecticide drift from crops into areas with milkweeds and nectar sources and other sorts of chemical contamination. Mortality during or after the migration due to storms, etc., has the effect of reducing reproductive success the following year by reducing the number of monarchs that have the potential to reproduce in the spring. The other sources of mortality mentioned have an impact on the reproductive success of that particular generation, which, if severe, is likely to negatively affect the growth of the next generation. The impact of all these causes of mortality needs further study. We know little about the survival of monarch adults and larvae when temperatures exceed 110°F for a number of days. To these considerations, we can add mortality caused by predators and parasites. Again, these causes of mortality affect the number reaching the adult stage and therefore the potential reproductive success of that generation. Predation and parasitism appear to vary over generations as well as regionally and from year to year making it difficult to assess the importance of these factors as determinants of overall population growth.
Xenobiotics could also have an impact on population development. Xenobiotics are man-made chemicals that are both intentionally and inadvertently widespread in the environment. Although different from stressors associated with weather, chemical stressors could have similar effects – subtle, sublethal effects, that reduce reproductive success. While we tend to think of insecticides, herbicides and fungicides as probable agents in insect declines, there are literally hundreds of other widespread compounds that could be acting as single agents or synergistically with other compounds in ways that could affect realized fecundity. All that would be required is an interaction that causes a slight increase or decrease in metabolic rates. As mentioned, higher metabolic rates could lead to shorter life spans with lower reproductive output, while lower metabolic rates could lead to longer generation times, slower egg maturation, less reproductive activity and ultimately slower population growth. Metabolic rates are but one example as to how trace amounts of man-made compounds could be affecting invertebrates. Such compounds could affect the nervous system in ways that alter key functions such as the ability to produce gametes or respond to environmental stimuli in a manner that interferes with the ability to locate host plants or locate nest sites.
Realized fecundity can also be affected by the spatial distribution of resources. It takes energy to move through the environment in search of resources, and it follows that the costs associated with finding resources, let’s say nectar and host plants, are a function of the spatial distribution and abundance of those resources. In the context of the present-day conditions, involving mega cities, intensive farming and reduction of roadside vegetation through mowing or herbicides, it’s clear that monarchs are dealing with an increasingly fragmented environment. It is likely that fragmentation requires more time and energy for monarchs to find the needed nutrients and host plants to maximize their reproductive potential. How these conditions affect monarchs is not known, but it’s reasonable to expect there is a cost. To appreciate the landscape monarchs must traverse to find milkweeds and nectar sources in the Midwest, you need to drive across central Illinois, Iowa or Minnesota in mid-summer. The fragments with few or no milkweeds and nectar plants are huge. I’ve made those trips, and if my car ran on nectar rather than gasoline, even if an ounce of nectar was equal to a gallon of gas, I certainly couldn’t have completed those trips. It’s not easy being a monarch, and it’s getting harder.
It should be clear that everything I’ve just described for monarchs applies to honey bees, bumble bees, solitary bees, other pollinators and most other insects. I can envision scenarios based on the above that account for population declines of all of these organisms.
For an additional discussion dealing with monarch population dynamics, please see https://monarchwatch.org/blog/2020/02/25/why-monarchs-are-an-enzyme-part-2/
Those readers interested in taking a deeper dive into population dynamics will find the following Wikipedia entry helpful: https://en.wikipedia.org/wiki/Population_dynamics
Filed under General | Comments Off on Insect Population Dynamics In a press release today, the U.S. Fish and Wildlife Service announced its decision with respect to the petition to declare the monarch a “threatened” species under the Endangered Species Act:
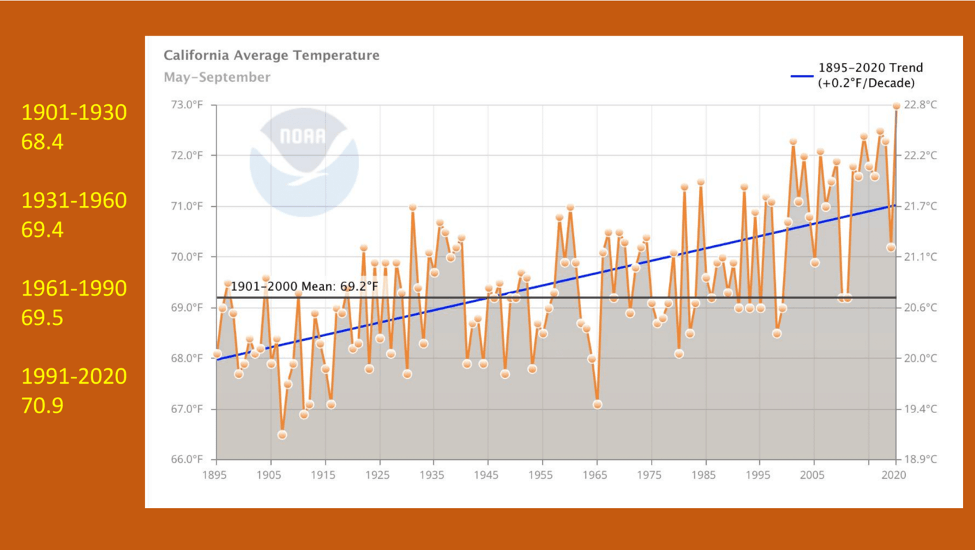

 For all of you who are located close (or close enough) to Monarch Watch here in Lawrence, Kansas our Spring Plant Fundraiser is now online at
