Monarchs and climate in the West
Tuesday, February 25th, 2020 at 9:23 am by Chip TaylorFiled under Western Monarchs | Comments Off on Monarchs and climate in the West
Many months ago, I received a request to be a keynote speaker at a Monarch Summit in California. I accepted the invitation with some reluctance realizing that most of the audience wouldn’t be interested in what I had to say about the eastern monarch population. In addition, I knew almost nothing about what was happening in the West. I had purposefully ignored the West for several reasons. First, I had plenty to do trying to manage Monarch Watch and understand what was happening in the East. Second, I was generally ignorant about the dynamics of the Western population, and third, there always seemed to be a lot of conflict in the West that wasn’t exactly inviting. Further, a number of colleagues had begun publishing papers on monarchs and habitats with milkweeds in the West. Nevertheless, no longer being as smart as I was when younger, I decided to determine if I could learn anything new about the Western monarch population by applying what I know about how the eastern monarchs respond to seasonal conditions. My first approach was to examine the inter-annual variation in monarch numbers in the West relative to monthly and seasonal averages in temperature and precipitation. In other words, I wanted to determine if linked seasonal conditions, or weather, explained any of the year to year variation. They do, sort of, but that’s another story that will require more study. What I want to deal with in this piece is how weather led me to climate, and it’s the climate story I want to tell since that story is critical to understanding what is happening to the Western monarch population and what might happen to monarchs in the near future.
Did you know that there is a difference between how the terms weather and climate should be used? Lots of folks don’t – including politicians and some scientists. Weather is defined as the state of the atmosphere at a place and time as regards heat, dryness, sunshine, wind, rain, humidity, barometric pressure and cloudiness. In other words, it’s what is happening now or forecast to occur in the near future. On the other hand, climate represents the long-term average of weather over a period of 30 years or more. Another way to think about the difference is that weather is a snapshot in time while climate represents past events whose trends might inform us of both future weather events and long-term changes.
The transition from thinking about how weather might explain year to year variation in monarch numbers to the potential impact of long-term climatic changes in California produced a number of surprises. Let’s start with the main breeding season. The mean temperatures for the 5-month period from May through September for California are summarized for the last 30 years in Figure 1.
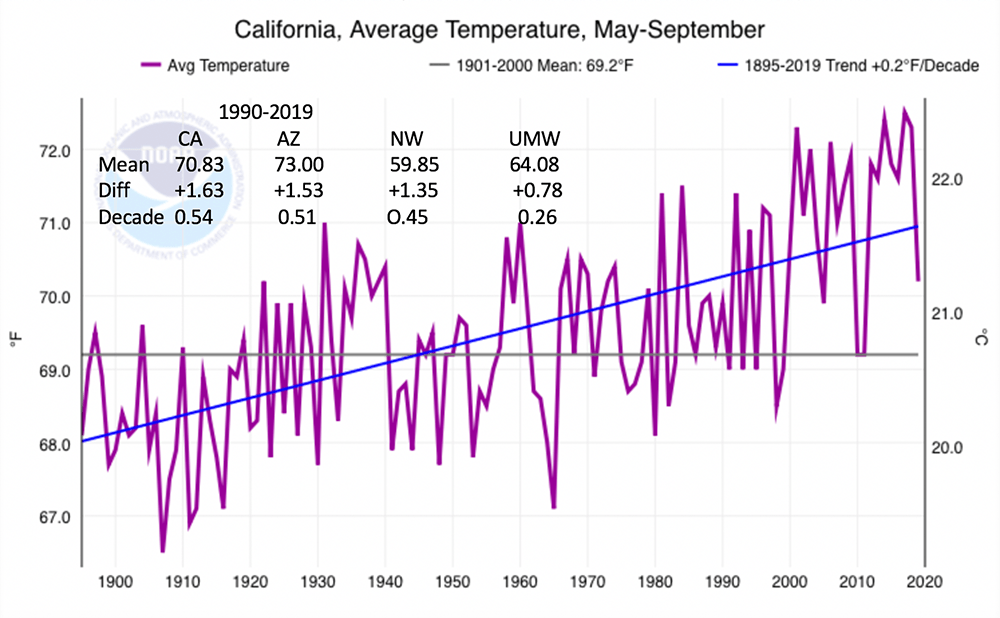
Figure 1. California average temperature May–September. Modified from ncdc.noaa.gov/cag/
The trend line shows temperatures increasing through this 30-year period. Although the long-term trend from 1895 to 2019 shows an increase of 0.2 degrees per decade, the mean for the last 30 years shows an increase of 1.63 degrees or 0.54 degrees per decade. Added to that figure are the 30 year means and rates of increase per decade for AZ, the NW and UMW (Upper Midwest), with the latter showing the lowest rate of change. It’s clear from these data that the West is heating up faster than the Upper Midwest, in fact, faster than the rest of the lower US. That result is sobering, but the real shocker is what has happened along the California coast over the last 20 years (Figure 2).
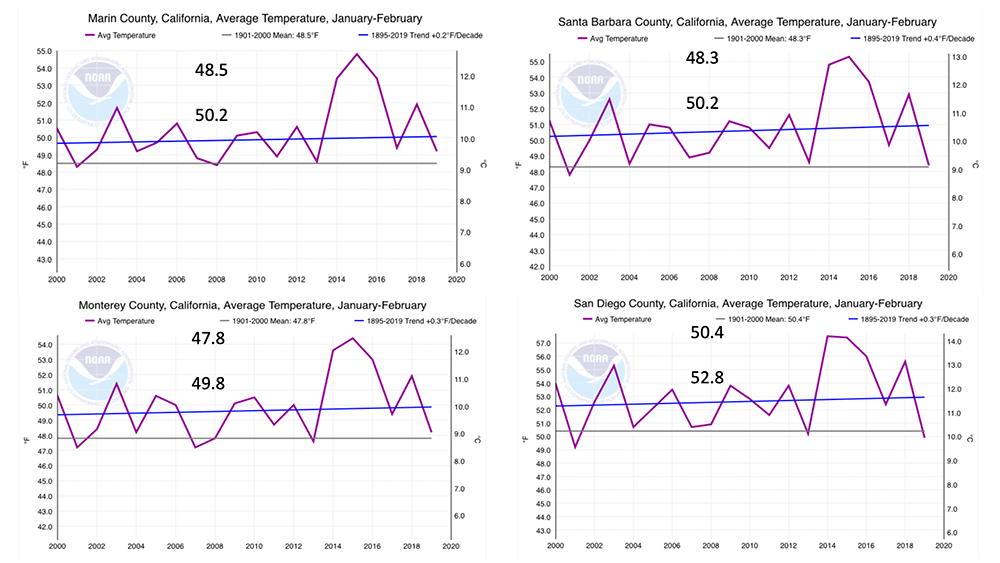
Figure 2. Average temperature January–February in four counties in California. County locations shown in Figure 4. Modified from ncdc.noaa.gov/cag/
Figure 2 displays both the long-term mean and the mean for the last 20 years for January–February for 4 counties from Marin in the north to San Diego in the south. The differences range from +1.7°F for Marin County to +2.4 degrees (.85–1.2 degrees/decade) for San Diego County. Wow! That’s an incredible rate of increase over such a short period. When I saw those numbers, I asked what might be happening at the overwintering sites. It had been rumored that monarchs were moving progressively northward to overwinter. I looked for references where this interpretation had been published but found nothing. So, I decided to dig into the Thanksgiving Day Count Database maintained by the Xerces Society. The result of my partial analysis is shown in Figure 3.
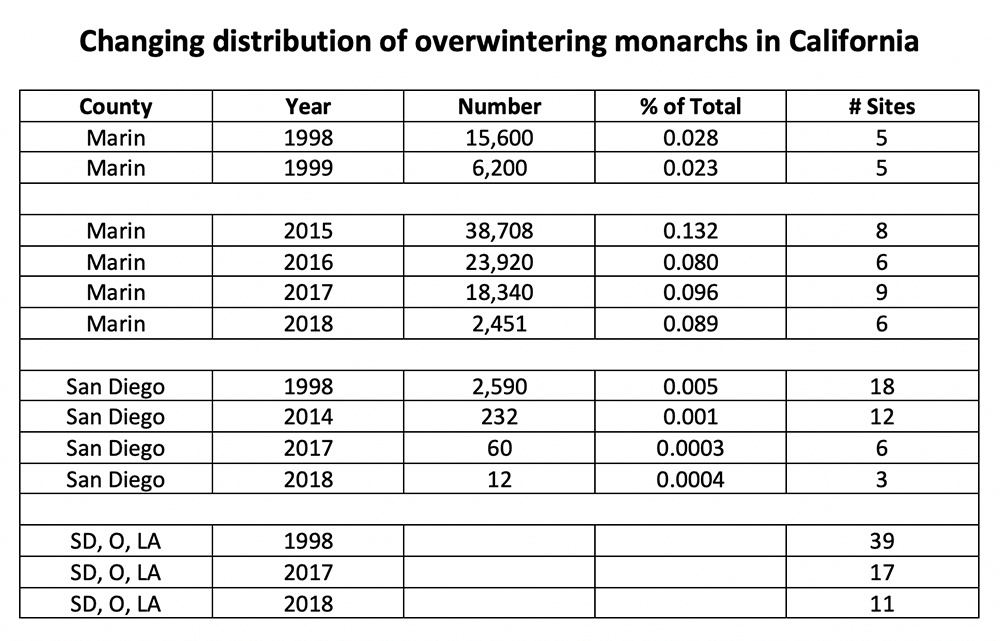
Figure 3. Changing distribution of overwintering monarchs in California.
Since many new overwintering sites had been added to the Thanksgiving counts after 2011, sites added after 2011 were excluded from my tabulation to avoid biasing the interpretation. As you can see in Figure 3, the number of sites and the number of butterflies in the southernmost counties (San Diego, Orange, and Los Angeles) has declined to almost nothing while the counts in Marin, the most northerly county, indicate that there has been a significant increase in the proportion of the overwintering population in that county from 1998 to that of 2015–2018. Although these results indicate that sites are being lost in southern counties, and that monarchs are progressively moving northward to overwinter, these trends deserve a more in-depth analysis by someone broadly familiar with the monarch overwintering in California.
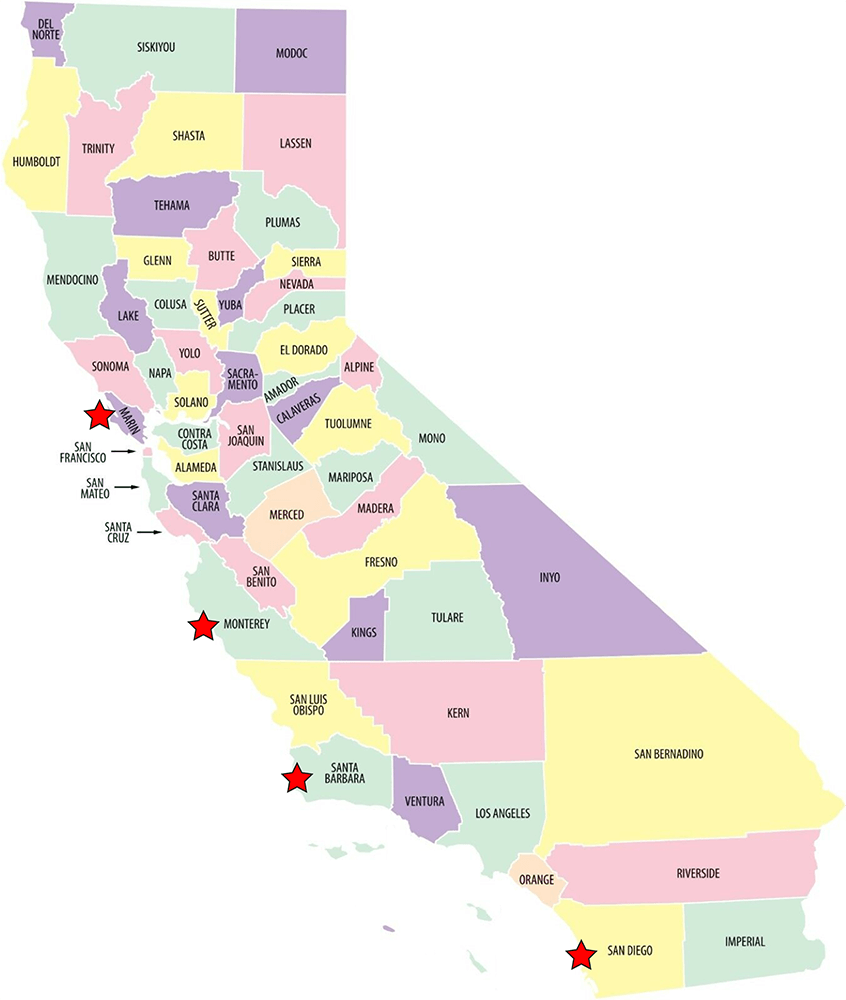
Figure 4. Map of counties in California. Starred counties referenced in Figure 2.
So, what might be happening in the southern most counties? The temperature data for San Diego County in January and February (Figure 2), and the preceding months*, may signal that it is simply too warm for monarchs to form clusters, or stay in them, resulting in progressive movement northward to cooler locations. If this interpretation is correct, what can we expect in the future if mean January-February temperatures continue to increase at 0.80 degrees, or greater, per decade? We don’t want to go there, do we? We don’t want to think about it, but the reality is that, by the end of the next decade, mean temperatures could be 50.8–51.0°F for all counties along the California coast. Such temperatures could further limit the ability of monarchs to successfully overwinter in traditional sites. Would monarchs move inland to cooler overwintering sites or continue moving northward along the coast in search of the temperatures and cluster sites that favor overwintering? That’s a good question. Folks familiar with coastal and inland conditions in January and February might be able to answer that question. I can’t.
The loss of overwintering sites and lower numbers of monarchs through the winters in the southern California counties raises another question. What about spring recolonization? With fewer overwintering butterflies, recolonization of the southern areas of California and Nevada will be limited further contributing to the decline of monarchs in those areas, a decline that could move northward as it continues to warm along the coast. At the same time, monarchs overwintering further north would be closer to the summer breeding grounds in the Northwest. That might be beneficial since the limited isotope data reported by Yang, et al (2015) suggests that, at present, roughly 50% of the overwintering monarchs originate from that region.
As to why the mean temperatures along the California coast are rising so rapidly, you can blame it on the increase in temperatures in the Pacific, and if you ask why those temperatures are increasing, point your finger at yourself and at the system that has failed to curb the emission of greenhouse gases (CO2, methane, nitrous oxide) that trap heat energy – 90% of which is absorbed by the oceans.
*November–December mean temperatures for San Diego County increased from 53.5°F (the long-term mean) to 55.0°F from 1990–2019 or 0.5°F per decade.
References
Office of Environmental Health Hazard Assessment
https://oehha.ca.gov/epic/impacts-physical-systems/coastal-ocean-temperature
Yang, L.H., Ostrovsky, D., Rogers, M. C., and J.M. Welker. 2015. Intra‐population variation in the natal origins and wing morphology of overwintering western monarch butterflies Danaus plexippus. Ecography 39:998-1007.


Sorry, comments for this entry are closed at this time.