29 January 2014 | Author: Chip Taylor
The overwintering numbers are in from Mexico and once again it’s bad news. The numbers are not a surprise; as early as May, we predicted that the population would be lower this winter. I’ll discuss our reasons for this expectation and the overall decline seen throughout the last decade, but first, let’s look at the numbers reported by World Wildlife Fund, Mexico.

Figure 1. Total Area Occupied by Monarch Colonies at Overwintering Sites in Mexico
Habitat Loss
In previous postings to this Blog I’ve mentioned three factors that have contributed significantly to the loss of monarch and pollinator habitats: the adoption of herbicide tolerant (HT) crops, the ethanol mandate, and development. In my lectures I’ve presented figures in which I try to quantify the loss of habitat attributable to each of these factors. The expected low numbers of monarchs in Mexico this winter have caused me to reevaluate and clarify these losses. My interpretation is summarized in the two tables below. The loss of monarch habitat due to the adoption of HT crops and the ethanol mandate is summarized in Table 1. The overall loss of monarch habitat is shown in Table 2.
Let’s deal with the HT crops first.
| Year |
Corn & Soy Acreage |
Event |
| 1996 |
143.5 million |
First HT Crops |
| 2006 |
153 million |
Before Ethanol |
| 2007 |
158 million |
Ethanol Mandate |
| 2012 |
169 million |
Conversion Continues |
| 2013 |
174.4 million |
Conversion Continues |
| Bottom Line: 29.5 million more acres of C&S in 2013 than 1996. Of this acreage >24 million represent former CRP, grassland, rangeland, and wetland habitats. |
Table 1. Loss of Monarch Habitat due to HT Crops and Biofuel Initiative
If you have been following postings to this Blog, you know that row crops (e.g., corn and soybeans) contained relatively small quantities of common milkweed when tillage was used to control weeds in these fields. Some milkweed survived and a survey conducted in 2000 (Oberhauser, et al 2000) showed this habitat to produce more monarchs per acre than other milkweed/monarch habitats. With the adoption of HT crop lines, the use of glyphosate has all but eliminated milkweeds from these habitats (Brower et al 2011, Brower et al 2012, Pleasants and Oberhauser 2012 and personal observations).
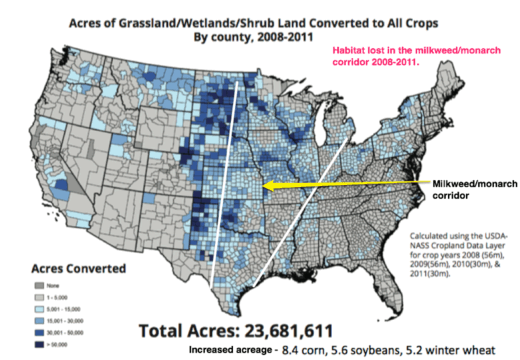
One of the startling aspects of the corn and soy dynamics is the increase in acreage over the last 17 years. In 1996 the total acreage for corn and soy was 143.5 million acres while in 2013 was 174.4 million acres – an increase of 29.5 million acres. Note that while the acreage increased by 9.5 million acres from 1996 to 2006, the acreage increased by 20 million over the last 7 years. This increase is largely due to the ethanol mandate. Early in 2007 congress passed the Clean Energy Act of 2007, frequently referred to as the ethanol mandate. It was apparent to many growers in the spring of 2007 that this act was going to increase the demand for and price of corn. Corn planting has been increasing ever since with the result that farmers have removed hedgerows and narrowed field margins. In much of the corn-belt, farming is from road to road with little habitat for any form of wildlife remaining. Grasslands – including some of the last remaining native prairies, rangelands, wetlands, and 11.2 million acres of Conservation Reserve Program (CRP) land – have been plowed under to produce more corn and soybeans. Most of these acres formerly contained milkweeds, monarchs, pollinators and other forms of wildlife. They are gone and the total loss of these habitats since 2008 exceeds 24 million acres (an area about equal to the state of Indiana).
Development consumes about a million acres of farmland a year and the conversion of woodlands and other landscapes to shopping malls, housing and roadways consumes another million acres a year. Overall, the loss of various habitats due to development probably exceeded 34 million acres since 1996. Some of this habitat was in the West and since we are just considering the eastern monarch population, I’m estimating the total loss due to development to be 17 million acres. Not all of these landscapes contained milkweeds but much of it did at one time. There are also habitat losses due to excessive mowing and use of herbicides along roadsides. In an earlier study (Taylor and Shields 2000) we showed that the area from the edge of the road to the edge of the field was about 1% of the total land area in most eastern states. These were significant milkweed and monarch habitats in the past but it appears that much of this habitat has been lost as well due to these practices. Unfortunately, there is no way to estimate this loss.
I’ve summarized the total loss of habitat in Table 2.
| Factor |
Acres |
| HT corn & soybeans |
>150 million |
| Development |
+/- 17 million |
| Total |
>167 million* |
| *Represents >30% summer breeding area |
Table 2. Habitat Loss
My conclusion is that at least 167 million acres of monarch habitat has been lost since 1996. Not all of the corn and soybean acreage occurs within the summer breeding range for monarchs so the total loss of monarch habitat due to HT crops is lower (150 million) than the total area (174.5 million) planted in 2013. The 24 million acres of grasslands, etc. converted to croplands since 2008 have been included in the estimated loss to HT crops. Add to this number the estimated loss due to development and the total is 167 million acres lost but this could easily be an underestimate since there are losses such as roadside management that we can’t account for. To give you some perspective on the area that is represented by this figure, consider the following: 167 million acres =261 thousand square miles – an area just below the total acreage of MN, WI, IA and Il (266 thousand square miles) and Texas (266 thousand square miles).
The total summer breeding range for monarchs is probably 800-900 thousand square miles. If it is true that 261 thousand square miles of this range no longer contains milkweeds and nectar plants for monarchs, it would mean that 29-33% of the monarch breeding range has been lost. This loss is calculated based on the entire summer breeding range. A more refined approach confined to the states and the region of southern Ontario that produce most of the monarchs that reach Mexico is likely to show that the loss in these areas is much higher. Have I overestimated these losses? Maybe – but probably not. In any case, due to the economic forces involving crop production and human population growth, these losses will continue. It is clear that if our goal is to save the monarch migration, we must find a way to mitigate the loss of monarch habitat.
Reproductive Success
In a long article posted to the Blog on the 29th of May 2013 (“Population Status“), I discussed the prospects for the development of the monarch population over the coming months. The article started as follows:
“Monarchs are off to a slow start this year, with the number moving north in May at an all time low (as indicated by first sightings reported to Journey North). In the following paragraphs I’ll explain why this will be a lean year for monarchs and why the overwintering population in Mexico could be even lower this coming winter than it was in 2012-2013. Predicting whether monarch populations will increase or decrease would seem to be risky or even foolish but, as you will see, there are patterns that support these predictions based on: 1) overwintering numbers; 2) first sightings in the spring (1997-2013); and 3) the impact of temperature on the development of the first generation immature stages and the ability of adult monarchs to move northward to recolonize the breeding areas in the northern states and Canada.”
The above was followed by a long explanation of the patterns of first sightings and comparisons of the numbers of first sightings and temperatures during the breeding season for other low years. I concluded with the following summary:
“So, what does this tell us about what to expect in the fall and winter of 2013? Let’s deal with the number of observations first. Although, the number of first sightings reported in 2013 is similar to those of 2004 and 2005, the number of people reporting first sightings has increased significantly since reporting of first sighting began in 1997 (Howard and Davis 2004). In other words, fewer monarchs have been seen this year by a larger group of observers – suggesting that the number of returning monarchs was lower in 2013 than in 2004 and 2005 (both low returning populations) or even 2010, which saw the lowest overwintering population (1.92 hectares) prior to that of this past winter.
There is a similarity between 2013 and 2004 – the monarchs will arrive late in the northern breeding areas. The mean temperatures for March (-2.0F) and April (-2.7F) were the lowest for these months since 1996 and the April temperatures in particular slowed development of immature stages. May temperatures – which in most of the South Region are near or just below normal – have not appreciably aided northward movement of first generation monarchs. The result of all of these factors is that the arriving number of first generation monarchs will be low and they will arrive late. Even if this projection is true, is there a chance that the population can rebound as it did in 2005? Yes, but the temperatures in nearly all of the northern breeding range will have to be above normal by 2-3F throughout the summer for the population to increase. If the temperatures are normal (and normal summer temperatures are projected by NOAA for the upper Midwest (see the National Weather Service’s Climate Prediction Center), the overwintering population is likely to be in the range of 1 hectare again this coming winter and could be much lower.”
As it turned out – all of the above came true. The monarchs did arrive late in the summer breeding areas. The number of arriving butterflies was also low. In the northeast temperatures favored nearly on time arrival of the colonizing butterflies but extensive periods of cool, rainy days limited reproductive success. The conditions were so poor for reproduction in the northeast that it became clear in August that the number of monarchs that would be recorded at Cape May, New Jersey, during the migration would be quite low and it was (third lowest recorded since 1992). NOAA was right on target with the temperature predictions too. Normal temperatures were experienced throughout the northern areas – not the higher than normal temperatures that were needed to increase the population. The delayed arrivals apparently resulted in a late migration at the end of the season. Throughout the fall we kept hearing how late the migration was. In Lawrence, KS we had some on time arrivals, a rather small number, followed by a bit of a delay and then a flush of late migrants. In a year with an early onset of freezing weather many of these migrants would not have survived. But it was a warm fall and they kept moving, arriving later than usual in the vicinity of the overwintering sites in Mexico.
Every year is unique but some years deviate more than others from the norm. 2012 and 2013 both deviated from normal with 2012 being too hot and 2013 being too cold at critical times, and both resulted in low overwintering numbers. We break the breeding season into three intervals: March-April, May- 9 June, and June-August. The temperatures in 2012 were higher in each of these intervals than for any of the last 18 years. In 2013 the temperatures were lower than normal for the first two periods. However, it was the lower than normal temperatures in April that slowed development of immatures, and somewhat cooler May and early June that delayed the recolonization of the summer breeding areas.
Monarch numbers will rebound but only if the weather allows AND there is enough milkweed to increase the population. While we will never get back to the large populations of the 1990s, there is still enough milkweed to produce monarchs in sufficient numbers to colonize 3-4 hectares of the forests in Mexico. However, given the current size of the overwintering population it is likely that it will take 2-3 years with relatively favorable breeding conditions for the population to attain such numbers.
Looking ahead, NOAA is predicting higher than normal temperatures for Texas in March and April – which wouldn’t be good. On the other hand, some of the weather services are projecting normal temperatures through mid-March. That sounds better to me. Let’s hope there are favorable conditions for monarchs over the next several years. While waiting for conditions to improve, let’s plant milkweed – lots and lots of it.
I wish to thank Vijay Barve, Janis Lentz, Elizabeth Howard for help determining the patterns described above and to Jim Lovett for his assistance on the figures and formatting of this Blog entry.
References
Brower, L.P., Taylor, O.R., Williams, E.H., Slayback, D.A., Zubieta, R.R. & Ramirez, M.I. (2011) Decline of monarch butterflies overwintering in Mexico: is the migratory phenomenon at risk? Insect Conservation and Diversity, 5(2): 95-100.
BROWER, L. P., TAYLOR, O. R., WILLIAMS, E. H. (2012) Response to Davis: choosing relevant evidence to assess monarch population trends. Insect Conservation and Diversity (2012) 5, 327–329.
Pleasants, J.M, Oberhauser K. S. (2012) Milkweed loss in agricultural fields due to herbicide use: Effect on the Monarch Butterfly population. Insect Conservation and Diversity (March 12, doi: 10.1111/j.1752-4598.2012.00196x)
Oberhauser, K.S., Prysby, M.D., Mattila, H.R., Stanley-Horn, D.E., Sears, M.K., Dively, G., Olson, E., Pleasants, J.M., Lam, W.F. & Hellmich, R. (2001) Temporal and spatial overlap between monarch larvae and corn pollen. Proceedings of the National Academy of Sciences USA, 98, 11913– 11918.
Taylor O R, Shields J. The Summer Breeding Habitat of Monarch Butterflies in Eastern North America. (2000) Washington, DC: Environ. Protection Agency.
Notes: The figure (24 million acres) for the conversion of grassland, rangeland, wetlands and former CRP lands to cropland was obtained from two sources: Faber, Rundquist and Male (2012) data obtained from a USDA website summarizing cropland conversion in 2012 (2013). The former showed that 23.6 million acres had been converted to cropland from 2008 through 2011 and the later indicated that 398,223 acres had been converted in 2012. No figures are yet available for these conversions in 2013.
Plowed Under: How Crop Subsidies Contribute to Massive Habitat Losses (2012)
Scott Faber, Soren Rundquist and Tim Male. Environmental Working Group http://static.ewg.org/pdf/plowed_under.pdf (accessed 28 January 2014).
CROPLAND CONVERSION http://www.fsa.usda.gov/FSA/webapp?area=newsroom&subject=landing&topic=foi-er-fri-dtc (accessed 28 January 2014).
Filed under Monarch Population Status | Comments Off on Monarch Population Status


 Gwynedd testing her wings on the Konza Prairie (23 June 2013). Photo by Chip Taylor.
