10 March 2018 | Author: Jim Lovett
NOTE: We will send an email with a link to the actual submission form after each period comes to a close (June 20th for period 1 and September 25th for period 2). Please hang onto any data sheets you have completed until those times. Thank you!
 Monarch Watch is seeking the immediate assistance of hundreds of monarch enthusiasts (citizen scientists) in collecting observations of monarchs in their area during the spring and fall. This project is an attempt to assemble quantitative data on monarch numbers at critical times during the breeding season. The data from these observations will be used to assess their value in predicting trends in the population.
We are excited about the data we received for 2017 and are in the process of analyzing it. It looks like it is going to help explain some aspects of the monarch migration and “pre-migration”. We will share a summary of the results as soon as we have everything worked out.
BACKGROUND
Why do we need a “monarch calendar” and your help recording monarch numbers?
The decline in monarch numbers over the last 15 years has inspired numerous attempts to define critical factors that explain the inter-annual variation in monarch numbers. The data sets used for these analyses have had a variety of limitations which have either been ignored or underappreciated by the authors of a number of publications. The truth is that much of the data that is available is too general and does not adequately represent important aspects of the biology that underlies the development of the population each reproductive season.
There are numerous gaps in our knowledge and some of these gaps can be addressed if we can convince a large number of monarch enthusiasts (citizen scientists) to record the number of monarchs they see each day and what the monarchs are doing, along with general information about the physical conditions associated with each observation.
At this time we are not asking participants to record behavior or physical conditions (temperatures and wind speed and direction) but a few observations and notes along those lines might be useful in targeting conditions most favorable for monarch activity. The pivotal latitude is 35N (e.g., Oklahoma City) and we have provided some links below to help you determine your latitude. If the observer is located at a latitude less than 35N (i.e., “South”), we need the number of monarchs seen each day during the following two periods: 15 Mar-30 Apr and 1 Aug-25 Sep – 47 days & 56 days = 103 days total. If the observer is located at a latitude greater than 35N (i.e., “North”) the observation periods are 1 Apr-20 Jun and 15 Jul-20 Aug – 81 days & 37 days = 118 days total.
| Location |
Period 1 |
Period 2 |
South
(less than 35N) |
15 March – 30 April
(47 days) |
1 August – 25 Sept
(56 days) |
North
(greater than 35N) |
1 April – 20 June
(81 days) |
15 July – 20 August
(37 days) |
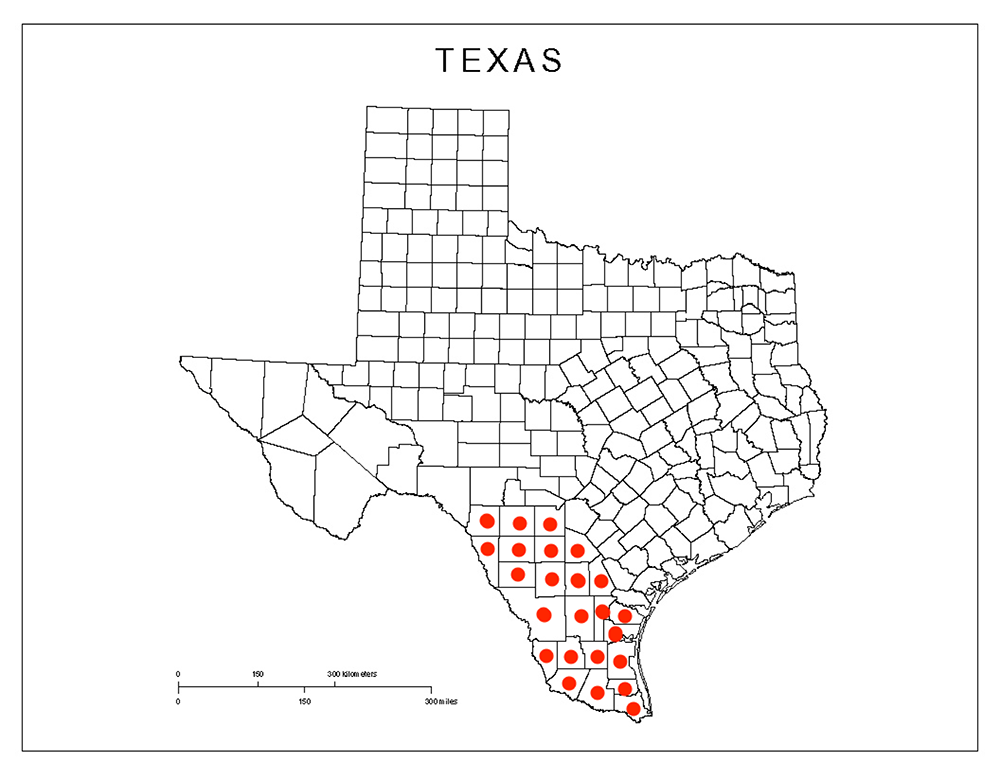
The first period in the south covers the interval during which the overwintering monarchs arrive in Texas and Oklahoma and points to the east. We need to capture a better estimate of the number of monarchs in this region that arrive from Mexico each year. This starting number has not been captured effectively. The second interval in the south captures the arrival of pre-migration monarchs from the north as well as potential local reproduction during this time. In the north, the first interval will capture some of the returning monarchs early in that period but is more likely to chronicle the arrival of first generation monarchs migrating north to the summer breeding grounds. The second period in the north should capture the relative intensity of the reproductive activities of monarchs during the period in which most of the eggs are laid that become the adults that populate the migratory generation later in August and September.
To provide meaningful data, we need to recruit hundreds of volunteers to record what they see.
INSTRUCTIONS FOR CITIZEN SCIENTISTS
Here is what we need you, as citizen scientists, to do:
1. Register as a participant in this 2018 project (even if you registered previously) by providing your name, location (including latitude and longitude), and email address via the form at
monarchwatch.org/register
To determine your geographic coordinates, please use any of the following sites (or others) to enter your city, state/province, and zip/postal code and retrieve your latitude and longitude in decimal form (e.g., latitude: 38.95 longitude: -95.27 for Lawrence, KS 66045).
mynasadata.larc.nasa.gov/latitudelongitude-finder/
www.latlong.net
mygeoposition.com
www.gps-coordinates.org
2. Record every monarch seen in your location for specific periods depending on your latitude. To keep these records all one has to do is to list the number of monarchs seen each day in which seeing a monarch was a possibility. If you were outdoors and saw none, record a zero (0). On the other hand, if there was no opportunity to make any observation due to work or vacation, etc., leave that date record blank. There will often be days when monarchs can’t be active due to weather conditions (e.g., low temperatures, extreme overcast, heavy rainfall). These intervals, if long enough, can also impact population growth. A “W” (for weather) should be entered for each of these days.
We have provided some sample files below that you can use to log your observations but exactly how you do it is up to you. Here are some suggestions: spreadsheets (Excel, Numbers, Google Sheets, etc.), printed calendar sheets (or just a calendar), calendar applications on your computer or phone, notebooks, notes or other text files on your computer or phone. Please feel free to use whatever is easiest and most comfortable for you to log your daily observations of monarch numbers – you will then use this log to complete a simple online form at the end of the observation period.
Please note: The records for each time period should only reflect the numbers of monarchs seen on any specified day within 50 miles of your home location. If you wish to report monarchs seen at a location other than your home location (specifically, at a different latitude) please use another datasheet as this should be submitted separately.
3. Submit your data to us at the end of the observation period via an online form. We will provide a link to the submission form at a later date via the email address you give us when you register. The form will be very simple; all you will need to do is enter your name and location (including coordinates as you do when you register) then you will be presented with the appropriate time period form to enter your data for each day.
We will assemble the calendar records for each period and region then provide summaries online once we have a chance to analyze the data.
Please register for this project and start logging your observations today! Thank you in advance for your assistance – if you have any questions or comments about this project, please contact us at monarch@ku.edu
SAMPLE FILES (for logging observations)
Spreadsheets (Excel format; can be imported into other applications)
2018-spring-south.xls
2018-spring-north.xls
2018-fall-south.xls
2018-fall-north.xls
sample-data.xls (partially completed sheet for reference)
Blank Calendar Sheets (to print)
2018-spring-south.pdf (Mar-Apr 2018)
2018-spring-north.pdf (Apr-Jun 2018)
2018-fall-south.pdf (Aug-Sep 2018)
2018-fall-north.pdf (Jul-Aug 2018)
You can also create custom calendars via www.timeanddate.com
FREQUENTLY ASKED QUESTIONS
Preamble
We’ve received a number of questions about our Monarch Calendar Project. We’ve tried to summarize these questions and, through the answers, clarify how we’d like you to record the data.
We need a better way of predicting the fall migration and the size of the overwintering population. This project is an attempt to capture three aspects of the seasonal dynamics of the monarch population that will help us understand how the population develops through the breeding season. Specifically, we are trying to obtain data (with your help) that will provide information on the relative numbers of monarchs seen after first sightings in most areas of the country. In addition, we are seeking data on the number of monarchs seen during the last egg laying periods in the north and south. Lastly, records of the weather-related events, as indicated by the Ws on the data sheets, may indicate times and regions during which weather had a negative impact on the population.
Thanks for your willingness to participate in this project. We appreciate your help. As you can see, from the scope of the project, the only way to obtain these data is through the cooperation and commitment of a large number of citizen scientists such as yourself. Again, we appreciate your help and we are looking forward to receiving your data.
Questions and Answers
1. When should I start my calendar?
The idea is to keep the record keeping as simple and as accurate as possible. Here are some suggestions:
• Start with your first sighting
• Start when you find the first eggs
• Start when monarchs and/or eggs have been sighted in your area
• Start only when sightings are reasonable given your latitude.
2. How do I make counts? Suppose I see a monarch six times in my garden during a day do I count that as six butterflies or one?
The rule here has to be to use common sense and be conservative. Egg laying females in the morning and patrolling males in the afternoon will often return to the same patch over and over on a given day. If during the sightings, the observed butterfly appears to be the same color, size and condition, count it as a single butterfly. Females are darker than males and male/female behavior is different. Careful observations should help you distinguish one butterfly from another. However, if you are uncertain, be conservative and record the lower number.
3. What if I am in an area in the northern part of the range where monarchs are seldom seen before 20 June?
Actually, we want to confirm that monarchs aren’t seen above certain latitudes until after the 20th of June. Please indicate that to be the case, if true, and only record data for the critical egg laying period from 15 July to 20 August. This directive is likely only to apply to a few of you who report sightings from 46N or further north.
4. What if I work during the week and can’t make observations? Or, do I have to observe for a certain length of time on a given day to record a number seen or a zero?
We expect the opportunity to observe will vary greatly for each observer over the calendar period and that some observers will, by virtue of opportunity, activity or lifestyle, see more monarchs than others. That’s fine. We want to capture relative numbers over large areas and long time periods for multiple years. Don’t worry if you don’t see monarchs or don’t spend a lot of time looking for them. Just record what you see and, if you think there was a good opportunity to have seen a monarch and didn’t, just record that day as a zero. If you had no opportunity to observe, that’s a blank. We expect more blanks and 0s with some Ws (for “weather” – see #7 below) than actual numbers sighted on nearly all the data sheets.
5. If I raise and release monarchs, do I count those?
The short answer is no. We are trying to record the dynamics of the wild population.
6. What about species that are easily confused with monarchs?
Yes, there are species that are sometimes confused with monarchs, most commonly the viceroy and the queen. In flight, the viceroy flies closer to the ground than monarchs and frequently lands on the ground. It is also less likely to visit flowers. However, when on flowers, viceroys and queens can be easily mistaken for monarchs. Monarchs are larger than both of these species. All we can tell you here is to learn your butterflies, observe closely and do your best.
7. When should I record a W for weather? What weather conditions limit monarchs?
Low temperatures (mid 60s and lower), extremely high temperatures (95 and higher), extreme overcast, rain, and high winds can completely stop monarch activity. When that happens, please record a W for weather. The Ws are important. There is no reproduction during a W – no mating, no egg laying and, if the temperatures are low, larval development slows down as well. Monarchs can get off to a good start and then be slammed by weather that shuts down reproduction. We need to capture that. Five consecutive days of low temperatures and rain can have a strong negative impact on a population that can easily be missed if projections are based on mean monthly temperatures. We aren’t really concerned about the weather before monarchs arrive. If necessary, we can capture weather data from “Weather Underground” for the periods prior to the arrival of monarch in any region.
8. Does this project apply to Hawaii, Southern California or Florida or other continuously breeding populations?
No, it doesn’t. Continuously breeding populations are found in Florida, some regions along the Gulf Coast, Southern California, Hawaii and numerous Pacific Islands. It’s probable that some or all of these populations cycle with the seasons and this should be captured. However, that will require a different protocol.
9. Why aren’t you asking us to record eggs, larvae and migrating monarchs?
The reason is simple; there are other programs that provide data on these aspects of the life history. Please see the following links if you wish to participate in any of these programs.
First eggs – these sightings can be reported via Journey North (learner.org/jnorth/tm/monarch/SpringWatch.html)
The Monarch Larval Monitoring Project (MLMP) at the University of Minnesota tracks both larvae and eggs (mlmp.org)
Migratory monarchs are tracked by Journey North through sightings of overnight roosts (https://www.learner.org/jnorth/tm/monarch/FallWatch.html)
Monarch Watch’s tagging program captures data related to the size and dynamics of the migratory population (monarchwatch.org/tagging)
Filed under Monarch Biology | Comments Off on 2018 Monarch Calendar Project