Monarch Watch Blog

Tagging results and the monarch decline

2 November 2016 | Author: Jim Lovett

Is the monarch decline due to an
increase in mortality during the fall migration?

Chip Taylor, Jim Lovett and Ann Ryan
Monarch Watch, Kansas Biological Survey, University of Kansas, Lawrence, KS

Introduction

The authors of three recent papers dealing with the decline in monarch numbers at the overwintering sites in Mexico have proposed that the decline is due to increased mortality during the migration or the establishment of the overwintering population (Badgett and Davis, 2015, Inamine, et al., 2016, Ries, et al., 2015). While Ries, et al. (2015) suggest that increased mortality during the migration could account for the decline, they acknowledge that other factors could be involved. Badgett and Davis (2015) are more certain of this interpretation, to quote – “we interpret the disconnect between the size of the migratory cohort at Peninsula Point and the overwintering population to be the result of mortality incurred during the migratory journey”. Similarly, from Inamine, et al. (2016) “our results are consistent with failed migration or re-establishment at the overwintering grounds impacting the population decline in Mexico.” These statements are nothing more than speculation, and no data are offered in these papers in support of this supposition. Reviewers of these manuscripts and editors of the respective journals should have challenged these unsupported statements, particularly since this speculation is used in the papers by Badgett and Davis (2015) and Inamine et al. (2016) to challenge the view, well supported by data, that the loss of milkweed and breeding habitat is the cause of the monarch decline.

Unfortunately, unsupported claims have a way of becoming facts (especially in press releases and news reports). Decisions with regard to monarch conservation should be based on data and not on unsupported speculation. This brings us to the question: Are there data that support or refute the supposition that mortality during the migration has increased over the last decade? Our tagging data are relevant to this question.

Because this text is written as a blog article, we will start with a brief summary of the results followed by a discussion. The sections that follow include background information on the tagging program along with a discussion of the dynamics of tag recovery and a section dealing with the analysis. For those interested in a quick read, we suggest reading the summary together with a scan of Figures 1-3. This text is being rewritten for publication.

Summary

The following analysis is based on tags applied to the wings of over 1.2 million monarchs over an 18-year period.

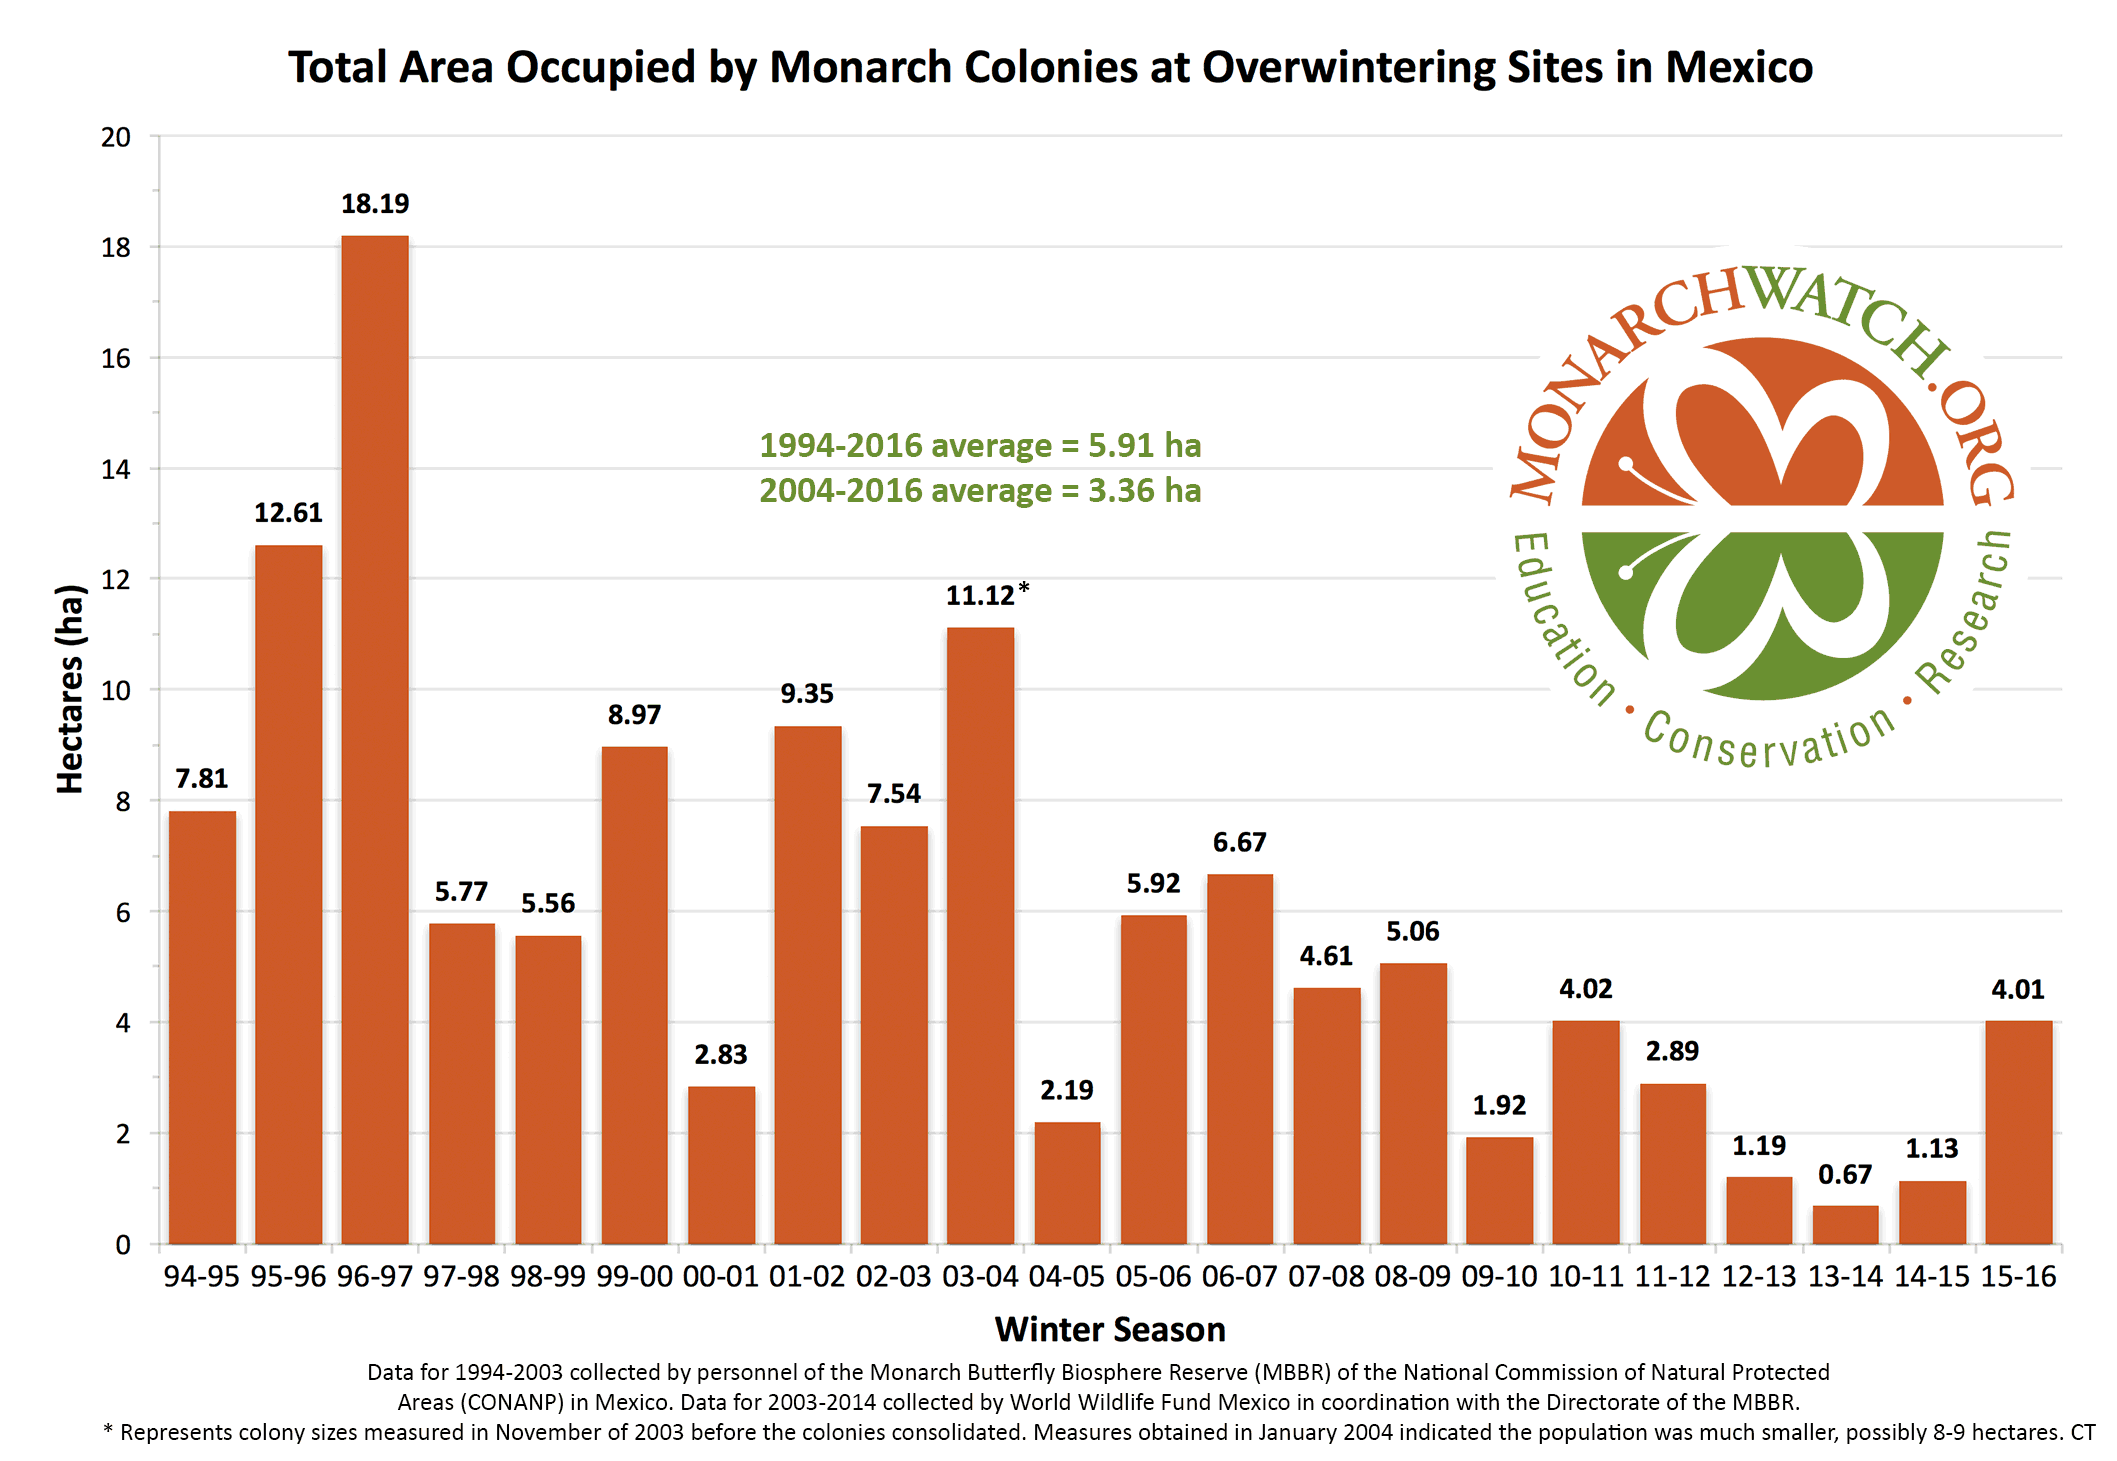
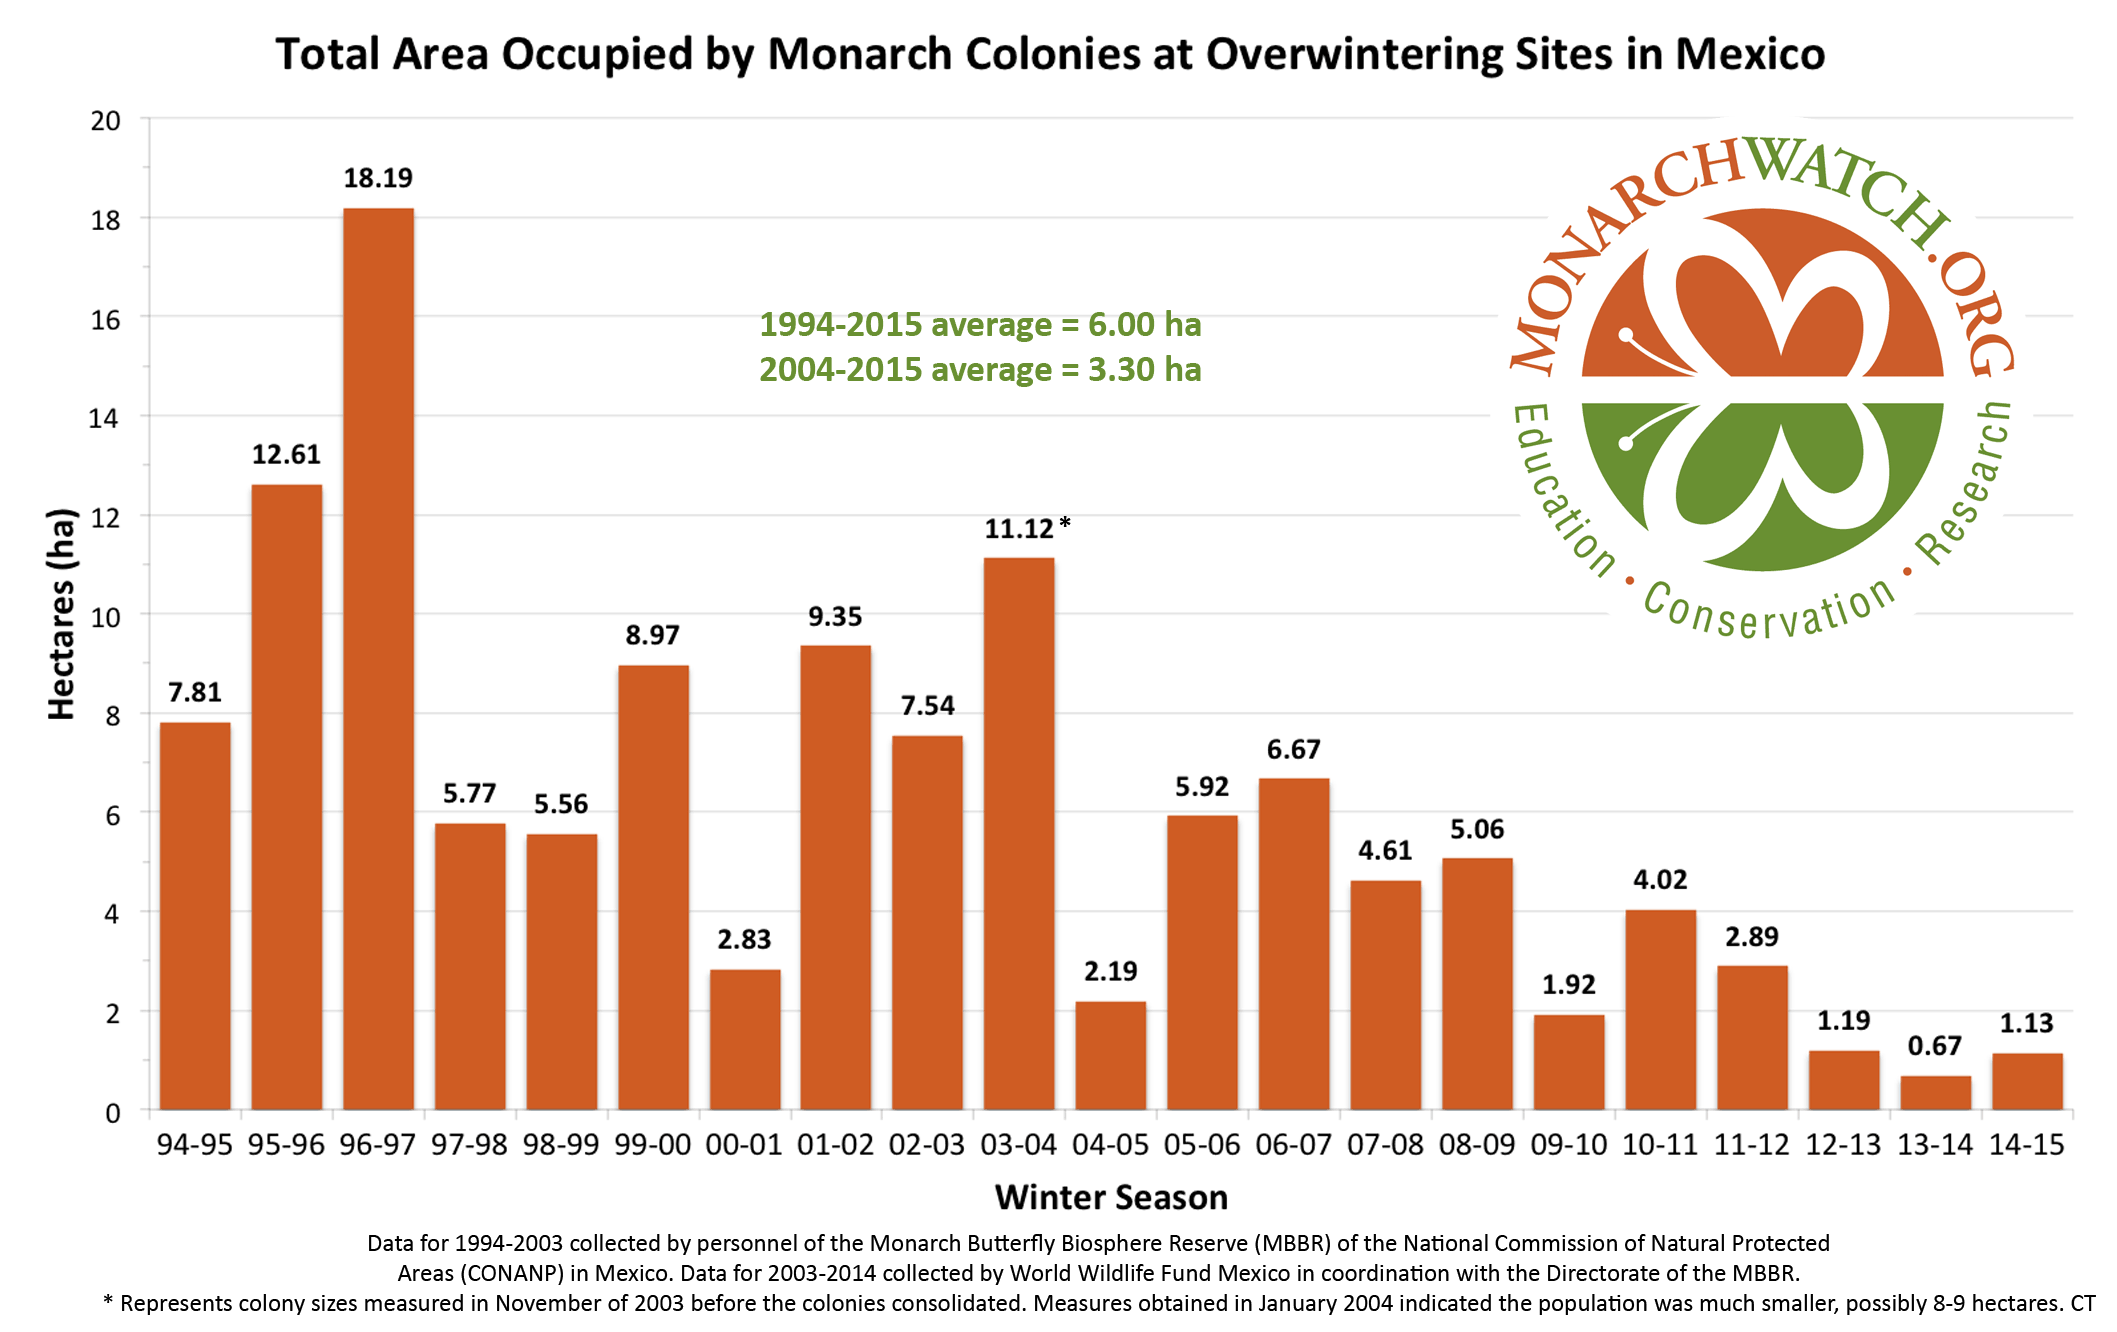
1) A significant positive association exists between the numbers of monarchs tagged each fall and the sizes of the subsequent overwintering populations (Figure 1). The tagging represents both a broad sampling area and an extended time period and, as such, is a more realistic measure of the population than population estimates obtained at peninsulas and regionally-limited butterfly counts. The migratory population is tagged over much of the area east of the Rockies (Figure 2). Tagging is conducted annually for a 2.5-month period as the migration progresses toward Mexico.

2) The data from 1998 to 2015 show no systematic decline in the proportion of tags recovered each year (Figure 3).

3) Some of the possible factors influencing variability in the tag recovery rate among years are:

  1. Higher or lower numbers surviving the migration
  2. Higher or lower mortality during the winter months
  3. Accessibility of the searchers to the dead monarchs
  4. Higher and lower off-site mortality
  5. The effect of high or low density understory on recovery rates
  6. Number of people searching for tags.

4) The tagging data are strongly correlated with the number of hectares of overwintering monarchs. This relationship establishes that there is no “disconnect” between late summer and overwintering populations. In contrast, the data sets used by Badgett and Davis (2015), Inamine, et al., (2016), and Ries, et al., (2015), which represent a small monarch source population (Peninsula Point, MI) and regionally-limited butterfly counts (OH and IL), are not correlated with overwintering numbers. Given the tagging results, it’s clear that the data sets used by these authors are inadequate measures of the late summer and migratory monarch populations. It follows that the conclusions, and speculations, based on these data are unjustified.

monarchs-tagged
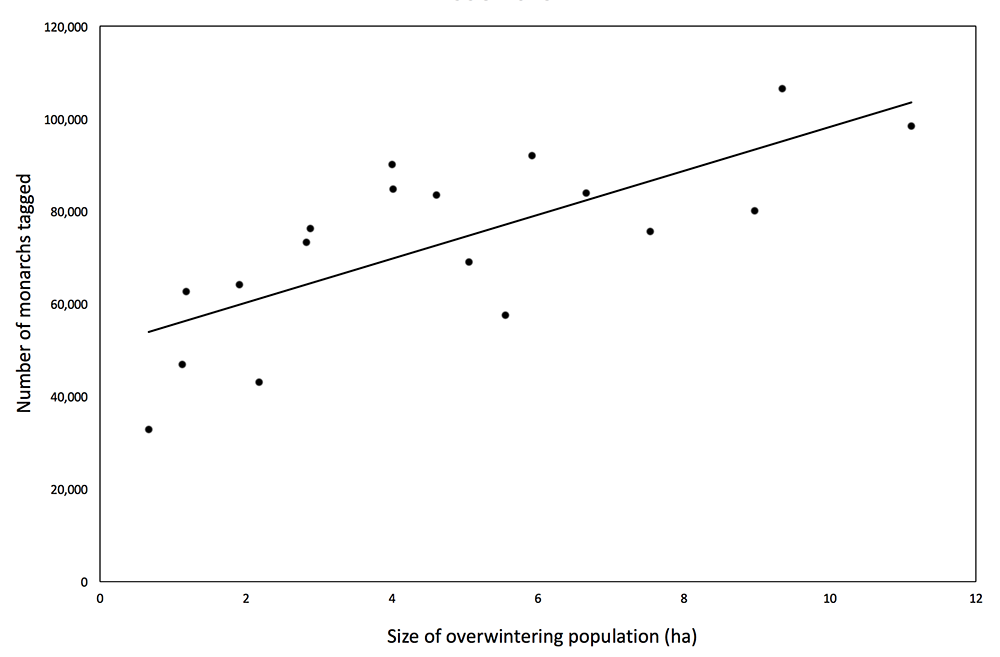
Figure 1. Number of monarchs tagged each year vs. the size of the overwintering population for the years 1998-2015. R2 = 0.5476, p = 0.0004

monarch-tag-distribution
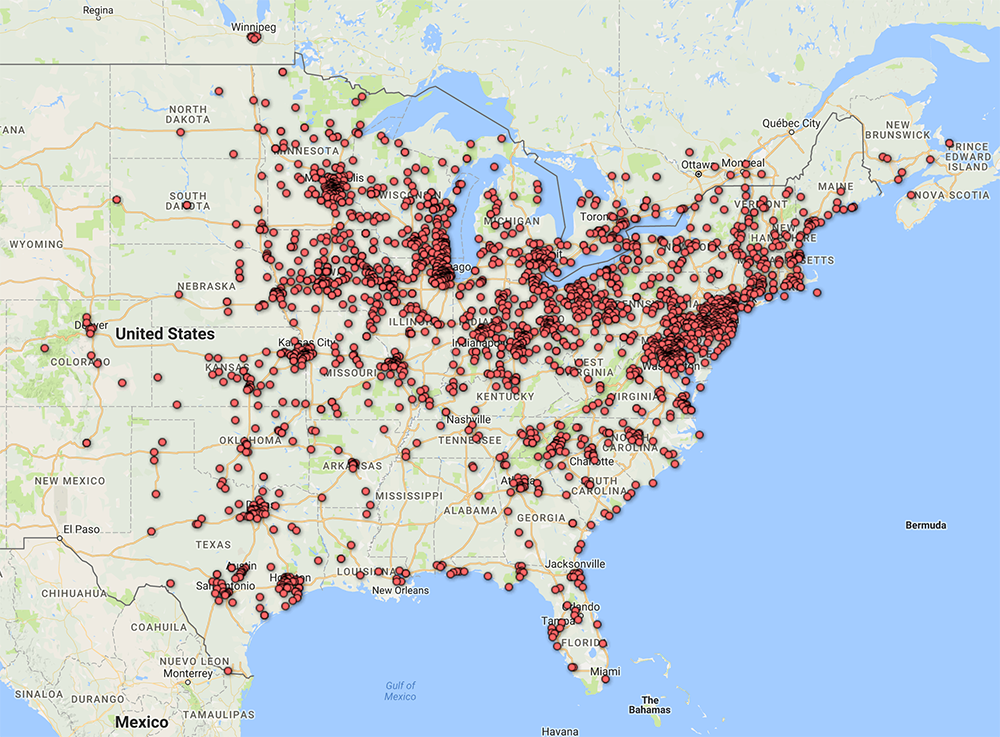
Figure 2. Distribution of >220,000 monarch tags to >2250 recipients in 2015.

monarchs-recovered
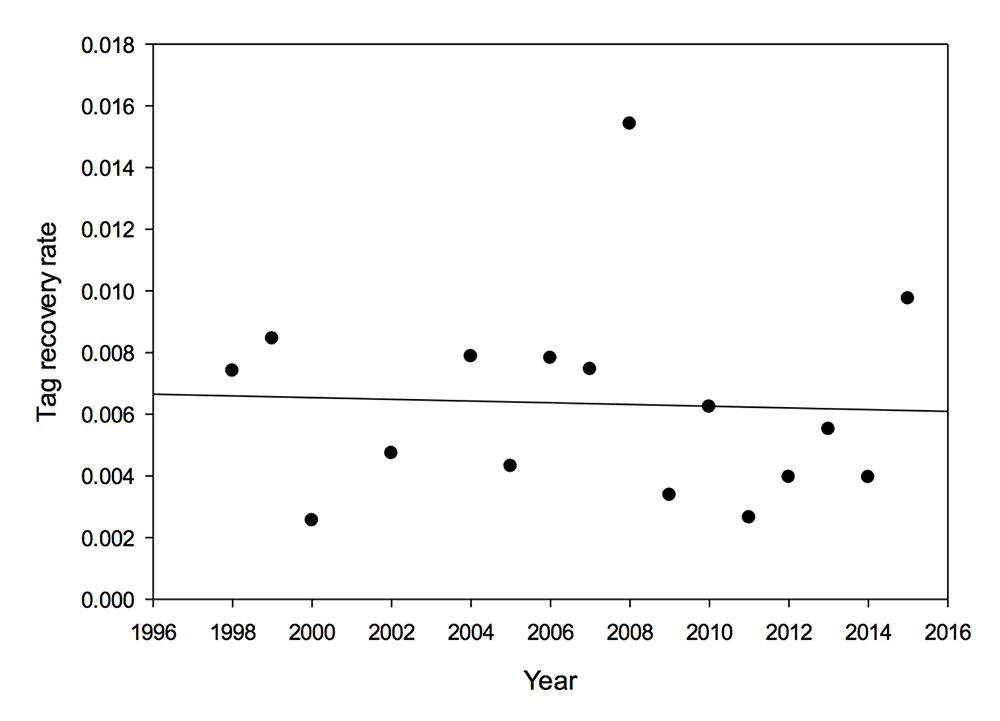
Figure 3. Proportion of tags recovered by year, 1998-2015 (2001 and 2003 excluded due to extreme weather events). R2 = 0.002, p = 0.87 (NS)

Discussion

The data sets and analysis used by Badgett and Davis (2015), Inamine, et al. (2016) led them to conclude that there is a disconnect between the year to year numbers recorded by observers at Peninsula Point, MI (Badgett and Davis, 2015) or NABA summer butterfly counts (Inamine, et al, 2016) and overwintering numbers. “Disconnect” refers to the fact that neither count predicted or was correlated with the overwintering numbers. Failure to find the expected connection led the authors of both papers to speculate that the reason for the decline had to lie with increasing mortality during the migration. No data were offered in either paper in support of this speculation. The idea that mortality has increased during the period of the decline, roughly from 2005 to the present, is not supported by the tagging data.

The numbers of monarchs tagged each year are strongly correlated with the size of the overwintering populations, R² = 0.5476, p = 0.0004 (Figure 1). These data constitute direct evidence that the size of the late summer monarch population is related to the size of the overwintering population. In contrast to data cited by Badgett and Davis (2015) for Peninsula Point, a relatively small source area representing western Ontario and the Upper Peninsula of MI and the NABA summer butterfly counts from Ohio and Illinois analyzed by Inamine et al., (2016) and previously by Ries, et al., (2015), the tagging represents sampling of the population over much of the area east of the Rockies as the monarch migration progresses southward over a 2.5-month period from mid-August to November (Figure 2).

In this analysis we’ve made a distinction between the total number of tags recovered from those tagged in a given year and the rate (percentage/proportion) of recovery of all tags applied in a given year, the latter being the total recovered divided by the total number tagged. The total recoveries are positively related to the total hectares of monarchs reported in each year as well as the total area occupied by monarchs at El Rosario. This result is expected since recovery is likely a function of the proximity of tagged monarchs to a population of searchers. Analysis of the rates of recovery of tags shows that there was no significant change in the rate of recovery from 1998 through 2015 (Figure 3). This result indicates that mortality during the migration has not increased over the last 18 years.

Given the lack of evidence of an increase in mortality during the migration, the question becomes: How can we account for the so-called disconnect between the data from Peninsula Point (Badgett and Davis, 2015) and the midsummer NABA butterfly counts (Inamine, et al. 2016, Ries, et al. 2015) and the overwintering numbers reported in Mexico? The authors in each case accepted the respective data bases as representative of the larger population in spite of a substantial body of evidence defining the loss of milkweeds in row crops and the loss of milkweed-containing habitat in the Upper Midwest, the area known to produce most of the monarchs that reach Mexico, as the major causes of the monarch decline (Faber, S., et al., 2012, Flockhart D. T. T., et.al., 2015, Hartzler, R. G. 2010, Lark, T.J., et al., 2015, Pleasants, J. M. and Oberhauser, K. S. 2013, Wassenaar, L. I. and Hobson, K. A. 1998, Wright, C. K. and Wimberly, M. C. 2013). Wouldn’t it be wiser to reverse the questions in each case and ask why the Peninsula Point and NABA data are out of sync with the larger data sets on monarchs, milkweeds and habitat loss, since the data representing these factors are strongly correlated with the size of the overwintering population in Mexico? The expectation that population counts on peninsulas or from specific regions of the breeding range should correlate with the overwintering numbers in Mexico rests on the assumption that the conditions that lead to the establishment and development of the breeding population each year are uniform for all regions of the country. That assumption simply isn’t true. Recolonization and climate vary sufficiently across the breeding range within and among years to account for the so-called disconnect between population assessments from limited areas and the overwintering numbers (Saunders, et al. 2016). Stated another way, the timing of colonization across the northern breeding range and the biotic and physical factors the growing populations experience result in regional differences in the production of monarchs. We need to integrate these regional differences in population development to fully understand the year to year numbers in the fall migration. Further, we need to know the relative contribution of monarchs originating in each region to the overwintering population. The tagging data speak to that point as well but that will come later.

The interpretations of the data sets used by these authors have already been challenged (Brower, et al., 2012, Pleasants, et al., 2016). The results of the tagging analysis lend support to the views articulated in these earlier papers that the data from peninsulas (Badgett and Davis, 2015, Davis, A. K. 2011,) and regionally-limited butterfly counts (Inamine et al., 2016, Ries et al., 2015) are not representative of late summer monarch populations.

Background

Each year we issue monarch tagging kits to taggers broadly distributed east of the Rockies. The distribution of those receiving tags in 2015 is shown in Figure 2. Taggers are asked to return their data sheets. The date, location and person tagging each butterfly is logged into a database. Creating the database is a significant task since we receive 2000-5000 data sheets per year. Each tag bears an individual code and the codes are carefully matched to the tagger and the data on returned data sheets. Some taggers fail to return their data sheets with the result that 5-10% of the recovered tags cannot be associated with the date and location of tagging. These data are discarded. The failure to return data sheets also means that the number of monarchs we record as tagged each year is an underestimate. With few exceptions, tags are applied to migratory monarchs from early August to November. Most monarchs are tagged within the “migration window” for each latitude. The migration window is a 30-day period roughly corresponding to a 10-degree shift in the altitude angle (sun angle) of the sun at noon from 57-47 degrees. The leading edge of the migration usually arrives at each latitude close to an altitude angle of 57-56 with nearly all monarchs passing through a particular location when the altitude angle reaches 47 degrees (Taylor and Gibo, unpublished data). In this data set, the numbers tagged per year varied from 106,564 (2001) to 32,667 (2013).

Dynamics of Recovery

As the migration moves S and SW, we are informed of low numbers of sightings and recoveries of tagged butterflies. We will deal with these “domestic” recoveries at a later date. This analysis is limited to the recoveries at the overwintering sites in Mexico. Monarchs usually begin arriving at the overwintering sites in the last few days of October. Conspicuous colonies form by mid-November with tourism beginning at about the same time. Most tags are recovered from dead monarchs found beneath the colonies by guides and ejido members, including children. We estimate that there are 10-40k untagged butterflies for every one that is tagged. Because of the ratio of untagged to tagged, the search time to find a tag typically involves hours of shuffling through dead butterflies to find a single tag. Due to the effort required to find each tag (estimated to be 2-4 hours) and to reward those who recover tags, we purchase tags from guides and residents in late winter each year. Those with tags save them in the hope that they will be present when Monarch Watch (MW) representatives show up to buy tags. Some residents hold on to tags for many years until they have the opportunity to sell them. As a result of this dynamic, there is a long lag in tag recovery. Most tags applied in a given year are recovered over the next 4-5 years. However, it is not uncommon for MW representatives to be offered tags that were applied to fall migrants >10 years earlier. Two tags applied in 2001 and one from 2002 were purchased this past winter.

Because of the lag in recoveries, it is likely that more tags will be recovered for the monarchs tagged during the past five seasons (2011-2015). These additional recoveries will change the slopes of the graphs presented here but will not change the conclusions derived from these data. Similarly, as we continue to clean up this massive data set, it is likely that some numbers will change. Again, there is no reason to expect that such changes will alter the interpretations presented here.

Our tagging program evolved over the years. We started the program in 1992 and used the “alar” tags pioneered by Fred and Nora Urquhart. This method proved to be too difficult for many taggers and resulted in many broken wings. Over the next four years, we used rectangular tags that were applied with glue to the underside of a monarch’s hind wing. This method was also unsatisfactory and, in 1997, we developed the technology (a special adhesive and tool to cut the tags) to produce the circular tags used in most tagging programs today. The circular tags resulted in a substantial increase in recoveries.

Reasons for recovery rates

Although the number of tags recovered for a given year is related to the overall size of the population and to the area the colony occupies at El Rosario, other factors certainly contribute to the rate of recovery. It is likely that survival during the migration is both higher and lower than normal in particular years resulting in either greater or fewer tags at risk of being recovered. Similarly, it’s probable that mortality during the winter is both higher or lower than normal in specific winters, resulting in either higher or lower tag recovery. There are also day to day dynamics and seasonal changes as monarchs seek water or colonies shift in location, both of which can result in off-site mortality where tags are not likely to be found. Other site issues include the density of the understory, with denser cover limiting the ability to spot tags. There are human dynamics as well that include the accessibility of the colonies to the searchers, the shifting population of searchers due to the turnover in guides, the overall number of searchers and the economic conditions that motivate the searchers. Nevertheless, in spite of these sources of variance in the recovery rates, there are no patterns in the data suggestive of a significant decline in mortality during the migration.

Analysis

The summaries presented here deal with all records of circular tags applied during the migration as well as tags subsequently acquired in Mexico from 1998 – 2015, exclusive of 2001 and 2003. Circular tags were first used in 1997, and though we began purchasing tags during that year, residents had no advance information, and searching for tags was therefore somewhat limited in the winter of 97-98. The winter of 97-98 was also one of great contrasts, with a freezing event at Chincua that resulted in a small area with dead monarchs said to be two feet in depth to an abandonment of colony sites late in the winter as water sources dried up as a consequence of the extreme drought brought on by the El Niño of that year (Monarch Watch Season Summary 1997, p29). The abandonment of the colony site at El Rosario likely resulted in off-site mortality and lower than expected recovery rates. We excluded 1997 from the analysis for these reasons. The data from the 2001 and 2003 seasons were also excluded from the analysis since severe storms resulted in the deaths of roughly 70% of the monarchs each winter (Brower, et al., 2004, Taylor, 2004). Over 3626 tags were recovered following the January storm in 2002 with 3416 recovered following the storms of early 2004. The records from 1998-2015 represent 14,209 recoveries of more than 1.2 million tagged for an overall recovery rate of 1.18%.

Acknowledgements

We wish to thank Eligio García, Eduardo Rendón, and Lincoln Brower for assistance in locating the reports detailing the number of hectares occupied by monarch each year at El Rosario. Long conversations with John Pleasants helped to clarify statistical issues and how to present the data. We are indebted to Diane Pruden, Debbie Jackson, Gail Morris, Carol Pasternak, Janis Lentz, Sarah Schmidt, Dana Wilfong, Cathy Walters, David Kust and family, and many, many others who helped purchase tags. We are most appreciative of the many donors who have contributed to the tag recovery fund over the years. Hundreds of tags have been purchased by visitors to the overwintering sites and donated to Monarch Watch. Numerous staff members and students have logged and/or managed the data over the last two decades, and recently we have been aided by many volunteers in the process of verifying the records and formatting the data for entry into a larger database. And last, but not least, we wish to thank the tens of thousands of taggers who have so enthusiastically contributed to this project since 1992.

References

Badgett, G. and Davis, A. K. 2015. Population trends of monarchs at a northern monitoring site: analyses of 19 years of fall migration counts at Peninsula Point, MI. Ann. Entomol. Soc. Am. DOI: 10.1093/aesa/sav060: sav060.

Brower, L. P., D. R. Kust, E. Rendón-Salinas, E. García-Serrano, K. R. Kust, J. Miller, C. Fernandez del Rey, and K. Pape. 2004. Catastrophic winter storm mortality of monarch butterflies during January 2002, pp. 151–166. In K. S. Oberhauser and M. J. Solensky (eds.), The monarch butterfly: Biology and conservation. Cornell University Press, Ithaca, NY.

Brower, L. P., et al. 2012. Response to Davis: choosing relevant evidence to assess monarch population trends. Insect Conservation and Diversity 5: 327-329.

Davis, A. K. 2011. Are migratory monarchs really declining in eastern North America? Examining evidence from two fall census programs. Insect Conservation and Diversity doi: 10.1111/j.1752-a4598.2011.00158.x

Faber, S., Rundquist, S. & Male, T. (2012) Plowed Under: How crop subsidies contribute to massive habitat losses. Environmental Working Group report.

Flockhart D. T. T., Pichancourt, J. B., Norris, D. R. & Martin T. G. (2015) Unraveling the annual cycle in a migratory animal: breeding-season habitat loss drives declines of monarch butterflies. Journal of Animal Ecology, 84, 155-165.

Hartzler, R. G. 2010. Reduction in common milkweed (Asclepias syriaca) occurrence in Iowa cropland from 1999 to 2009. Crop Protection, 29:1542-1544

Inamine, H., Ellner, S. P., Springer, J. P. and Agrawal, A. 2016. Linking the continental migratory cycle of the monarch butterfly to understand its population decline. Oikos 000:001–011, doi: 10.1111/oik.03196.

Lark, T. J., Salmon, J. M. & Gibbs, H. K. (2015) Cropland expansion outpaces agricultural and biofuel policies in the United States. Environ.Res.Lett.,10 044003 doi:10.1088/1748-9326/10/4/044003

Monarch Watch Season Summary 1997. p 29.

Pleasants, J. M. and Oberhauser, K. S. 2013. Milkweed loss in agricultural fields because of herbicide use: effect on the monarch butterfly population. – Insect Conservation and Diversity 6: 135-144.

Pleasants, J. M., Williams, E. H., Brower, L. P., Oberhauser, K. S. and Taylor, O. R. 2016. Conclusion of no decline in summer monarch population not supported. Annals of the Entomological Society of America. DOI: http://dx.doi.org/10.1093/aesa/sav115.

Ries, L., D. J. Taron, and E. Rendón-Salinas. 2015. The disconnect between summer and winter monarch trends for the eastern migratory population: Possible links to differing drivers. Ann. Entomol. Soc. Am. 108: 691–699.

Saunders, S. P., Ries, L., Oberhauser, K. S., & Zipkin, E. F. (2016). Evaluating confidence in
climate-based predictions of population change in a migratory species. Global Ecology and Biogeography. DOI: 10.1111/geb.12461

Stenoien,C., Nail, K., Oberhauser, K. S. 2015. Habitat productivity and temporal patterns of monarch butterfly egg densities in the Eastern U.S. Ann. Entomol. Soc. Am. 108: 670-679.

Taylor, O. R. 2004. Status of the population. Monarch Watch Email Updates. March 2004. http://www.monarchwatch.org/update/2004/0318.html#4. Accessed 4 July 2016.

Wassenaar, L. I. and Hobson, K. A. 1998. Natal origins of migratory monarch butterflies at wintering colonies in Mexico: new isotopic evidence. Proceedings of the National Academy of Sciences 95: 15436- 15439.

Wright, C. K. & Wimberly, M. C. 2013. Recent land use change in the Western Corn Belt threatens grasslands and wetlands. Proc. Natl. Acad. Sci. USA 1104, 134–9.

Addendum to the references

The Inamine et al. (2016) paper was published online in April. The papers below include additional data and analysis that support the hypothesis that the monarch decline is the result of a loss of habitat.

Pleasants, J. 2016. Milkweed restoration in the Midwest for monarch butterfly recovery: estimates of milkweeds lost, milkweeds remaining and milkweeds that must be added to increase the monarch population. Insect Conservation and Diversity (2016) doi: 10.1111/icad.12198.

Stenoien, C., Nail, K., Zalucki, J. M., Parry, H., Oberhauser, K. S., and Zalucki, M. P. 2016. Monarchs in decline: A collateral landscape level effect of modern agriculture. Insect Science. doi: 10.1111/1744-7917.12404.


You may download this text as a PDF file.

Filed under Monarch Tagging | Comments Off on Tagging results and the monarch decline

Monarch Population Status

14 September 2016 | Author: Jim Lovett

It was apparent as early as late May that the migration, and the subsequent overwintering population, was going to be much lower this year than in 2015-2016. The projections outlined in the Blog post of 7 July have largely come true. The one surprise has been the production of late season monarchs in Kansas, Missouri and North Carolina. There have been reports from each state describing sites with large numbers of monarch larvae defoliating patches of naturally occurring milkweeds and in some cases milkweeds in gardens. The numbers of larvae reported by observers in these areas exceed anything reported this season further to the north, where most monarchs are typically produced.

The timing of this production, along with summer observations of low numbers of adult and larval monarchs in these states, suggest a southward movement of reproductive monarchs in late July and early August – a possible manifestation of the little-understood late summer movement southward of monarchs that I’ve dubbed the “pre-migration migration”. How much this more southerly monarch production will contribute to the migration and the overwintering numbers remains to be seen. That said, it still seems likely that the area of trees occupied by monarchs in Mexico this winter will be similar to that measured in 2014 (1.13 hectares).

Filed under Monarch Population Status | 14 Comments »

Monarch Population Status

7 July 2016 | Author: Chip Taylor

As most of you know, the summer of 2015 produced a strong migration and a relatively large overwintering population (4.01 hectares). To place this population growth in context, let’s review the last several years. The population declined following each of the three growing seasons from 2011-2013. There were aspects of each season that account for these declines. For example, the temperatures from March through August in 2012 were warmer – actually hotter – than for any year going back to 1895. Monarchs arrived in the northern breeding area in good numbers in early May but altogether too early, and the hot/dry summer that followed dried up milkweeds and nectar sources leading to a significant decline in the migration and the overwintering population. In 2013, a cold period during the first three weeks of May restricted movement of the first generation monarchs produced in Texas and Oklahoma into the northern breeding range resulting in a much later than normal recolonization of this region. This pattern also led to a decline, with the lowest overwintering population on record (0.67 hectares). Conditions were somewhat better in 2014 and the population increased to 1.13 hectares in spite of the low numbers of overwintering monarchs returning to the South region.

If you go back through the older Monarch Population Status reports, you will see that I was excited about the prospect of the population increasing in the spring of 2015. Later in the summer I dialed back my expectations when I didn’t receive the positive reports I was expecting. Then, in the critical period from 20 July to 10 August, when most of the eggs are laid that produce the fall generation, a significant number of reports and observations suggested that the population would increase substantially. Still, I was cautious and predicted overwintering numbers of less than 3 hectares. I missed by a hectare or more. Going back over all the data I look at to come up with these estimates, I see where I made my mistake. I underestimated the number of monarchs arriving in the northern breeding area in May and early June. The starting numbers were larger than I realized and I never picked up on that, hence my underestimate of where the population was headed. Being wrong is part of the process and is ok as long as I learn from my mistakes.

This leads me to the end of June prediction for 2016. Unfortunately, in the words of Yogi Berra – “It’s like déjà vu all over again.” Meaning that all the data to this point in time suggest that this year will be a repeat of 2014 with a significant decline in the migration and the overwintering numbers. While the overwintering population may not be as low as 2014 (1.13 hectares), the overwintering numbers for 2016 are unlikely to exceed 2 hectares. Summer temperatures throughout the breeding area are projected to be close to normal and that should favor population growth. There are no extreme conditions on the horizon though local droughts could impact the population in some areas. The problem this year seems to be the low numbers of first generation monarchs moving north in May and early June. As best I can tell, these numbers are quite similar to those reported in 2014.

First sightings reported to Journey North for Texas in March and April were lower than normal this spring with numbers closer to 2013 than 2014 and, while it is difficult to make strong inferences from first sightings, they do provide an indication of how many monarchs are returning from the overwintering sites in Mexico. The lower numbers this spring may reflect the mortality that occurred at the colony sites as a consequence of the sleet storm that occurred from the 8-9th of March. Although some monarchs had left the colonies before the storm, many remained. Mortality estimates varied from observer to observer and from colony to colony with the highest rate of mortality being 50% for El Rosario, the colony with the greatest number of monarchs. We will never have a comprehensive assessment of the impact of this weather event but it does appear to have been significant.

The low return could well have led to low numbers moving north in May and June but the conditions in the May-June interval were less than favorable for northward movement. Monarchs generally arrived later than normal in the breeding areas with many locations reporting extremely low numbers of sightings or eggs for periods when monarchs are normally present.

Interestingly, there was a 10-day or longer period in the North East during which conditions were favorable for recolonization. I expected monarchs to flow into this area at that time since they have done so in the past under similar conditions but only a few did – suggesting that the number of first generation monarchs moving north was indeed quite low.

My analysis (or guesswork, if you prefer) suggests that the largest numbers of monarchs will be produced from the eastern Dakotas, Minnesota, Iowa, southern Wisconsin and Michigan, northern Illinois with lower production as one moves eastward from Illinois. Numbers will be down in Pennsylvania, New York and most of the East north of Maryland.

Populations at Peninsula Point (Michigan), Long Point (Ontario), Point Pelee (Ontario) and Cape May (New Jersey) will be lower than normal. The numbers at Cape May are likely to be even lower than last year – a year in which the daily census produced a mean number of sighting that was only about a third that of the long term average. Ontario and Quebec are off to a slow start and, even with favorable weather, the fall population is likely to be quite low.

While it is clear that habitat loss is the main factor that accounts for the overall decline in monarch numbers, we need to keep in mind that there is considerable inter-annual variation due to weather conditions that both favor or limit population growth.

My thanks to Janis Lentz for providing summaries of first sightings and to Journey North and their participants for posting their observations.

Filed under Monarch Population Status | 1 Comment »

Monarch Population Status

4 May 2016 | Author: Chip Taylor

On February 26th, World Wildlife Fund Mexico in collaboration with SEMARNAT and CONANP and the Monarch Butterfly Biosphere Reserve (MBBR) announced the total forest area occupied by overwintering monarch colonies. Nine colonies were located this winter season with a total area of 4.01 hectares (up from 1.13 ha last winter; see our February 26th Monarch Population Status post).

Due to an unprecedented rain/sleet storm at the overwintering sites on 8-9 March, the status of the monarch population is uncertain at this time. The storm was accompanied by strong winds that knocked down many trees and buried large numbers of monarchs beneath several inches of sleet. Many froze in place in the trees. There are no firm estimates of the numbers of monarchs that either died or survived this storm. Observers with various backgrounds and experiences visiting different colonies have estimated the losses at 3-50%. Fortunately, many monarchs had already left the area.

Recolonization of the South Region (Texas, Oklahoma, and Kansas) this spring has been slow. The numbers of first sightings recorded by Journey North to date are similar to the numbers reported in 2013, the spring that produced the all-time low number of overwintering monarchs (0.67 hectares) in Mexico. However, first sightings are an imperfect indicator of what to expect for the rest of the season. The conditions in Texas for reproduction by these returning monarchs are key. Successful reproduction in the South Region depends on the temperatures in March-April, the number and distribution of milkweeds and nectar sources, the abundance of fire ants, and other factors. These conditions vary from year to year but have a significant impact on the number of first generation monarchs that move north from this area in May and early June.

The size of this first generation moving north will largely determine the degree to which the population will be able to recover from the losses incurred during the late-winter storm. Right now, based only on first sightings, the overwintering population is likely to be in the 1-2 hectare range. We will have a better sense of how the population is developing later this month. The long-range forecasts for May and early June favor movement northward by the first generation monarchs. The unknown at this point is the number that will be moving north. If the number is low, the overwintering numbers next winter could be close to 1 hectare again. We will post another population status update via our blog in the coming weeks.

Filed under Monarch Population Status | Comments Off on Monarch Population Status

Monarch Population Status

26 February 2016 | Author: Monarch Watch

World Wildlife Fund Mexico in collaboration with SEMARNAT and CONANP and the Monarch Butterfly Biosphere Reserve (MBBR) announced the total forest area occupied by overwintering monarch colonies today in Mexico City. Nine colonies were located this winter season with a total area of 4.01 hectares:

monarch-population-figure-monarchwatch-2015
Figure 1. Total Area Occupied by Monarch Colonies at Overwintering Sites in Mexico

We will provide additional details as we receive and process them.

WWF release (in spanish): Aumenta la superficie ocupada por la mariposa monarca en los santuarios mexicanos

A note from Chip Taylor, Monarch Watch Director

Below you will find links the three status of the population articles I wrote for the Monarch Watch Blog during the 2015 reproductive season. It was clear in May that the population was likely to increase significantly this year (see 6 May 2015 Monarch Population Status article). I backed off a bit in the July post (see 16 July 2015 Monarch Population Status article) due to a poor assessment of the number of monarchs moving north from 1 May to 9 June (we are working to improve this assessment with our own participants and through Journey North). By August it was clear that the earlier assessment/prediction of a significant increase was was probably going to be realized (see 6 August 2015 Monarch Population Status article).

Our methods provide a means of predicting the direction of population change but our ability to predict of the magnitude of change is still at bit shy of where we need to be. But, on that note, I predicted in June that the Cape May numbers would be much lower than the long term average in 2015 – and they were. The numbers at Cape May were only about half that of the long term average.

Interestingly, we had more requests for tags this year than at any time in the last five years. We suspect that the increase was due to the numbers of monarchs people were seeing in the late July – early August oviposition period. A preliminary analysis of returned tagging data sheets indicates that the taggers were more successful than in any year since 2010.

Inter-annual variation is something we are going to have to deal with as best we can. Still, we have to make it clear that it’s the habitat that ultimately limits the size of the population.

It should be clear from the variability in the hectare numbers from year to year and at a time when the habitat is decreasing by 1-2 million acres per year, that the numbers of stems it takes to get a monarch to Mexico is another variable to consider. Far fewer this year than in 2013.

Based on all of the long-range forecasts, 2016 should be another good year for monarchs – if the forecasts are accurate.

Filed under Monarch Population Status | Comments Off on Monarch Population Status

Monarch Watch Job Opportunity

18 February 2016 | Author: Monarch Watch

Kansas Biological Survey seeks a half-time Monarch Waystation Education Coordinator to provide support & maintenance to an ongoing outreach program. This one year, half-time position is part of Monarch Watch’s milkweed conservation initiatives. Duties will include creating and coordinating a new outreach program for schools and public libraries, based on Monarch Watch’s Monarch Waystation project. The main focus of the Monarch Waystation program is public education directed to an understanding of the monarch migration and the need to conserve the habitats that support the monarch population. Monarch Watch is an outreach program based on the monarch butterfly within the Kansas Biological Survey. Application deadline is 03/06/16. http://monarchwatch.org/waystations/

See complete job details and apply online at
https://employment.ku.edu/staff/5368BR

Disclaimer: The University of Kansas prohibits discrimination on the basis of race, color, ethnicity, religion, sex, national origin, age, ancestry, disability status as a veteran, sexual orientation, marital status, parental status, gender identity, gender expression, and genetic information in the university’s programs and activities. Retaliation is also prohibited by university policy. The following persons have been designated to handle inquiries regarding the nondiscrimination policies and are the Title IX coordinators for their respective campuses: Executive Director of the Office of Institutional Opportunity & Access, IOA@ku.edu, 1246 West Campus Road, Room 153A, Lawrence, KS 66045, 785-864-6414, 711 TTY (for the Lawrence, Edwards, Parsons, Yoder, and Topeka campuses); Director, Equal Opportunity Office, Mail Stop 7004, 4330 Shawnee Mission Parkway, Fairway, KS 66205, 913-588-8011, 711 TTY (for the Wichita, Salina, and Kansas City, Kansas medical center campuses).

Filed under General | Comments Off on Monarch Watch Job Opportunity

Creating a Monarch Highway

1 December 2015 | Author: Chip Taylor

Monarch Butterfly Recovery Plan: Part Two
by Chip Taylor, Monarch Watch

My first attempt at outlining a monarch recovery plan was written in March 2014 (http://monarchwatch.org/recovery-plan). Although monarch conservation has been discussed at federal and state levels as well as within and among NGOs for >18 months, no specific habitat restoration plans have emerged from these discussions. By “specific” I mean the where, when, and how of restoration with consideration of all the capacity and implementation issues mentioned in the earlier text. These discussions are moving in the right direction, but a little too slowly for me. If you read the earlier blog article, you might recall that I pointed out that the annual rate of habitat loss for monarchs is probably 1-1.5 million acres. This means that for every year we don’t offset the loss of at least a million acres of habitat, we can expect the monarch population to decline further.

I have put together a brief memo (below) describing a concept for how we might configure I-35 as a Monarch Highway. This memo is intended to be a starting point for discussion. Although the memo describes how we might proceed with habitat restoration for monarchs and pollinators along our highways, modifications of this plan could be applied to other right of ways (ROWs), as well as public and private lands.

Notice that I have used the word “we” in the above and you will find “we” scattered throughout the memo. I’m using the word in the collective sense. I’m assuming that WE are all in this together.

The memo is brief and many details are missing. Before adopting this plan, details such as specific costs, planting protocols, crew sizes, site preparation that fits different soils and plant communities, planting times, and maintenance schedules (including watering) would have to be established. Further, all the cost estimates are based on those that would be incurred on private lands for projects of similar scope. State and federal agency costs could be minimal but then again, they could double the cost of the entire operation depending on their level of involvement. Firming up the overall estimated costs of the project would be one of our first priorities.

If we assume that the I-35 concept is of general interest, we still have to answer a series of significant questions before initiating the next steps.

Here are a few of these issues:

1) Assuming that strong centralized leadership is needed, what NGO or agency would take the lead?

2) How would we negotiate our way through the various state and federal regulations that apply to such a project?

3) Many miles along I-35 are not amenable to restoration and restoration sites need to be selected carefully. This is a reality that would require creation of site selection protocols and perhaps teams trained to identify high quality sites.

4) Working along I-35, especially if volunteers are involved, would require special attention to safety protocols. Alternatively, the planting could be carried out by state personnel or firms working under contract.

5) There are budget issues as well and they could be complicated and crippling unless the process is thought through very carefully.

MEMO: A PROPOSAL TO CREATE A MONARCH HIGHWAY
Restoration of milkweeds and nectar sources for monarchs and pollinators along I-35

Over the last decade monarch numbers have spiraled downward due to the loss of habitat. The very existence of the monarch migration may be threatened. Studies of the annual cycle of the monarch population indicate that the most important region supporting this species is a corridor of milkweed and nectar resources that ranges from Texas to Minnesota. This passageway has been referred to as the I-35 corridor since this Interstate Highway spans most of the region. While it is clear that restoring the monarch population will require habitat restoration on a massive scale, it is also apparent that this effort needs a symbol that will continue to engage the public as well as state and federal agencies in monarch conservation. I-35 can be that symbol.

This brief memo outlines a plan to create milkweed/native plant/monarch habitats along the entire 1400-mile length of I-35 that can become known as “The Monarch Highway”. In the paragraphs that follow, I have outlined a 5-year plan that includes planting options, costs and potential funding. An important component of the plan involves monitoring of both the planting and the use of these sites by pollinators and monarchs. Depending on the funding available, the project is scalable with total costs ranging from a minimum of 3.5 million dollars to over $10 million.

Planting Options

There are two planting options: plugs and seed mixes. For costs and capacity considerations, I’m going to use two area units: 1) 10’x100’ strips for plugs and 2) acres for seed mixes.

Plugs

A 10’x100’ plug plot would be populated with 800 plugs of 16 species (including two milkweeds and some over-seeding with native grasses) at a cost of $2,500 each or $3.5 million to establish one plot for each mile of the 1,400-mile length of I -35. The costs would include site preparation, plugs, signage, and associated fuel and administrative costs. I’m assuming that citizens would do the planting and that no labor costs other than a supervisory cost would be involved. Two such plots per mile would be preferred for a cost of $7 million.

Producing the 2-3 million plugs required for two plug strips per mile is presently within the capacity of restoration nurseries – they would just need the orders. We would start in the north where there is more capacity (seeds and nurseries) and support for restoration and work toward the south in successive years.

Seed mixes

The cost of restoring 1 acre per mile with seed mixes would range from $2,000 – $3,600 per acre for totals ranging from $2.8 – $5 million. The variance in the cost is related to the species richness of the seed mixes and costs of specific seeds as well as site preparation and planting methods. Seed mixes are more problematic for several reasons – lower success rates, scarcity of seeds appropriate for certain regions of the country, and the need for specialized equipment to prepare the sites and drill in the seeds. There is currently enough seed to start such a project in some areas of MN and IA but seeds are more limited in other areas. Citizens would not be involved in the establishment of such sites but could be involved with their maintenance through “Adopt A Habitat” programs (weeding, etc.).

Monitoring

Monitoring plant survival and recording insects and other wildlife in restored plots could be done by teams of interns in each of the six states along the highway. Generally, if you create a diverse plant community, you eventually establish a diverse insect community. We would need proof of concept and assessment of the relative success of different plant species as well as management practices. The effectiveness of these plots as habitats for pollinators and monarchs would also be evaluated. These monitoring efforts are relatively straightforward and it shouldn’t be too difficult to establish the numbers of plants and pollinators in these plots.

Plants

Once plants or seeds are in the ground, we will determine the success of each restoration effort. We will monitor each planting in the fall and the following spring for the survival of plugs of each species. Seeding operations will also be monitored for plant survival. Success rates will be assessed for each planting and maintenance protocol. Threshold standards would be established to determine whether sites require replanting with plugs or need reseeding.

Bees

Small bees visiting the restored sites can be sampled with “pan traps”, e.g., blue and yellow plastic bowls. These bowls are placed on the ground near blooming plants within the habitats for short timed intervals. The bowls contain a ¼ inch of soapy water (or some other fluid). Bees are attracted to the color and dive into the liquid and drown. At the end of the sampling period the bees are removed from the fluid and stored in “hand sanitizer” (or similar preservative). The name of the collector, location, date, time and conditions are recorded for each sample and the bees are sorted by species and identified later. A recent publication shows that there is no measureable negative impact on the insect populations sampled this way.

Macro pollinators

Sweep netting and timed visual scans are used to assess the presence and abundance of larger pollinators.

Meter-long sweeps (10-20 per location) with a standard insect net through the flowering vegetation are used to collect insects that are smart enough not to be trapped in the bowls. Again, the insects sampled are killed, labeled and sorted later.

Timed visual assessments (how many of x, y and z are seen per 1 min or 5 min intervals) account for insects that are unlikely to be collected by other methods.

To demonstrate the differences between restored and unrestored plots, the same procedures are conducted in control plots (those with normal vegetation for the area) either by another person or by the person conducting the first sample but in sequence. For example, the pan traps could be placed in one location and then set up in the second location while the first set is catching bees. Then, the first set is picked up while the second set is catching bees. Following that, the areas could be swept and visually sampled. Someone who knows how to conduct such surveys could finish a site in an hour, maybe less. A team of two interns could finish the job in 40 minutes. The time-consuming activities are sorting and identification of specimens.

Monitoring for Monarch Activity

The use of these habitats by monarchs can be assessed by one or more people prior to the other sampling. Each milkweed plant would be visually inspected for eggs and larvae and signs of leaf damage. In the plug plots the species are clumped (4-5 per clump) rather than randomly scattered. Therefore, the 100 milkweeds in each plot would be distributed in 20-25 clumps. The clumps would be flagged and numbered, allowing them to be easily found and assessed on repeated visits.

Much of the above sampling is weather dependent. The egg and larvae surveys can be done under a variety of conditions but there are sunlight, wind and temperature conditions to consider for the other sampling methods.

Sampling would only be conducted at 10-20% of the sites with three visits planned to the selected sites each year. Additional visits might be required if there are specific targets – such as the number of eggs and larvae on milkweeds from 20 July-10 August for areas north of 38°N (northern Kansas). Eggs laid during this period produce the adult monarchs that migrate from the northern breeding areas in August and September.

Funding and Cost Sharing

The costs of this project range from $3.5 to >$10 million, depending on whether the restoration is accomplished with plugs or seeds or some combination of both methods. Public and private funds could be raised to support this project. State (N=6) and federal agencies should be able to provide funds to cover the costs associated with their specific contributions to the project (e.g., administration, supervision, fuel, equipment), up to half the total costs. Additional funds could be obtained through foundations, corporations, businesses, crowdfunding, aluminum drives, pennies for monarchs, and other fundraising solicitations.

Timeline

This project could start in 2016 with some test plots along I-35, another highway, or even on private land with a modest investment. The complete project would require five years. Restoration would start in the north using plugs at first but transitioning to seeds in places where they are available (mostly in MN and IA) and then progressing southward as funds, plugs and seeds become available.

Potential limitations and barriers to success

This project will require:
1) Strong, centralized leadership with support from federal and state agencies.

2) A well-developed fundraising program.

3) Cooperation among federal and state agencies as well as NGOs and citizens.

4) An assessment of the regulations governing the composition of seed and plug mixes for each state.

5) Support for monitoring efforts and assessment of the data.

6) Publicity designed to draw attention to these efforts and to encourage land management practices that support monarchs and pollinators.

Benefits

The number of monarchs in Mexico each winter is largely determined by: 1) the number and reproductive success of monarchs reaching Texas and Oklahoma the previous spring, 2) the number and timing for the first-generation monarchs reaching the northern breeding areas (>38°N), and 3) the summer temperatures. The milkweed and nectar plant habitat supporting this population is a funnel-shaped area that widens from Texas to the Canadian border in the Upper Midwest. I-35 extends the length of most of this passageway and therefore is symbolic of what needs to be both maintained and restored in the milkweed/monarch corridor. Establishing monarch/pollinator habitats along the entire length of I-35, along with appropriate signage and publicity (thus creating “The Monarch Highway”) will strongly communicate the need to maintain the integrity of the system that supports monarchs, pollinators, and other species sharing these habitats.


You may download this text as a PDF file.

Filed under Monarch Conservation | 1 Comment »

Monarchs Over Lake Erie Waters: Citizen Scientist Observations

14 October 2015 | Author: Monarch Watch

Submitted by Candy Sarikonda, Monarch Watch Conservation Specialist

roost-at-South-Bass-Island-2015
South Bass Island monarch roost at dawn in hackberry trees 2015. Photo by Candy Sarikonda.

Recently, I visited South Bass Island in Lake Erie for a weekend of monarch activities. The Lake Erie Islands are favorite stomping grounds of mine for many reasons, but chief among them is the opportunity to witness the annual fall monarch migration moving through the islands. For over four years, colleagues and I have been working to document monarch activity in the Lake Erie islands region. Through our documentation and the reports of other citizen scientists, we have found evidence that monarchs do cross Lake Erie, and they do so deliberately and successfully.

While scientists are aware that monarchs can cross water, it is not well understood how monarchs cross the lake and under what conditions they will do so. Specific observations are few. Physical conditions such as wind direction, wind speed and temperature during these transits are not well understood. Reports from citizen scientists can serve to increase our understanding of the monarch migration over bodies of water. This article will share the stories of citizen scientists throughout the Great Lakes region, highlighting reports primarily from observers in Lake Erie and Lake Ontario, but also a few reports from Lake Michigan.

Why do monarchs cross the Great Lakes?

There is some explanation for this, particularly as it relates to Lake Erie. Dr. Chip Taylor has provided an explanation of monarch movements through southern Ontario, along the north shore of Lake Erie. Dr. Taylor explains, “During the fall migration in southern Ontario, Monarchs cluster together on trees to form overnight roosts in a manner similar to the dense aggregations formed at the overwintering sites. Overnight roosts may contain a few hundred to several thousand individuals, and monarchs usually form clusters in the same areas year after year. The location of overnight roosts is largely determined by topography, and proximity to abandoned farmlands with abundant nectar resources such as fall composites (asters and goldenrods). Monarchs migrating south in the fall through southern Ontario build up in numbers along the north shores of Lake Ontario and Lake Erie. Their apparent reluctance to fly over large bodies of water, coupled with the desire to continue moving southwards, probably causes the butterflies to fly southwestward following the shoreline. This inevitably results in large concentrations of monarchs accumulating on peninsulas jutting out into the lakes, where they have little choice but to eventually proceed southward over open water. Large aggregations and overnight roosts occur at many locations on peninsulas and at other locations along the lakeshores, including Presqu’ile Provincial Park, Long Point, Rondeau Provincial Park and Point Pelee National Park.” (www.monarchwatch.org/read/articles/canmon2.htm)

One of the main stopover sites for monarchs migrating along the northern Lake Erie shoreline is Point Pelee, located in Leamington, Ontario, Canada. Each fall, naturalists and observers at Point Pelee National Park report hundreds or thousands of monarchs gathering at the tip of the peninsula, awaiting favorable weather and a good tailwind that will enable them to cross the lake safely. Most often, monarchs gather at the tip ahead of a storm or cold front, or during times when winds from the south create a significant headwind. Monarchs will remain at the tip and nectar as they wait for favorable air temperatures and calmer, more northerly winds. Once the weather is suitable, they will continue their migration across the lake.

Observers have reported the behavior of monarchs as they fly out over the lake. Citizen scientist Darlene Burgess frequently observes monarchs roosting at Point Pelee National Park. Burgess has reported roosts of 4000-5000 monarchs at the tip of the peninsula. She has noticed that northerly winds tend to facilitate the migration, whereas strong southerly winds and storm fronts will cause monarchs to gather at the tip. Burgess shared this observation, “On Saturday, September 19, 2015, a strong storm moved into the area. Winds were from the southwest at 16-18mph with gusts of 23-35mph. Over 5,000 monarchs roosted at the tip. The next morning, winds were from the north at 9 mph. As the sun rose, monarchs roosting on the east side of the trees began basking, and quickly began to disperse. Most were dispersed by 7:45 am. The three largest roosts broke up by 8:30am. The monarchs flew to the shoreline trees, and then began flying out over the water in groups of 6-8 individuals, initially about 60 feet over the water. They appeared to be testing the wind and their strength. Some would fly back to the trees, but the majority continued on. As they continued south over the lake, they flew even higher, up to 100 feet. I was able to watch them for some distance with my star-gazing binoculars. They continued on, flying due south, at a height of about 60-100 feet above water. This continued on until about 12:30pm, when all monarchs were gone from the tip.” She further reports, “I observed on another day with a strong southeasterly wind that the monarchs were leaving low from the shoreline. They were again flying out in groups of 6-8, testing the winds. Most returned to shoreline trees, with only a few continuing on each time. That’s the day I painfully watched two monarchs fly south about a foot over the 1-foot waves…I was so concerned the waves would hit them. I did observe them attempt a higher altitude of 10-15 feet, but not for more than a second or two before returning to their low flight and flying out of view.”

Beall, in 1941, reported his observations of monarchs leaving the shoreline. He noted that “monarchs starting out over the lakes from the shore, flew either with or against the wind.” He felt there was no marked tendency for monarchs to move either with or into the wind, and thus concluded that monarchs were not simply being pushed around and dispersed passively but were instead flying with deliberate purpose. He enlisted the aid of the Southey Shoals lighthouse keeper to document monarch movements over Lake Erie from 1937-1938. The lighthouse is located 7 miles off Point Pelee. The keeper recorded flight direction for monarchs passing by the lighthouse, and data showed a preponderance of monarch flight to the south, with some lesser movement to the southeast (Beall, 1941).

Can monarchs cross Lake Erie successfully?

Directly south of Point Pelee are the Lake Erie Islands, located in the western basin of Lake Erie. My colleagues–naturalists Jackie Taylor of the Lake Erie Islands Nature and Wildlife Center (LEINWC), and Nicole King of the Ohio State University’s Stone Laboratory–and I have been actively documenting the monarchs that migrate through the Lake Erie islands since 2011. I have assisted with tagging efforts and worked to locate and photograph fall roosts. Taylor and King have tagged dozens of monarchs at the South Bass Island lighthouse grounds, while also monitoring monarch migratory and reproductive behavior on South Bass Island and the surrounding islands. Taylor and King have documented monarchs reproducing on South Bass Island and Gibraltar Island, and Taylor has observed monarchs reproducing and migrating through Pelee Island, North Bass Island and Middle Bass Island. Taylor, along with Katie Hollenbeck of Stone Laboratory, carried out a tagging effort during September 24-25, 2012. During that 2-day period, winds were 8mph from the southwest, and Taylor and Hollenbeck tagged a total of 236 monarchs that resulted in three recoveries of tagged monarchs at El Rosario. These recoveries provide evidence that monarchs can cross Lake Erie from South Bass Island to the OH shoreline, a distance of three miles, and continue to migrate to Mexico successfully. In addition, I documented 400 monarchs roosting on South Bass Island on September 13, 2014 and again documented a roost of 400 monarchs that formed on the island the evening of September 12, 2015. Clearly, these monarchs were not produced on South Bass Island, strongly suggesting a more northerly, off-island origin. Miller Ferry services the Lake Erie islands, and captains and deckhands report annual observations of monarchs flying over the water toward the OH shoreline, usually at 20-30 feet above the water. Captain Glenn Cooper states, “I usually see 2 or 3 a day during the fall. They fly at the level of the pilot house,” a height of about 25 feet off the water.

Jackie-Taylor-and-Kesari-Sarikonda-tagging-monarchs
Jackie Taylor of LEINWC and Kesari Sarikonda 2012. Photo by Candy Sarikonda.

In addition to evidence reported in the Lake Erie islands, there are reports along the OH shoreline further east of the islands and on the water as well. Jen Brumfield, a naturalist with Cleveland Metroparks, reported a large roost of 4000 monarchs gathered at Wendy Park on Whiskey Island on the evening of September 12, 2015. Wendy Park is located directly on the southern shore of Lake Erie near downtown Cleveland, and has long been known by area residents as an annual stopover site for migrating monarchs. Brumfield reported “…After crossing Lake Erie, thousands upon thousands of the dazzling butterflies arrived on Ohio shores to meet a powerful cold front pushing along the lakefront. High winds and rain forced an extraordinary number of monarchs to seek shelter from the inclement weather.” Interestingly, monarchs gathered at Wendy Park ahead of the same storm and strong west winds that led to the roost formation on South Bass Island that this author documented that same night. Approximately 4000 monarchs also formed several roosts at the tip of Point Pelee that evening.

Jen Brumfield often leads boat tours on Lake Erie searching for rare birds. Brumfield reported her monarch observations, explaining “Many, many times I have witnessed monarchs moving over the lake and coming ashore. On the 5th of September 2015, I ran a boat trip off of Port Clinton that covered open water around the Lake Erie islands. I observed 50+ monarchs that day. On September 16, 2015, I counted 250+ monarchs on a 70-mile offshore survey off Vermillion and Huron. The monarchs were anywhere from 5 to 13 miles offshore, and winds were very light from the southwest (virtually no wind). They were flying about 20-60 feet off the water.”

This evidence is corroborated by Jim McCormac of the OH Department of Natural Resources. He was boating on Lake Erie on September 16, 2015, as part of the group tour led by Jen Brumfield. He was able to photograph one of the monarchs, as it flew south over the lake about 6-8 miles offshore. McCormac explained, “The boat left at 8 am, and returned around 3 pm on September 16, 2015. At our farthest, we probably were around 12 miles out from the mainland, nearing the boundary with Canada. It is about 30-33 miles across Lake Erie at this point (Ohio shore to Canada’s shore). Assuming the butterflies left directly from the Canadian shore, they are making a 30+ mile open water transit. There is a possibility they are island-hopping (islands are about 11 to 15 miles west of the westernmost path that our boat took). Even if they are, it’s still an impressive water crossing, but given that we saw butterflies pretty much throughout the area…it would seem to make more sense that they’re straight-lining it from the Canadian shore.”

Another observer, Alicia Wallace, has also seen monarchs over the open waters of Lake Erie. She serves on an educational tall ship, Appledore IV, which often sails the Saginaw Bay and southern Great Lakes. Wallace reported a monarch sighting over waters west of Pelee Island. She states, “We estimated 25 to 50 butterflies flying around the ship for about 30 minutes between 6am and 7am on September 21, 2014. We had just come out of a fog bank when we saw them. They were flying at boom and mid mast level, so about 12 to 45 feet off the water. It was amazing to see so many monarchs in the middle of the lake.” She further reports a more recent sighting, stating “This week (September 21, 2015) I have seen 10-15 monarchs crossing the Saginaw Bay heading south. This has been around noon and they were only 10-20 feet above water.” Detroit River Hawk Watch has also often reported monarchs flying over the water. Jonathan Stein, lead counter, reports they most often see monarchs flying near the water, but at times the monarchs are also seen quite high with the hawks.

Will monarchs cross Lake Ontario, and can they do so successfully?

The reports of monarchs crossing open water over Lake Erie are further supported by reports of monarch sightings and tag recoveries over Lake Ontario. In searching for evidence of such attempted crossings, this author noted a report by Norman Tremblay of Ontario, Canada, cited in the news of the Lepidopterists’ Society in 1979. Tremblay notes, “In mid-September I was at the Lake Ontario shore east of Ajax. It was a warm morning with a mist rising off the lake. There was practically no wind. A great congregation of monarch butterflies lifted from their overnight roosts and slowly formed a huge tumbling ball of butterflies about the size of a ten-acre field. This enormous mass gathered itself into a tight swarm about 100 feet across and started out south across Lake Ontario some thirty feet above the surface of the water. The annual migration was underway.”

In addition to Tremblay’s report, there is evidence provided by Donald Davis of the Monarch Butterfly Fund. Davis has tagged migrating monarchs at Presqu’ile Provincial Park near Brighton, Ontario, Canada. Davis reports, “When there has been little or no wind in the morning in this park, when the lake is calm and smooth, I have seen monarchs fly out over the lake many times. One time I observed a hawk – a larger hawk such as a red-tailed – flying high and momentarily playing with a monarch over the lake. Perhaps trying to grasp it with its talons. BUT…..a most revealing situation and a one-time observation: the winds appeared to be out of the northeast one day at Presqu’ile, and monarchs had flown out over the lake with a tail wind. THEN….suddenly it became quiet….little wind for perhaps a half hour to an hour…and THEN…..the winds that were part of what must have been a huge circle of a rotating wind system suddenly came from the south or south-west, and all of a sudden, hundreds of monarchs were being blown in to shore from out on the lake. What a magnificent sight! A one-time only sighting.” Davis further reports “I have had reports of boaters way out on Lake Ontario observing monarchs flying south. I have had tag recoveries of monarchs released at Presqu’ile and recovered in Rochester, New York…thus I know that the monarchs set out and try to cross Lake Ontario.” Davis’ tag recoveries include wild monarchs tagged at Presqu’ile Provincial Park and recovered at: Otisco Lake near Marietta, New York; Binghamton, NY; Marcellus, NY; Apalachin, New York; Findley Lake, New York; Olean, New York; and Tully, New York. All of these monarchs were tagged during 1985 and 1988 as part of the Urquhart Insect Migration Association tagging program. Five of these recovery sites are southeast of Presqu’ile Provincial Park, while one is southwest and another is just slightly southwest. Davis did not record prevailing winds at the time, but prevailing winds at Presqu’ile Provincial Park in fall are typically from the west or southwest. Interestingly, Ted McDonald tagged a monarch at Port Hope on the north shore of Lake Ontario and it was recovered in Havana, Cuba.

Are monarchs found over Great Lakes waters during the summer?

Ohio State University’s Stone Laboratory staff members have reported seeing monarchs around the Lake Erie islands in summer. Katie Hollenbeck reports, “We see them all the time, flying about 10-15 feet off the water.” Naturalist Jackie Taylor of the Lake Erie Islands Nature and Wildlife Center has documented monarchs reproducing in the islands for the last four years. She reports, “We usually see our first monarchs beginning in late June. Then we see fall migrants move through the islands in mid-September, flying about 20-30 feet over the water between the islands. The southwest tip of South Bass Island is a favorite rooting site for migrating monarchs.”

A very interesting report of summer monarch activity comes from Dave Agazzi, captain of a fishing charter boat on Lake Michigan. Agazzi has been boating on Lake Michigan for 20 years. He sees monarchs in fall, usually in the afternoon boat trips and flying west or southwest. But on July 19, he was stunned to see a huge influx of insects while on a charter from 1:30 to 6:30 pm. The wind was calm, and they were getting bit by flies and seeing insects they had never seen before. Agazzi noted that one monarch flew by about every 1-2 minutes for the five hours he was on the water, headed due west. He was 10-11 miles offshore from Kenosha, WI. The monarchs never landed on the boat, but came close enough that he was certain of their identification. They were flying fast, about 8-20 feet off the water. Red admirals were also flying, and Agazzi described them as also flying fast but more erratically than the monarchs. Dr. Chip Taylor explained the nature of Agazzi’s observation, stating, “This is evidence indicating the beginning of the premigration migration.”

The premigration migration has also been witnessed by this author in the Lake Erie islands, usually during the first two weeks of August. See this article on this author’s premigration experience during August 2013 on South Bass island www.mlmp.org/Newsletters/monthly/2013/mlmp_update_201308-201309.pdf

So if monarchs can cross Lake Erie, how might they do it?

The flight threshold for monarch butterflies is a thoracic temperature of 55F (Masters, Malcolm & Brower, 1988). Ambient temperatures, along with wind speed and cloud cover conditions, must be suitable to allow for sustained flight across the lake. Notably, lake waters cool much more slowly than surrounding air over land. Surface water temperatures in September for Lake Erie and Lake Ontario range from the high 60s to low 70s. Robert LaPlante, meteorologist for the National Oceanic and Atmospheric Administration and National Weather Service based in Cleveland explains, “Warm air over Lakes Erie and Ontario is present from the middle of July until the middle of October. By mid-October the average surface water temperature has dropped to the mid to upper 50s. During the third quarter of the year (fall), the warm lakes keep the lower few thousand feet of air usually above 60 degrees. The warm air could give monarchs buoyancy over the lake. Sometimes at night there is convergent wind flow of offshore breezes that could produce upward motion over the lake. We could get a line of cumulus clouds and perhaps waterspouts. Lake Erie being the shallowest and the farthest south, gets the warmest of all the Great Lakes so the nocturnal warming or less cooling of the near surface air would be most pronounced over it.” LaPlante further explains, “On a typical sunny day, there normally would not be much rising motion over the lake because it is typically absorbing energy from the sun. During the late summer and early fall, the lake is warmer than the air over the land in the morning so there could be thermals–but what typically happens is that a land or offshore breeze develops at night that moves out over the water and may converge over the center of the lake. This process then reverses in the morning, as the land begins to warm and an onshore breeze develops.” In summary, these warmer air temperatures over the lakes would be sufficient to allow for flight.

Lake Erie can be 30 to 50 miles across. Monarchs could cross that distance using a combination of powered flight and gliding flight. Dr. Chip Taylor explains, “With appropriate cross winds from the northwest, monarchs would get lots of lift and though drifting southeast, would be able to maintain themselves above the surface with minimal effort–a flap, flap every twenty or thirty feet or so. Monarchs have a 3 or 4 to one glide ratio. Meaning that once they gain altitude they can glide 3-4 feet forward for every foot they lose in altitude. If there are tail or quartering winds and the air temperature above the water is high enough–ideally in the mid to high 60s–they should be able to maintain flight with a minimal effort.”

roost-at-South-Bass-Island-2015
Basking monarchs in roost at South Bass Island 2015. Photo by Candy Sarikonda.

What we know and don’t know about monarch movements over Lake Erie

Based on observations by myself and naturalists in the Lake Erie islands, and reports from other citizen scientists in the region, it is clear that monarchs do cross the open waters of Lake Erie. They do so during the summer, as well as in the fall. They are most often seen flying at 20-60 feet above water, but reports of flight altitude range from 8-100 feet above water. Since most observers cannot see beyond a height of 300 feet above them, it is not clear if monarchs may be migrating over the lake at higher altitudes. Glider pilots have seen monarchs at 10,000 feet, and helicopter pilots servicing oil rigs in the Gulf have seen them at 1000-1200 feet. Are monarchs flying at altitudes over 300 feet above Lake Erie? More evidence is needed. Mark Shieldcastle, Research Director for the Black Swamp Bird Observatory, recently reported seeing monarchs fly onshore from Lake Erie routinely at 100 to 200 meters altitude, along the Magee Marsh beach area on the southern shore of Lake Erie. Additional reports such as this will provide valuable information for understanding the altitude of the monarch migration over Lake Erie.

Monarchs have been seen by naturalists and citizen observers gathering in roosts at Point Pelee, South Bass Island and Wendy Park in response to approaching storms and strong sustained winds. Most often, monarchs gather in roosts awaiting warmer weather and calmer winds to continue their migration. Northerly winds facilitate this migration. Notably, monarchs will fly out over the lakes from shore with northerly winds, but they will also fly out in a southerly headwind, suggesting they are deliberate in their attempts to fly across the lake. Their flight during the fall migration is most often reported as southward across the lake, as reported by observers in the present day as well as the Southey Shoals lighthouse keeper in 1937-1938. How winds might affect their flight direction over the open water will need further study. It will be important to document body vector (the monarch’s intended flight direction), in relationship to the monarch’s vanishing bearing (the actual direction of its flight).

How winds affect monarch flight behavior is a subject of study now being undertaken by the Marine Monarchs project. Dr. Chip Taylor and Dr. Tracey Villareal have partnered on the project, with the goal of documenting monarch flight behavior over land as well as on water. An app has been created that will allow observers, both on land and water, to record the vanishing bearings and body vectors (headings) of migrating monarchs. To record the bearings and headings the observer positions him or herself directly behind a monarch that is heading away from the observer. By lining up the compass indicator of the app with the long axis of the departing butterfly and touching the tab, the app reads and records the compass direction indicated by the long axis of the butterfly’s body. The vanishing bearing is the compass heading observed as the butterfly disappears from view. Cross-winds will cause the butterfly to drift to the right or left of the intended heading. True headings are most effectively recorded when there is no wind. When the app is complete, each observation will be linked to a site that provides the current wind speed and direction as well as temperature and cloud cover. By recording flight vectors and vanishing bearings throughout the migration under a variety of physical conditions, it should be possible to establish how monarchs respond to these conditions and to obtain a better understanding of how they reach the overwintering sites in Mexico.

If you see monarchs migrating, PLEASE report your sightings to Journey North. Get involved in the Monarch Watch tagging program. Check the Apple App Store for the new Marine Monarchs app (Monarch Migration – Tracking Monarch Butterfly Migration), and consider participating in this new project to document the monarch migration over land and water. Your reports of monarch migratory behavior are needed to unlock the many mysteries of the monarch migration over water!

Resources and References

Journey North news update: Peak for Great Lakes http://learner.org/jnorth/monarch/fall2015/monarch-butterfly-migration091715.html

Point Pelee National Park monarch information http://www.pc.gc.ca/eng/pn-np/on/pelee/natcul/natcul5/~/media/pn-np/on/Pelee/natcul/Monarch%20fact%20sheet%20ENG.ashx

Lake Erie Islands Nature and Wildlife Center newsletter articles regarding monarch migration and reproductive activity in the islands http://lakeerieislandswildlife.com/?page_id=366

Photos of monarch roosts on South Bass Island, 2014 https://www.flickr.com/photos/candy__kasey/albums/72157647561394606/with/15220175266/

Photos of monarch roosts on South Bass Island, 2015 https://www.flickr.com/photos/candy__kasey/albums/72157658183044290

Surface water temperatures for Lake Erie and Lake Ontario
http://www.erh.noaa.gov/buf/laketemps/laketemps.php

Marine Monarchs project https://sites.cns.utexas.edu/marine_monarchs

Climatic wind data for the U.S. http://www.ncdc.noaa.gov/sites/default/files/attachments/wind1996.pdf

Muscular thermogenesis, flight threshold in insects found in
Hoffmann, K. H. (1985). Environmental physiology and biochemistry of insects. Berlin: Springer-Verlag.

Beall, G. 1941. The Monarch butterfly, Danaus archippus Fab. II. The movement in southern Ontario. Canadian Field-Naturalist (Ottowa) 55:133-137

Brower, L., Fink, L., & Walford, P. (2006). Fueling the fall migration of the monarch butterfly. Integrative and Comparative Biology, 1123-1142.

Gibo, D., & Pallett, M. (1979). Soaring flight of monarch butterflies, Danaus plexippus (Lepidoptera: Danaidae), during the late summer migration in southern Ontario. Can. J. Zool. Canadian Journal of Zoology, 1393-1401.

Gibo, D. (2011). Altitudes attained by migrating monarch butterflies, Danaus p. plexippus (Lepidoptera: Danaidae), as reported by glider pilots. Can. J. Zool. Canadian Journal of Zoology, 571-572.

Masters, A., Malcolm, S., & Brower, L. (1988). Monarch Butterfly (Danaus Plexippus) Thermoregulatory Behavior and Adaptations for Overwintering in Mexico. Ecology, 458-458.

Filed under Monarch Migration | Comments Off on Monarchs Over Lake Erie Waters: Citizen Scientist Observations

Monarch Population Status

6 August 2015 | Author: Chip Taylor

It appears that I’ve made another wrong turn. My monarch GPS keeps saying “Recalculating, recalculating.” I get tired of hearing that refrain but when the GPS insists that you are off the preselected path, it’s wise to pay attention.

When I wrote the last “Monarch Population Status” update on the 16th of July, there was evidence of an uptick in the number of adult monarchs being sighted. I used the frequency and locations of these reports to arrive at the general predictions of where the migratory population was likely to be relatively robust (much of the Midwest) and quite weak (Ontario and the Northeast). The number of reports of sightings increased after 16 July and soon thereafter followed reports of eggs – lots of eggs – mostly in the regions previously identified as likely to have a good migration (Dakotas to Michigan). The number of eggs found and the distribution of these finds now leads me to suspect that the migration through the upper Midwest will be better than any migration seen since 2011. This is good news since the tagging, isotope and observational data suggest that more than 90% of the monarchs reaching Mexico originate in this region. You may recall that temperatures during the breeding seasons of 2012 and 2013 were less than ideal, resulting in population declines each year. Last year the conditions were more favorable and I predicted in May that the population would increase. It did, though not by the amount I expected.

I’m encouraged by the egg data. As I’ve mentioned in previous status updates, the size of the migration is strongly influenced by the number of eggs laid between 20 July and 7 August. Most of the butterflies that result from these eggs become non-reproductive and join the migration from late August through early October as it moves progressively southward starting about the 10th of August at 50N (Winnipeg). The 45-day forecast is also encouraging since it suggests that temperatures will be favorable for the development of the migratory generation. If this forecast is more accurate than the one I used to make my predictions in early May – and conditions during the migration are storm-free – the number of monarchs at the overwintering sites could occupy an area of 1.8 – 2.3 hectares. This would be a substantial improvement given that the total last year was 1.13 hectares and that of the previous year was .67 hectares (see figure below). More would be better of course, since the predicted El Niño could take a toll on the population during the latter part of the coming winter.

It will be a battle but we need to get the overwintering numbers up to at least 4 hectares in the coming years to be assured that sufficient numbers survive in the event of catastrophic winter storms such as those occurring in January 2002 and January/February 2004. To reach the 4-hectare goal (or the 6-hectare objective of the United States Fish and Wildlife Service) will require a massive effort to restore milkweeds in the milkweed/monarch corridor that extends from Texas through Minnesota. The weather during the breeding seasons will need to be favorable as well.

PLANT MILKWEED!

monarch-population-figure-monarchwatch-2015
Figure: Total Area Occupied by Monarch Colonies at Overwintering Sites in Mexico

Filed under Monarch Population Status | Comments Off on Monarch Population Status

Monarch Population Status

16 July 2015 | Author: Chip Taylor

“Recalculating! Recalculating!” That’s what I hear from the GPS system in my car every time I make a wrong turn. The satellite that is tracking my position has detected that I’ve deviated from the course that my system plotted for me when I entered my destination at the start of the trip. The start of the monarch trip that I plotted for this season directed me to a significant increase in the population. Unfortunately, all the data I have been following since posting my optimistic Monarch Population Status report via our Blog on the 6th of May has told me to recalculate the expectations for the fall migration and the overwintering population. As of this writing (16 July), it appears that the fall migration and the overwintering numbers will be similar to those seen last year (1.13 hectares). A substantial increase in the number of migrants and the area of the forests in Mexico occupied by overwintering monarchs is highly unlikely. I was expecting much better.

My earlier prediction was based on 1) the rate of arrival of overwintering monarchs in Texas and Oklahoma, 2) the temperatures in that region in March and April, and 3) the 45-day forecast that predicted favorable temperatures in May and early June. Although the number of monarchs overwintering in Mexico last year was relatively small by historical standards, the number of monarchs returning from Mexico was encouraging. They also arrived later than usual but moved rapidly into Texas with many monarchs reproducing north of the fire ant zone – an area of intense predation on monarch eggs and larvae by those voracious ants. In the past (1996, 2005, 2010), similar arrival patterns and temperatures have resulted in an increase in the population. But, then came May and the bottom fell out. Those favorable temperatures predicted in the 45-day forecast didn’t materialize. Rather, it rained and rained and rained with lower than predicted temperatures. The news reports during May and June were filled with stories of record rains and flooding throughout the South Region (Texas, Oklahoma, Kansas). Moisture-laden air masses swept in from the Pacific across the Southwest – typical of what is often seen as a result of an El Niño in the Pacific and an El Niño did form in late winter (see “Record Strong El Niño Ahead?“). Similarly, moisture swept into Texas and Oklahoma from the Gulf and in Kansas some moisture arrived from the northwest. The forecast didn’t account for these events.

Due to the lower temperatures encountered by the first generation monarchs moving north and northeast during May and early June, the arrival in the northern breeding area was delayed and less than optimal. Monarchs reached Minnesota and portions of western Wisconsin late and in modest numbers, the arrivals east of central Wisconsin were delayed even more and the numbers of first sightings reported to Journey North was quite low. It was worse for the Northeast with few monarchs being seen until well into June. My monarch recalculations now tell me that the number of monarchs in the fall migration will be similar to those seen and tagged last year from the eastern Dakotas to perhaps western Michigan. Lower numbers will be seen from eastern Michigan to western Pennsylvania and still lower numbers will be found in the northeast. And the migration will be late. This will be the third later than normal (as defined by migrations from 1992-2012) in as many years. Why the migration has been late the last three years is not clear. Do these late migrations reflect long-term changes in the weather patterns that drive the monarch numbers or are they due to a series of chance events? Time will tell. Whatever the case, these late migrations show us that the migration and population growth throughout the breeding season are driven by the temperatures and rainfall that occur from the moment monarchs leave the overwintering sites (late February through early April) to the time the last monarchs arrive at the overwintering sites (December).

That said, the numbers of monarchs we’re seeing now are also a reflection of the amount and quality of milkweed and nectar plant habitat that remains for the breeding population. Loss of habitat is a topic I’ve covered many times. For a discussion of this topic and what needs to be done to address these losses, please read my Monarch Butterfly Recovery Plan memo.

Filed under Monarch Population Status | 5 Comments »