Monarch Watch Blog

Monarch Population Status

17 June 2019 | Author: Chip Taylor

Stage 4 (1 May–9 June) Update

As I indicated in the Status of the Population post to the Monarch Watch Blog on 2 May, I partition the annual cycle into 6 stages in an effort to understand the interannual variation in monarch numbers. This stage–specific model breaks down as follows: 1) overwintering (late Oct–early April); 2) return migration through Mexico (late Feb–April); 3) breeding in the US in March and April; 4) recolonization of the regions north of 37N (May–early June); 5) summer breeding north of 37N (June–August); and 6) fall migration (August–Oct). While there is some overlap, each stage is intended to capture the dominant activity during that period. For example, in Stage 3 (March–April) monarchs continue arriving from Mexico through most of March; later, in the second half of April, some first-generation monarchs are beginning to move north. Nevertheless, the most important action during that stage – the one that has the greatest impact on the population – is the reproductive success of the monarchs that returned to the South Region from Mexico.

In the earlier posting, I provided an estimate based on the conditions observed through Stage 3. Specifically, I said “my current prediction is that the overwintering population will be in the range of 4–5 hectares. At this writing, I see the population as trending toward 4 hectares.”

We are now at the end of Stage 4 (1 May–9 June). It is during this stage that the majority of first–generation monarchs originating from the South Region (primarily Texas and Oklahoma) migrate north to colonize the areas north of 37N (40N more precisely defines the southern limit of the northern breeding range in terms of numbers of monarchs generated that join the fall migration yet 37N is more inclusive). This stage ends on the 9th of June. The end date is somewhat arbitrary. We know that monarchs stop directional, hence migratory, flight sometime in early June but are not sure when. However, directional flight appears to stop before the 9th. We haven’t been able to detect directional flight after the 6th of June in Lawrence, KS. Data are needed on this feature of the annual cycle. Sightings recorded after this date are assumed to represent butterflies that had arrived in the area before the 10th. In fact, there is little evidence in the first sightings data reported to Journey North of an expansion of the northern distribution of monarchs after 9 June.

Recolonization is all about timing and numbers. In 2012, the monarchs arrived in the northern breeding areas too soon and in 2013 too late, and in both years the population declined. This observation tells us there is a “sweet spot” or optimal set of dates to arrive in the northern breeding areas. Our original assessment was that the optimal period was between 11–30 May. It now appears that this should be shortened to 16–30 May. The following is how the first sightings reported to Journey North break out this year vs 2018.

Table. First sightings north of 37N and east of 110W.

  1–15 May 16–30 May 31 May–9 June Total sightings
2019 10.6% 63.3% 26.1% 1244
2018 24.7% 58.7% 16.6% 945

So, what can be said about these data? First, the number of first sightings for these two years are the highest in the Journey North first sightings records. These numbers probably reflect both excellent returns and a larger number of people willing to report first sightings. In 2018, the higher percentage of first sightings from 1–15 May combined with favorable temperatures for larval development immediately after arrival in the northern area may have aided population growth. The higher number of first sightings this year, especially in the north central region (Michigan, Indiana, Ohio, Ontario), is also a positive. Overall, both years are exceptional and quite similar, and since we know that the first sightings of 2018 were a precursor to an overwintering population of 6.05 hectares, the highest number recorded since 2006, what do the 2019 numbers tell us about the overwintering numbers in 2019–2020? Should we expect another population of 6 hectares? Maybe, but it’s too early to say. We still have to see how Stage 5 works out. Right now, in most of the breeding area, the prospects for a normal summer and a reasonably robust population look quite good. The exception is the northeast (east of Toronto in Canada, and most of eastern New York, Pennsylvania and north through New England. The colonization of those areas by first generation monarchs was scanty with low temperatures for the first half of June. Further, a colder than normal summer is predicted for most of that region which will retard population development. The migration in the east this fall will be on the low side relative to good years.

After Stage 4, I said the overwintering population was likely to be between 4–5 hectares and trending toward 4. Stage 5 recolonization has been excellent with respect to both timing and numbers, with the exception of the northeast. Based on the recolonization data and the long–term temperature forecasts for the Upper Midwest and the north central region, my prediction is that the 2019–2020 overwintering population will be at least 5 hectares and could trend toward 6 hectares if the summer temperatures from 80W (western Pennsylvania) to the west (105W) average at least a degree above the long–term averages.

I’ll update this prediction, if necessary, for the premigration newsletter and will summarize the outcome of Stage 5 (June–August) in early September.

I wish to thank Janis Lentz for her assistance in summarizing data for this article.

Filed under Monarch Population Status | Comments Off on Monarch Population Status
Monarch Population Status

2 May 2019 | Author: Chip Taylor

Stage 3 (March–April) Update

As most of you know, I endeavor to predict how the monarch population is developing each year. While I always fail to correctly predict the exact number of hectares measured at the overwintering sites, I’m getting better at it with each iteration. Last year it was evident as early as March that the population was going to increase substantially from the relatively low numbers measured in 2017 (2.48 hectares). After watching the population develop through March and April by tracking both first sightings reported to Journey North and then following the colonization of the northern breeding areas (>37N) in May and early June, it was even clearer that the migratory and overwintering population was going to be much larger than recorded in 2017. I then followed the conditions during the summer months, and again, all signs were positive and it was clear that the overwintering hectares would be at least as great as those of 2008 (5.06 hectares) and perhaps larger. My final prediction was that the overwinter population was going to be greater than 5 hectares, but I couldn’t say how much greater. I predicted the direction of change correctly and was close on the magnitude of change but missed the mark. The actual total was 6.05 hectares. Which brings me to why this is the Stage 3 Update.

In March I conducted a webinar of monarch population development through the sponsorship of the Monarch Joint Venture and the cooperation and facilities of the US Fish and Wildlife Service. In that webinar I introduced the idea of developing a Stage Specific Model for Monarch Population Development. This verbal model is based on my attempts to understand the interannual variation in monarch numbers. The data used to derive these predictions are based on the conditions associated with the growth of the monarch populations each year from 1996 to the present. These data include patterns associated with first sightings, rates and times of colonization and physical conditions, mostly temperatures, from March through October. There is a narrative for each year. Comparing and contrasting the responses of the population from year to year and particularly for years with extreme conditions has shaped this approach.

To understand the monarch annual cycle, I break down the year into 6 stages: 1) overwintering (late Oct–early April; 2) return migration through Mexico (late Feb–April); 3) breeding in the US in March and April; 4) recolonization of the regions north of 37N (May–early June); 5) summer breeding north of 37N (June–August) and 6) fall migration (August–Oct). Although overwintering mortality varies from year to year, the available mortality data for this stage are too fragmentary to be used in the model. Similarly, there are no estimates of the mortality experienced by monarchs from the time they leave the colonies to when they reach the milkweed rich areas of Texas. Mortality during this 600-800mile journey could be significant due to spring droughts, high temperatures and strong winds. Lacking these measures, we are left with first sightings in the US, mostly in Texas and Oklahoma, as a surrogate for both the relative survival and fitness of the overwintering population and the return migration. While first sightings have a number of limitations, the number of sightings as well as the temporal and spatial distribution of these sightings when examined in the context of the physical conditions and comparisons across years can be quite useful. I will deal with first sightings and my methods in greater depth at a later date. In the meantime, if interested, you might check out the webinar to see some useful year to year comparisons:

https://fws.rev.vbrick.com/sharevideo/3a32c09e-7d3d-45c7-9fa0-09d6913e6474

Getting back to Stage 3, it’s the critical period that sets the stage for what could happen through the rest of the season. Briefly, the key factors in Stage 3 are 1) the returning number of monarchs 2) their condition upon arrival, i.e. their structural and physiological conditions 3) the spatial and temporal distribution of the new arrivals through March and April 4) the temperatures that determine #3 and 5) the number of and spatial and temporal distribution of eggs as determined by 1-4. The distribution and abundance of fire ants could also be a factor, but there doesn’t seem to be any way to assess this threat though it is known that fire ant numbers decrease under drought conditions and increase when precipitation favors plant and insect growth.

Now that Stage 3 is at an end, we can compare the conditions during this past March and April with those of last year and previous years to get a rough approximation as to what to expect during the fall migration and next winter in Mexico. First, I can say unequivocally that the fall migration will not be as robust as last year and that the overwintering number of hectares will be less than 6.05 hectares. The conditions for Stages 3, 4 and 5 last year were all favorable for population growth. In Stage 3, the mean temperatures for March in Texas were 5.4 F above normal, yet due to cold temperatures that hovered over Oklahoma and north Texas the majority of returning monarchs were effectively confined to Texas through March and early April. These conditions have two outcomes, 1) most of the eggs laid by the returning monarchs were laid in Texas and 2) due to the higher temperatures, the larvae and pupae developed rapidly thus exposing the developing matures to lower rates of predation and parasitism. Another consequence of these conditions was a low mean age to first reproduction (egg to egg interval) for the first generation. A key factor in population growth is age to first reproduction with the fastest growing populations having the shortest age to first reproduction. The higher mean temperatures during Stage 4 (May and early June) facilitated recolonization of the summer monarch breeding areas north of 37N. As the first-generation monarchs arrived in the northern areas in the first part of June, the temperatures were again favorable for both flight and egg laying – more so than in most years. The good starting numbers and conditions in the northern breeding areas resulting from the conditions in Stages 3 and 4 were followed by warmer than normal summer temperatures in the Upper Midwest. Although 2F higher than normal, these temperatures were not in the range that results in drought conditions and lower life expectancy of adults and therefore a reduction in realized fecundity. The bottom line on 2018 is that the conditions in Stages 3-5 were the best since 2001 and may actually have been better than recorded for 2001.

So, what can we expect this coming fall and winter? Based on first sightings, temperatures, probable egg distributions, generation length and early May conditions, my current prediction is that the overwintering population will be in the range of 4-5 hectares. At this writing, I see the population as trending toward 4 hectares. However, higher than average temperatures for May and June-August in the Upper Midwest could result in a population that is closer to 5 hectares.

The positive conditions in Stage 3 this year include the highest number of first sighting recorded in the central flyway since Journey North has been recording these data. That seems to tell us that the relatively large population of 2018–2019 wintered well, in spite of reports that the butterflies were abnormally active during the winter, and navigated from the colony sites back to Texas without experiencing high mortality. Temperatures in Texas were lower than in 2018 which had the effect of again confining most of the egg laying by returning monarchs to Texas but also increased exposure to predators and parasites and increased generation length. Overall, the first generation produced in Texas and southern Oklahoma could be larger than in 2018 due to the larger number of returning monarchs. While that could be true, the predators and parasites could be more abundant this year. Unfortunately, we have no measures of the year to year variation in egg and larval mortality resulting from these causes. Due to the lower temperatures, the average date of departure from Texas and Oklahoma for first generation monarchs should be a bit later this year. That may not be a bad thing since the forecasts indicate that conditions for recolonizing the northern breeding areas won’t be favorable until the second half of May.

The bottom line for Stage 3 this year is that we can expect monarchs to have another good year, not as good as 2018, but a good year – assuming near average temperatures of Stages 4 (May–early June) and 5 (summer).

Filed under Monarch Population Status | Comments Off on Monarch Population Status
Monarch Population Status

15 March 2019 | Author: Chip Taylor

Will the population increase again this year? Last season the population increased from 2.48 hectares to 6.05 (see the January 30th Monarch Population Status announcement). If the monarchs wintered well, that is with a normal rate of mortality and morbidity, that should result in a relatively large (compared to recent years) returning population with the potential to yield another large migration and overwintering population. Right? Maybe and maybe not.

To forecast what might happen we have to know what happens during March and April in the South Region and then what happens in May as the first generation moves northward. Timing and numbers are critical to understanding the prospects that the population will grow or decline.

Ok, so what is happening now? There is good news, some questions and perhaps more good news.

The first bit of good news is the sighting of 27 monarchs in Texas in the first 10 days of March. That’s the highest number for this period since Journey North started keeping records in 2000. Some of these records indicate that monarchs are well into Texas, having reached Austin and beyond. The question is how many monarchs are already in Texas and how many are still moving northward through Mexico? It is probable that most of the monarchs are still en route and we know that substantial numbers still remain at some of the colonies.

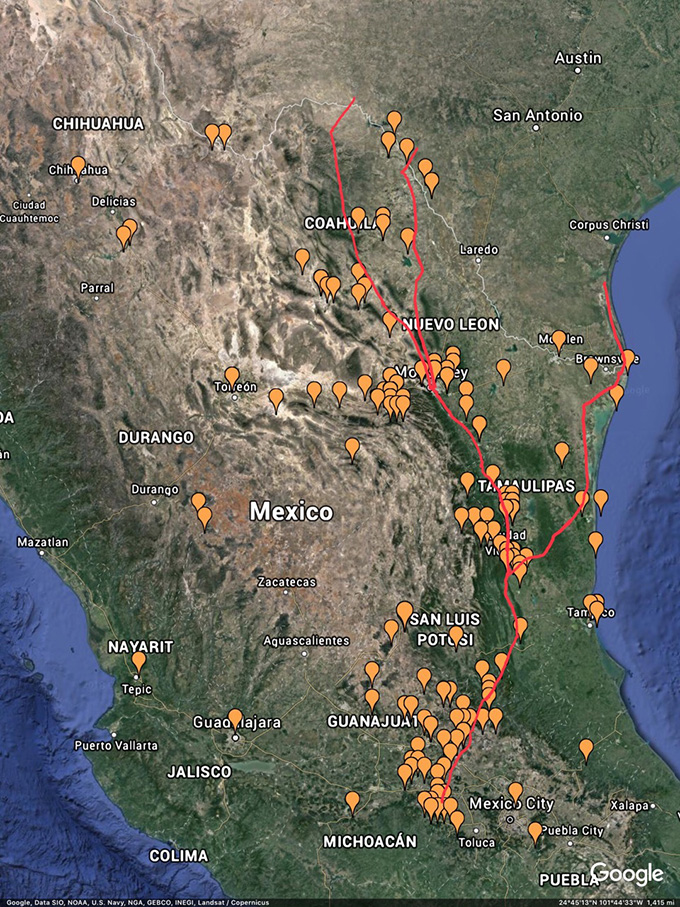
I raise this issue because it looks like the two monarch pathways through Mexico (see figure below) are going to be shut down by cold weather from 15-22 March. This shutdown could mean that once the weather warms in northeast Mexico, monarchs could flood into Texas after the 22nd. The effect would be late arrivals for the majority of monarchs coming out of Mexico and that would not be a good thing. The peak arrival in Texas is usually from 21-25 March and often from 26-30 March. Later arrivals are often associated with lower population numbers.

The good news comes in twos. First, the weather for monarchs that have already reached Texas will be favorable for feeding, mating, egg laying, larval growth rate and movement to the northeast. Secondly, the long range forecast, if accurate, indicates that most of the returning monarchs will lay the majority of their eggs in Texas, and the southern half of Oklahoma. Restricting egg production to Texas and Oklahoma is a good thing since it will minimize the average age to first reproduction of the progeny of the returning monarchs. The population has increased each year egg distribution has been limited to the lower portion of the South Region.

Returning monarchs that have survived to mid-April in Oklahoma will be able to continue moving northeast once the daytime highs reach the lower 70s. A few of these may reach Kansas but the number reaching northeast Kansas, where I am, will be few, if any, unless the forecast is wrong and the numbers returning to Texas are higher than in recent years.

The bottom line — I’m cautiously optimistic that the population will get off to a good start this breeding season. I’m keeping my fingers crossed that my key assumptions – good returning numbers, restricted egg laying, and favorable weather conditions – will be validated in time.

The figure below represents the two main pathways by which returning monarchs enter Texas from Mexico. The distance along the coastal pathway to the milkweed-rich areas of Texas is about 600 miles. The montane or interior pathway is about 800 miles. The latter appears to be the favored route since the temperatures along the coastal pathway are often too high for migratory flight. The location markers represent all spring first sightings reported to Journey North for Mexico. Figure created by Janis Lentz.

Addendum
The flow of overwintered monarchs returning to Texas continued after the 10th and through the 14th 75 first sightings had been reported to Journey North. However, since Journey North hasn’t picked up the sightings posted to our email discussion list (Dplex-L) and perhaps some posted to Facebook, this number is an underestimate. Further, there have been at least four reports of sightings of 20 or more monarchs seen moving N/NE at different locations. These sightings of multiple monarchs on the move in short time periods are unprecedented. A review of the Journey North first sightings from 2000 to present shows that there was only one other year, 2012, with a similar number of sightings through the 14th – 87. As you may recall, March of 2012 was hottest ever recorded in the U.S. The population declined that year from 2.89 to 1.19 hectares. Now, as in 2012, substantial numbers of monarchs have advanced into areas ahead of the appearance of milkweeds. The Journey North Map of first sightings for 2012 indicates that the returning migrants moved too far north too soon, a factor that probably contributed to the lower numbers the following winter. That scenario seems unlikely to develop this year. According to the long-range forecasts, the temperatures are likely to limit most of the northern movement in the Midwest to Texas and Oklahoma. I’ve said it before “Every year is different yet every year is the same”. The trick is to distinguish what is the same through the multi-decade record from what is different each year and among years. – CT

Filed under Monarch Population Status | Comments Off on Monarch Population Status
Monarch Population Status

30 January 2019 | Author: Jim Lovett

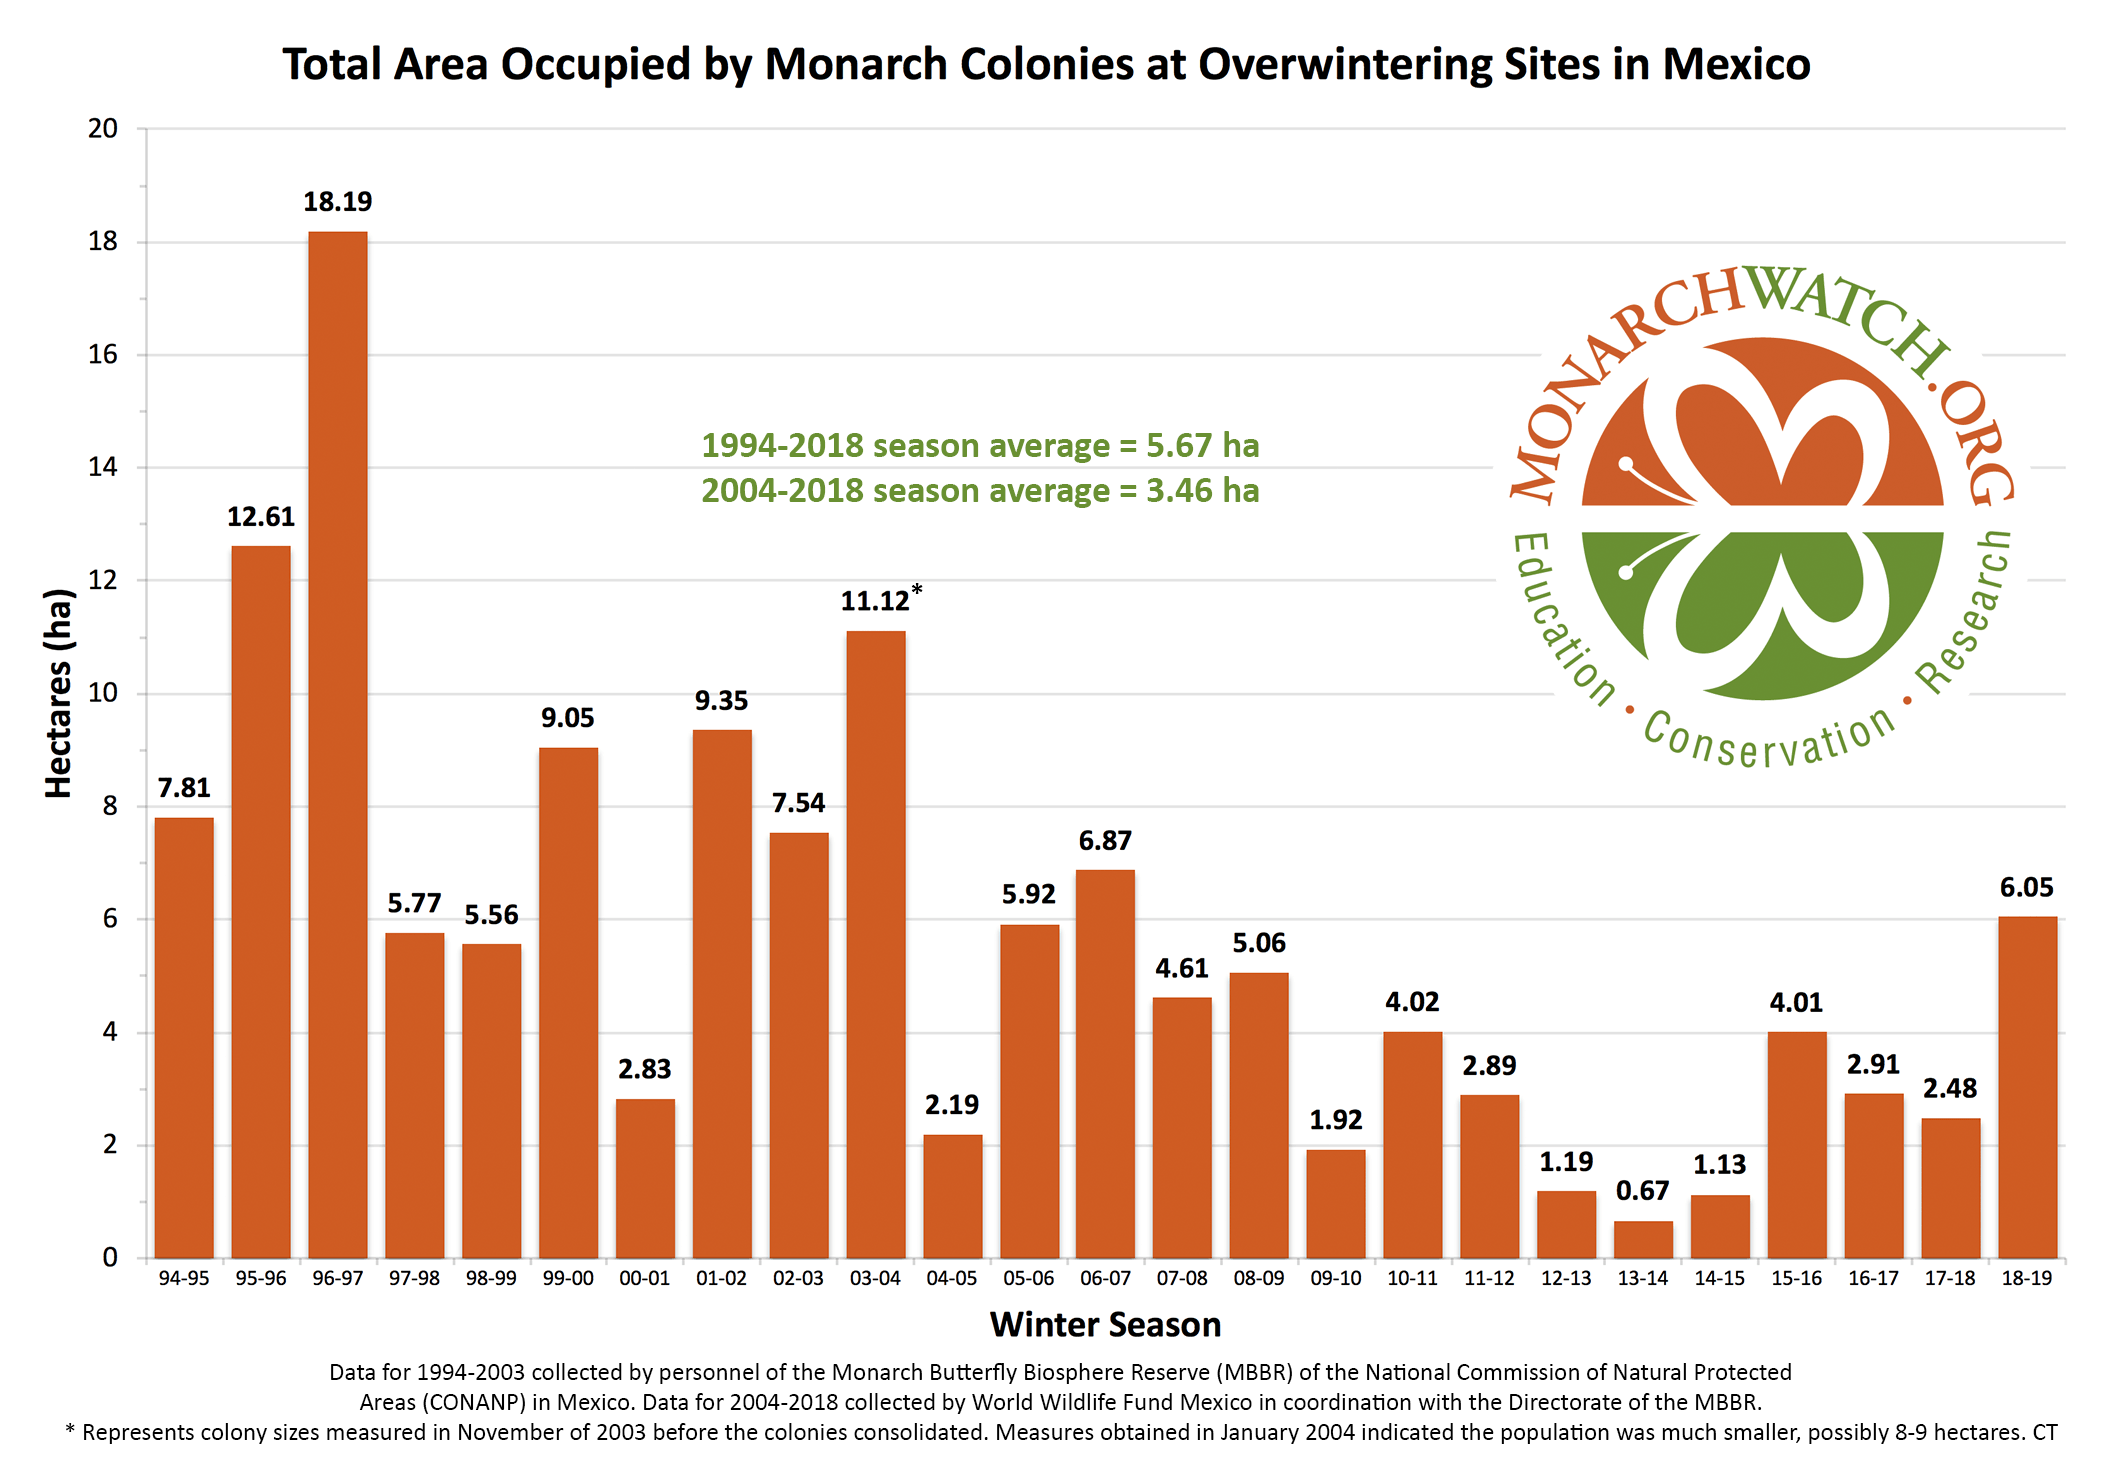
World Wildlife Fund Mexico in collaboration with CONANP and the Monarch Butterfly Biosphere Reserve (MBBR) announced the total forest area occupied by overwintering monarch colonies today. Fourteen (14) colonies were located this winter season with a total area of 6.05 hectares, a 144% increase from the previous season:

monarch-population-figure-monarchwatch-2018
Figure 1. Total Area Occupied by Monarch Colonies at Overwintering Sites in Mexico

We will provide additional details as we receive and process them.

WWF release (in spanish): Aumenta 144% la presencia de la mariposa Monarca en los bosques mexicanos de hibernación

Filed under Monarch Population Status | Comments Off on Monarch Population Status
Monarch Population Status

10 September 2018 | Author: Chip Taylor

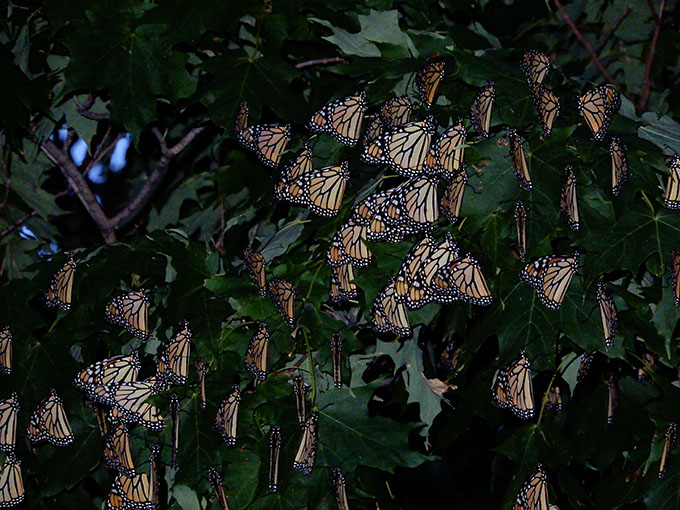
It’s been more than a few years since we have seen a monarch migration as promising as the one that is taking place at this time (early September). The first fall roosts were reported to Journey North on the 11 August in Sauk Centre, Minnesota (45.7 N) and reports of additional roosts soon followed. There were multiple reports from Sauk Centre with the highest numbers reported on 30 and 31 August. Most of the roosts have been reported in the western portion of the Upper Midwest (eastern Dakotas to central Minnesota), but a number of others have been reported in eastern Ontario, Michigan, New York, and Ohio. Data for all the roost reports to Journey North can be found at: Journey North Monarch Roost Report 2018. A screen shot of the location of the roosts through 3 September is shown in Figure 1. To follow the roosts and therefore the migration visit Journey North Monarch Roost Map 2018. While the numbers of reported roosts through 2 September is encouraging, and is a signal of a robust migration, the estimated numbers of monarchs are also higher than seen in several years with 17 different roosts estimated to contain 1000 or more monarchs.


Figure 1. Distribution of overnight monarchs roosts reported to Journey North through 2 September 2018.

Tagging 2018

Interest in tagging has grown. Last year, a year with a moderate population (2.48 hectares) one that I was actually expecting to be larger, we issued over 320,000 tags. That was largest number of tags issued in one year to date. The returned data sheets have not all been tallied, but we are closing in on the final numbers and it appears that over 140,000 butterflies were tagged last season. That may well have been the highest proportion of tags applied of those issued since we started tagging in 1992. The highest number of tags applied in the past was estimated to be >106,000 in 2001. Requests for tags are off the charts again this year and due to the high demand we ordered extra tags. Unfortunately, they will all be spoken for by the time you read this. In fact, data sheets in both digital and paper form are being received at this time from those who tagged in the most northerly locations. Domestic recoveries, that is those within the US or Canada, are also being reported. Most, perhaps 90%, of these recoveries are of butterflies tagged within a mile or two of where they were observed. These reports tell us little about the migration. As a consequence, we assign less attention to these recoveries than those from Mexico, but there are some gems among these domestic recoveries and we will get to these in time. Please understand it takes us months to record all the records involved with the tagging program with our relatively small staff and the help of volunteers.

Overwintering numbers and fall conditions

In previous posts I’ve pointed out that the sequence of events and temperatures that determine how the monarch population grows through the season has been better this year than for any year since 2001. Based on this I’ve been projecting an overwintering population of 5 hectares, perhaps a bit more depending on the level of monarch production in the western portion of the Upper Midwest (longitudes 95W – 100W). Reporting from states in that region is typically minimal, but we recently received reports of substantial numbers of monarchs from western Kansas and the central Dakotas suggesting a good migration is underway through that area.

The last overwintering population of 5 hectares occurred in 2008 and this migration should reach that number, but there is still a big unknown. Will the fall conditions favor survival during the migration? We don’t really know how to answer this question. We can look to weather forecasts and nectar availability as inferred from drought indices, but we don’t really know how monarchs are affected negatively by weather events or nectar scarcity. While the long-range forecasts suggest average or slightly below average temperatures from the Upper Midwest through Texas, drought conditions in key areas could present problems for migrating monarchs, particularly in Texas, as shown in Figure 2. Most of the migration through Texas occurs in October so should sufficient rains occur, nectar scarcity would not be an issue. Monarchs still have to pass through northern Mexico, a traverse of another 600 miles or more depending on the routes taken. Unfortunately, there is no up to date information on the drought conditions in this region. The 31 July report from the North American Drought Monitor website suggested that the region was not abnormally dry, but that was before August, which is typically a dry month in that region.


Figure 2. Drought monitor showing increasing drought severity based on color gradients as of 28 August 2018.

Filed under Monarch Population Status | Comments Off on Monarch Population Status
A Message to all Taggers

3 August 2018 | Author: Chip Taylor

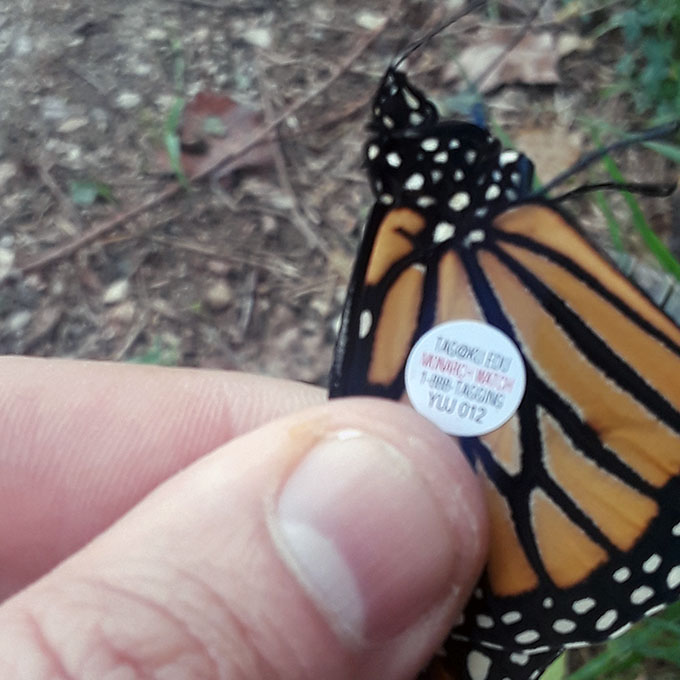
Hear ye! Hear ye! Taggers take note! What you have contributed to monarch science over the years has been incredible! Collectively, you have tagged well over 1.5 million monarchs in the last 26 years, from the front range in Colorado to the Maritime Provinces in Canada. Further, you have tagged from the beginning of the migration in the vicinity of Winnipeg in early August until the last monarchs cross the border into Mexico in November. It is an amazing record that continues to provide new insights about the dynamics of the monarch migration. Congratulations and thank you.

We are often asked why we keep tagging. We know where monarchs come from that reach Mexico, right? The answer is yes, we do, but tagging and recovery of tagged monarchs is about more than origins. It’s about patterns that tell us what areas of the country contribute most to the overwintering numbers. It’s about the flow of the migrations, that is, how the migration progresses from its start in Canada to its end at the overwintering sites in Mexico. It’s about the influence of weather on migrations and the impact of habitat loss. It’s about the sex ratios and mortality during the migration and it’s even about events that happened 7-8 months before the migration. We are in the process of analyzing over 1.3 million tagging records and more than 13,000 recoveries and, I can tell you, the tagging results have things to say about all these points and more. The amount of monarch habitat is changing along with the climate and it turns out that tagging is one way of monitoring these changes. So please keep tagging from the start to the end of each migration. Your data are of great value.

Filed under Monarch Tagging | Comments Off on A Message to all Taggers

Monarch Population Status

3 August 2018 | Author: Chip Taylor

When it comes to estimating the size of the migration, each year is a series of experiments, with numerous hypotheses, during which I try to match what I know about monarchs with the progression of the seasonal conditions that influence both monarch behavior and plant growth. To make projections for each fall migration and overwintering population, I start with the numbers of monarchs measured at the overwintering sites in Mexico. Next, I focus on overwintering mortality, followed by the spring conditions as monarchs move northward from the overwintering sites to the milkweed areas in south and central Texas, and then the conditions in the South Region (TX, OK, LA, AR, KS) during the growth of the first generation in March and April. That is followed by attention to the conditions during the period from 1 May-9 June that allow, or don’t allow, first generation monarchs to reach the northern breeding grounds. Summer temperatures along with the seasonal distribution and amounts of rainfall are also in focus when estimating the fall and winter numbers. These stage and time specific assessments provide the context for a number of hypotheses or projections concerning the coming migration and the opportunities to tag monarchs each season. Sometimes I’m on the mark and sometimes I’m wrong. The point is to not only give those interested an idea of what to expect but to learn from my mistakes and few successes. Last year, I predicted a large population in the Northeast in general and for Cape May in particular. I was right on the money. However, I underestimated the impact of the drought that ranged from the eastern Dakotas through western Minnesota down through western Iowa. I also overestimated the production of monarchs in the rest of the Upper Midwest with the overall result that the overwintering population of 2.48 hectares was lower than the near 4 hectares I was expecting. These differences were reflected in the number of overnight roosts reported to Journey North through the migration and the relative success of taggers in the East and Midwest. Still, it was a great tagging season.

So, let’s see if I can do better this year. With respect to the Northeast, this should be another good season, although not as good as last year. In Canada, eastern Quebec will be down, but most of Ontario is on track to produce a substantial number of fall monarchs. The counts of monarchs per hour at Cape May will be lower this year, but will still be well above the long-term average. On the positive side, in the Upper Midwest, unless I’ve misjudged the situation once again, the migration should be the strongest since 2008 (a 5-hectare year) with the real possibility that the overwintering population could hit 5 hectares once again. Let’s see if I’m correct.

Filed under Monarch Population Status | Comments Off on Monarch Population Status
Dr. Lincoln Brower

2 August 2018 | Author: Chip Taylor

An appreciation for Dr. Lincoln Brower who passed away on 17 July 2018 at his home in Virginia.

If you are familiar at all with monarch butterflies, you are certainly familiar with some of Linc’s many contributions to our knowledge of monarchs. Linc was a leader, often a singular voice on behalf of the monarch migration. It was through his advocacy and work with the Mexican government that the Monarch Butterfly Biosphere Reserve (MBBR) was established to protect the overwintering monarch population in Mexico. Linc was among the first to recognize that the weakest portion of the monarch’s annual cycle is the formation of the overwintering colonies within the oyamel forests on a few mountain tops in a relatively small region of central Mexico. He saw that protection of these sites was key to the preservation of the monarch migration and he worked tirelessly to safeguard these locations, sometimes earning the wrath of authorities and some colleagues. Yet, he was steadfast in his advocacy. To understand the relationship of the forest and the overwintering population, Linc, along with colleagues, undertook numerous studies to document everything from the microclimates of the forest to overwintering mortality due to predators and winter storms.

He was also a pioneer in the studies of plant/insect/predator interactions through his classic studies of the importance of cardenolides in milkweeds that provide protection to monarchs that consume the foliage as larvae. Through these studies he became a major contributor to the emerging field of ecological chemistry. The singular, and now iconic, picture of a young blue jay on the cover of Scientific American in 1969 had the effect of drawing attention to the complexities of plant/insect and predator relationships within and outside of mimicry complexes involving butterflies and other insects. This was the stuff of textbooks and courses in ecology and entomology. The diversity and quality of Linc’s many publications were recognized by numerous organizations that support conservation and by the scientific community as well. In 2007, on occasion of his 75th birthday, the Fifth International Conference on the Biology of Butterflies held a meeting in Rome at which Linc was honored for his scientific achievements. Two pictures from that event are provided below.


Lincoln Brower, Michael Boppre, Linda Fink, Toni Taylor, Chip Taylor, Steve Malcolm,
Myron “Meron” Zalucki, Dick Vane-Wright, Sonia Altizer, Karen Oberhauser

Lincoln Brower and I go back a long way. I first met Linc while working as Dr. Charles Remington’s assistant at Yale in 1960. Linc earned his PhD at Yale (1957) and frequently returned to visit with colleagues. Encounters with Linc were rare in the early years of my career. I worked on hybridization in sulphur butterflies for my PhD and through my early years at the University of Kansas. By 1973 it became clear that I was becoming increasingly, and dangerously, allergic to these butterflies forcing me to reinvent my self as a honeybee biologist studying Neotropical African honey bees (killer bees), an episode that lasted 22 years. As a person fascinated with butterflies, I followed Linc’s work on monarchs with interest throughout these early decades of my career. He may have known a bit about my work as well. Given changes in funding for honeybee research that were on the horizon, I decided to become involved with monarchs starting with a tagging program in 1992.

This brought me into contact with Linc once again. Though I thought I was well informed about monarchs, I was in fact quite naïve and I remember declaring to Linc that I thought there must certainly be other monarch overwintering sites. He was a bit bemused and gentle with me and with a bit more experience I soon abandoned the notion that the monarchs held secrets that Linc didn’t know. Because of my work with monarchs, Linc and I participated in a number of of the same meetings and have been members of organizations that have promoted monarch conservation. Through our interactions I found Linc to be the consummate protectionist, seeking always to maintain the status quo and resisting change. I’m more of a pragmatist in that I’m more willing to accept that there are processes in place that we can’t change but need to adjust to. He perhaps saw me as being too willing to accept change and I saw him as quite ridgid. These approaches clashed from time to time but, to both our credits, these relatively unimportant differences never became public. Nevertheless, as I pointed out to Linc in an email shortly before his death, though we saw things differently from time to time, we had always been on the same side in wanting the monarch migration to continue for generations to come.

Links to obituaries for Dr. Lincoln Brower and a blue jay/monarch story are found below.

Sweet Briar College:
http://sbc.edu/news/renowned-monarch-butterfly-expert-lincoln-brower-dies-but-his-legacy-lives-on/

New York Times:
https://www.nytimes.com/2018/07/24/obituaries/lincoln-brower-champion-of-the-monarch-butterfly-dies-at-86.html

Today:
https://www.today.com/news/life-well-lived-monarch-butterfly-scientist-dr-lincoln-brower-dies-t134589

LA Times:
http://www.latimes.com/local/obituaries/la-me-lincoln-brower-20180720-story.html

Monarch Joint Venture:
https://monarchjointventure.org/news-events/news/remembering-lincoln-brower-a-world-renowned-monarch-conservation-leader

Science Friday:
https://www.sciencefriday.com/articles/the-case-of-the-barfing-blue-jay/

Filed under General | Comments Off on Dr. Lincoln Brower

Monarch Habitat Restoration in Oklahoma

2 August 2018 | Author: Chip Taylor

Monarch Watch is continuing to partner with Tribal Environmental Action for Monarchs (TEAM) and Tribal Alliance for Pollinators (TAP) on habitat restoration efforts in Oklahoma. TEAM is a coalition of seven Native American tribal nations (Chickasaw, Seminole, Citizen Potawatomi, Muscogee Creek, Osage, Miami and Eastern Shawnee) that are taking part in a three year comprehensive training program learning all aspects of habitat restoration and native plant production. Each one of the TEAM partner tribes pledged to plant 5,000 milkweeds and 4,000 native nectar plants on their tribal lands as a part of the program. TAP is a new organization that was created to share the best practices and training protocols developed by TEAM to a larger audience of tribal nations who are seeking technical assistance in restoring habitat for monarchs and pollinators.

Jane Breckinridge, Euchee Butterfly Farm, Bixby, OK and Chip Taylor, Monarch Watch


Seminole Nation Assistant Chief Lewis Johnson and Seminole Nation Parks and Wildlife Director Shane Phillips help to plant 1,500 milkweeds at the Mekusukey Mission restoration site on their tribal lands near Shawnee, Oklahoma, on May 25, 2018.

Filed under General, Monarch Conservation | Comments Off on Monarch Habitat Restoration in Oklahoma

The monarch decline: when did it begin?

2 August 2018 | Author: Chip Taylor

Monarch Watch began with a simple tagging program in 1992 followed, in the early years of our program, by attempts to educate the public about monarch biology and research. More recently, our emphasis has been on monarch conservation. The conservation outreach began to increase in importance during the scramble to understand the consequences of the introduction of corn genetically modified to express the endotoxins of Bt strains* in corn tissues, one of which was airborne pollen. Corn pollen containing Bt toxins, when concentrated on milkweed leaves, had been shown to have the potential to kill developing monarch larvae**. During studies (1999-2001) to establish the seriousness of this problem, surveys of monarch production revealed that corn and soybean fields containing milkweeds produced MORE monarchs per acre than other common habitats containing milkweeds. At the same time, soy and corn genetic lines were being introduced, and progressively adopted, that were resistant to the broad spectrum herbicide known as Roundup (glyphosate). These genetically modified crop lines allowed farmers to spray their crops with Roundup to control weeds without damaging the crops. I began to write about this development with some concern in 2001, but the full impact of this technology became apparent when I received an email from a farmer in Nebraska in 2004. My response to this email has been buried among our archived monthly updates. We’ve reprinted this text below for those interested in how this new technology shifted our focus and outreach at Monarch Watch. The realization that the adoption of these genetically modified crops was likely to have an impact on monarch numbers led to the development of the Monarch Waystation program in 2005 and later the Bring Back the Monarchs program in 2010.

Adoption rates of Roundup Ready corn and soybeans increased rapid and milkweeds all but disappeared from these row crops in the Upper Midwest by 2006 (Fig 1). Monarchs numbers, as measured at the overwintering sites in Mexico, began to decline noticeably around the same time. If the decline in milkweeds in the Upper Midwest was the cause of the decline, we might expect to see that reflected in the tagging data in two ways 1) a decline in the success of taggers in the affected areas and 2) a shift in the proportion of tags applied each year within non-affected areas to the east. Data establishing whether either or both of these expectations/signals are present in the 1.5 million tagging records for the last 20 years will be presented at a later date.


Figure 1. Adoption of herbicide tolerant crops vs decline in monarch overwintering population

*Bacillus thuringiensis – https://en.wikipedia.org/wiki/Bacillus_thuringiensis
**Due to the subsequent adoption of corn lines that did not express the Bt endotoxins strongly in pollen and the dynamics of the shedding and concentration of pollen on milkweed leaves within and adjacent to corn fields, none of the Bt corn/monarch studies demonstrated that significant numbers of monarch larvae were exposed to and died from lethal does of Bt containing pollen.

The links in the original June 2004 article are broken but the links included here cover the same issues raised in the original text.

Roundup resistant weeds:

http://weedscience.org/summary/moa.aspx?MOAID=12
https://www.ars.usda.gov/ARSUserFiles/64022000/Publications/Reddy/Nandula-GRW12.pdf


Milkweed in corn and soybean fields.

Effects of Transgenic Crops on Milkweeds – by Chip Taylor, June 2004

How do transgenic crops affect the distribution and abundance of milkweeds?

In the 2001 Monarch Watch Season Summary (p59) I addressed the possibility that the widespread planting of Roundup Ready corn and soybeans could lead to the decline of the common milkweeds in much of the northern breeding area for monarchs:

“Almost unnoticed in this controversy has been the rapid adoption of herbicide resistant (transgenic) corn and soybeans by farmers throughout the Midwest. These crops are extolled for their value in weed control. Growers can plant these crops and then apply herbicides (principally Roundup) to control weeds without concern that the corn will be stunted or killed by the toxin. Cost of weed control is reduced but the potential downside for monarchs is the loss of milkweeds in these fields. One of the outcomes of the Bt corn study was the realization that 90% of the monarchs originate in the agricultural landscape (Taylor and Shields 2000). Further, the studies of habitat use by monarchs showed that although milkweed densities were low in row crops such as corn and soybeans, survival of monarchs in these habitats appeared to be higher than in non-crop areas. Thus, the milkweeds in corn and soybeans are important and their loss due to the adoption of herbicide resistant corn and soybeans could have an impact on the size of the monarch population. Studies of the distribution and abundance of milkweed in GMO and non-GMO crops lands are still needed.

The GMO technologies are here to stay and so are the controversies. The negative consequences associated with these crop varieties are potentially significant and it is unclear whether such effects can be anticipated or controlled.”

To my knowledge, no one has taken up the challenge of assessing the impact of transgenic corn and soybeans on the abundance of milkweeds.

My motivation for revisiting this topic was the following email from a grain farmer in Nebraska.

Sirs:

I am a grain farmer in Northeast Nebraska. I recently, purely by accident, came across your website. I was struck by the information that the common milkweed is the ONLY food of the Monarch larva.

I am concerned that the recent large use of Roundup ready crops (which I use), and the subsequent widespread use of Roundup herbicide (which I also use), had led to the virtual elimination of milkweed in fields and crops. As someone who has raised crops, I can personally attest to scarcity of the milkweed plant today compared to, for example, 20 years ago. Milkweed used to be a common weed in this part of Nebraska. Roundup is particularly effective in eliminating milkweed, since it works on the rootstock of milkweed.

Although I have always considered milkweed a rather troublesome “weed”, and have appreciated how modern herbicides have controlled it, I am concerned about the effect this might have on the monarch butterfly population. I consider the monarch a very beautiful insect, and have noticed that they appear to be scarcer than in years past.

Is there some advice I can get, as a grain farmer with economic considerations, to balance both my needs and that of the monarch? Has anyone ever done any research on this? I appreciate any advice you may have to give me.

Thank you.

David A. Wurdeman
Leigh, Nebraska

I have two reactions to this inquiry. First, growers should carefully examine the short term and long-term pluses and minuses associated with the use of Roundup and second we need to establish what can be done to restore milkweeds under a variety of conditions.

Living in Kansas (and knowing a number of farmers) I know that making a living at farming is difficult and often impossible. Were I a farmer, I would probably be using Roundup Ready corn and soybeans but then again, I might follow the lead of several local farmers who are not using GMO seed lines. As an outsider to this enterprise I can sit back and wonder if the long-term costs of the utilization of this GMO technology and herbicide combination is going to offset the shot term gains that have induced the majority of growers to adopt this system. What are these long-term costs? The most prominent issue is the evolution of herbicide resistant weeds. If you do a web search for herbicide/Roundup resistant weeds you will find a substantial number of references on this topic. In Argentina, an area with a temperate climate, at least 15 weed species have shown resistance to Roundup, including the common bindweed (Convulvulus arvensis) and dandelion (Taraxacum officinale), both abundant in North America

www.organicconsumers.org/ge/argentina100603.cfm (link broken)

An argument offered by Monsanto is that such resistance is local and can be dealt with on a local basis because most weeds don’t spread that fast. While this might be true for some species, it probably doesn’t apply to these two and this interpretation underestimates how weeds are distributed on farm equipment. These are weeds we are talking about and they do get around the world. The similarity of the species composition of the crop field weeds in both the north and south temperate regions of the world is astounding. A further perusal of web sites on this topic reveals that experts suggest not using Roundup more than once a year on a field, a practice that is frequently violated, and that it should not be used in the same field for more than two years in a row. Again, this is a practice that is often ignored. Roundup resistant weeds seem to be in our future and no other “benign” herbicides seem to be on the horizon.

Soil quality is another issue. The long-term impact of the use of Roundup on soil quality is not yet clear. In the short run, the use of Roundup appears to be beneficial by reducing tillage, erosion, and carbon loss through carbon dioxide. However, there are concerns that the long-term effect of Roundup will be to reduce the number of soil microbes needed to either breakdown organic matter or to promote plant growth (mycorrhizal fungi). One also has to ask the question whether, at some level, weeds are beneficial. Although we all learn that weeds reduce crop production, and there are certainly plenty of studies to show this, low level contamination with weeds, if tilled under at some point, provide green manure and maintain texture and contribute to the organic matter in the soils. In the long run, a few weeds may be better for soil conservation than Roundup. Whatever the case, the practices adopted by most growers will be driven by short-term economics or perceived benefits rather than long-term considerations.

Cost of production is another factor to consider. If I were a farmer, I would want to know at least three things about a new seed line, performance (yield), cost of production (field preparation, seed cost, per-harvest inputs such as herbicides, and harvest issues such as lodging) and convenience/time -inputs. The performance data for conventional and transgenic soybeans available on several web sites indicate that yields per acre are similar for both types.

www.agron.iastate.edu/icia/YieldTesting3.html (link broken)

The differences, if there are any, are too small to justify adoption of the herbicide resistant lines. Cost of production may be an issue. These costs seem to vary sharply among locations and I haven’t been able to locate data from independent investigators on this point. Seed cost is higher for GMOs, but is coming down and may be offset by lower inputs. My guess is that much of the adoption of GMOs comes down to convenience and time. Spraying with Roundup requires less time, equipment, and equipment maintenance, and lower fuel costs than tillage, leaving more time for other tasks. This would probably make a difference to me. I’d tell myself I’d have more time for fishing but then I’d spend my Sundays writing these updates 😉

When I took ecology in graduate school 40 years ago, we learned that an average of 5,000 acres of “habitat” was lost to development each day. I was astounded by this figure but it made sense as I began to track the developments taking place in areas I knew well. The rate of loss is probably even greater today. Many species are declining due to a progressive loss of habitat and those species confined to special habitats, that are limited geographically, constitute a high proportion of the threatened and endangered species in this country. Monarchs are unique in that they are one of a relatively small group of insect species that breed in a large portion of the North American continent. Much of this breeding capacity is due to the ability of the common milkweed to invade disturbed areas, such as roadsides, railroad right of ways, power-line and gas-line cuts, pastures, and croplands. This plant is essential for the development of monarch larvae and the distribution and abundance of this single milkweed species, even though monarchs utilize 30 or more species of milkweeds over their entire range, accounts for about 90% of the butterflies that join the fall migration each year. An analysis of the distribution of milkweed containing habitats conducted at the time of the concerns about the impact of Bt corn on monarchs suggested that the majority of monarchs, perhaps 90%, originated from areas with intensive agriculture. This observation, together with formal and informal surveys of milkweeds in conventional corn and soybeans, lead to my concern that the rapid adoption of Roundup Ready corn and soybeans could eliminate much of the milkweed in the most productive breeding habitat for monarchs.

I’ve never been impressed by common milkweed as a competitor in crop situations. Although there are claims that the presence of milkweed depresses crop yields, and this may be true in the Red River Valley in Minnesota and Ontario and a few other situations, the densities of the common milkweed are usually too low (20-60 stems per acre) to be of much significance in this regard. Nevertheless, milkweed at these densities is of great value to monarchs. Larvae reared on milkweeds within fields appear to survive at a higher rate than in the field margins and roadsides perhaps due to the lower abundance of predators in these habitats.

Even if we are unable to persuade growers that it is in their interests to adopt non-Roundup Ready crops, to tolerate milkweed or to utilize management practices that are more milkweed friendly, we still need to find ways for growers to restore milkweeds in their field margins, roadsides, conservation set aside lands and wetlands. Here is a preliminary list of the some of the practices that could be adopted:

1) seed marginal lands, fallow lands, or set aside areas with common milkweed and butterfly weed (A. syriaca and A. tuberosa);

2) seed low areas and true wetlands with both common and swamp milkweeds (A. syriaca and A. incarnata);

3) grow milkweeds in gardens- if not common milkweeds because of a prejudice due to their reputation as weeds, then other milkweed species, such as the swamp milkweed, butterfly weed and tropical milkweed;

4) urge local (county) road crews to cut road margins once a year, either in late June or preferably toward the end of the season after the milkweed plants have seeded;

Milkweeds can be established by scattering seeds over areas that have been mowed and lightly disked or tilled as early in the spring as possible. To minimize competition with other species that will invade the seeded area, the sown area should be mowed close to the ground the next spring before growth starts. This practice will favor grasses and milkweeds and will minimize competition for light and nutrients.

Filed under General | Comments Off on The monarch decline: when did it begin?