Monarch Puzzle Wrap Up
Friday, April 22nd, 2022 at 1:53 pm by Chip TaylorFiled under General | Comments Off on Monarch Puzzle Wrap Up
I want to thank all of you who participated in the puzzle. I challenged you to come up with the same possible explanation I did for why first-generation monarchs appear to stop directional flight on specific dates in June at different latitudes (cities). I had been thinking about the question for decades and it took me a long time to come up with the answer. I did so the hard way by looking at how a lot of variables changed with the change in the seasons. The answer ultimately was so simple that I couldn’t believe that I hadn’t thought of it. Many of you had difficulties as well. It comes down to conceptualizing what happens to day length in both the spring and early summer and later in the season from late summer through fall. I didn’t ask you to think about the symmetry of the seasonal changes, but it probably would have helped.
So, what does happen to day length through the seasons? We all know that day length increases in the spring, but it is easy to forget that it increases at a decreasing rate. The same, but different, change occurs after the summer solstice (21 June). In this case, the day length decreases, but again, at a decreasing rate.
As you may recall from how the puzzle was framed, I started with a single observation, namely that first generation monarchs “appeared” to stop directional flight in our area sometime after the 5th of June. Then I asked what was the difference between all the variables from one day to the next and then the next. Again, since I knew that the migration stopped sometime in early June at all latitudes, I asked if the rate of change seen from the 5th to the 6th of June followed a similar pattern with increasing latitudes. I chose Ames, St Paul and Winnipeg to see if the pattern matched. I chose the probable day before the migration stopped at each city based on the distance from Lawrence. Then I used suncalc.org to calculate the increase in day length from one day to the next. Eureka! There is a three-day match for the four sites with the rate of increase being similar from one day to the next. When I worked back through earlier dates, I realized that the results represented a point in time for each location at which the rate of change dropped below one minute per day. Specifically, I noted that the difference between the hypothetical last day of flight and the proposed stop day ranged from 50-55 seconds. That was my “Eureka” moment. What those data suggested to me was that the rate of change had become so small from one day to the next that the change could no longer be detected by the monarchs and they stopped directional flight. In other words, it was a loss of signal issue such that without a detectable rate of change per day the monarchs simply stopped migratory flight. That ultimately might not be the correct explanation, but it constitutes a working hypothesis to be tested. I will get into next steps below, but one of the things that happened by raising the issue of stopping directional flight was learning from Carol Clark that monarchs appeared to stop directional flight in the Dallas area in the first days of June. That led me to run the numbers for Dallas starting with 31 May. Bingo! Another match. That’s confirmation of the pattern – a good first step in testing the hypothesis.
There were 22 submissions to the puzzle contest. I had intended to award the Mariposas board game to the first three participants with the correct answer or sometime close to it. It turned out that the puzzle was harder than I suspected and we had to go through three rounds in which I tried to leave word crumbs that participants could follow with each iteration. I finally had to admit that it’s difficult to conceptualize an increasing function that is progressively decreasing even though those are the seasonal conditions we live with twice a year and that many of us learned as children. So, for those who kept trying, and especially for those who seemed to be on the right track, I coached them by adding a few more word crumbs they could follow. Ultimately, I ended up awarding the Mariposas board game to 5 participants. One of the interesting things for me was the number of times when dealing with the answers I had to go back to suncalc.org to make some more calculations. The puzzle was a learning process for me as well as for many of the participants. From my standpoint, that’s a good outcome.
There are three puzzle submissions I have to tell you about, one by Chris Mentrek who created a graphic solution, one by Cammie Machholz who concentrated on sunrise and sunset data and one by Jill Larson who discovered a website that does all the work for you.
To quote from Jill’s email – “I found a better website to use, and you don’t need to calculate! Of course, discovered after I used paper and pen. Try out timeanddate.com. There is a drop down for Sun & Moon, and you enter the location. Then you can see whole months at a time with the difference in duration of daylight listed in the chart. Pretty neat.” This discovery demonstrates that I do things the hard way and asked you to do the same. Sorry about that. No wonder this was difficult. I should mention that the readout for each day at this site shows the time of sunrise and sunset as well as the sun angle at solar noon (SASN).
To show the change from the hypothetical last day of directional flight to the next two days for each location, I have combined screen shots for Lawrence, Ames, St Paul and Winnipeg from the time and date site. There are 1 second differences between the data from this site and suncalc.org.
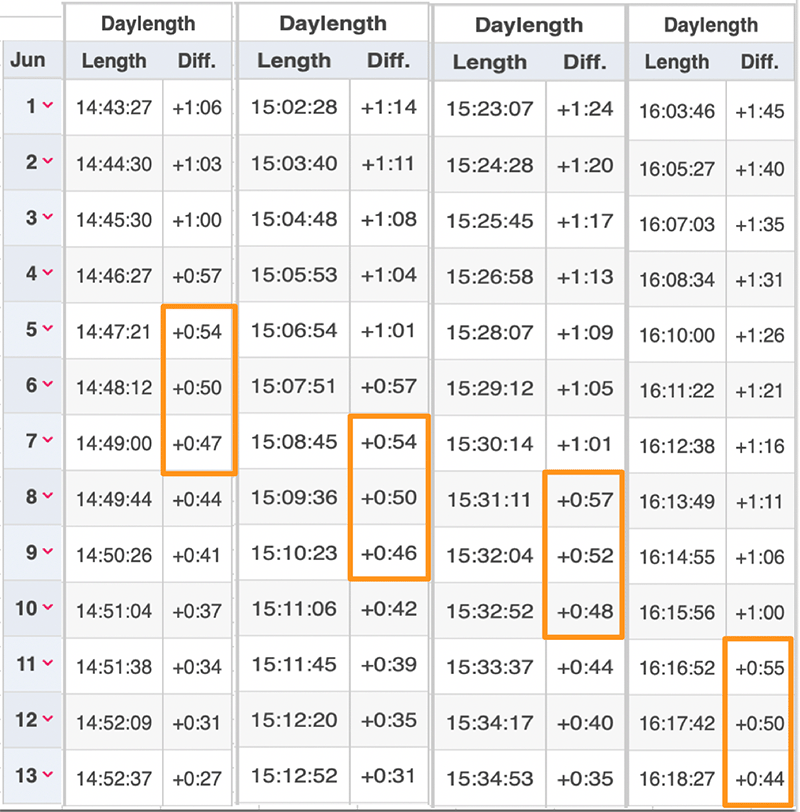
(For those of you who are curious about how daylength changes through the entire year, enter your location and then track the rates of increase and decrease from December to December. When starting on the 21st of Dec you will notice a slow increase in daylength which will increase and then the positive rate of change will slow as the 20 March equinox is approached. After the 20th of March, daylength keeps increasing but the rate of increase declines to 0 on the 21st of June).
Cammie Machholz focused on the change in the rate of increase in sunset and sunrise. She concluded that the similarities of the differences in sunrise and sunset across the latitudes could be why monarchs stopped directional flight. Indeed, these are components of the 50-55 second increase and show the same pattern as the total increase.
Sunrise
Dallas – May 31 to June 1 – 17 seconds earlier
Lawrence – June 5 to June 6 – 15 seconds earlier
Ames – June 7 to June 8 – 15 seconds earlier
St. Paul – June 8 to June 9 – 16 seconds earlier
Winnipeg – June 11 to June 12 – 14 seconds earlier
Sunset
Dallas – May 31 to June 1 – 35 seconds later
Lawrence – June 5 to June 6 – 36 seconds later
Ames – June 7 to June 8 – 37 seconds later
St. Paul – June 8 to June 9 – 37 seconds later
Winnipeg – June 11 to June 12 – 36 seconds later
Cammie’s data suggests another hypothesis namely that the cue could involve a change perceived or not perceived on the horizon, possibly at the end of the day. There are other possible hypotheses, but we have a good place to start.
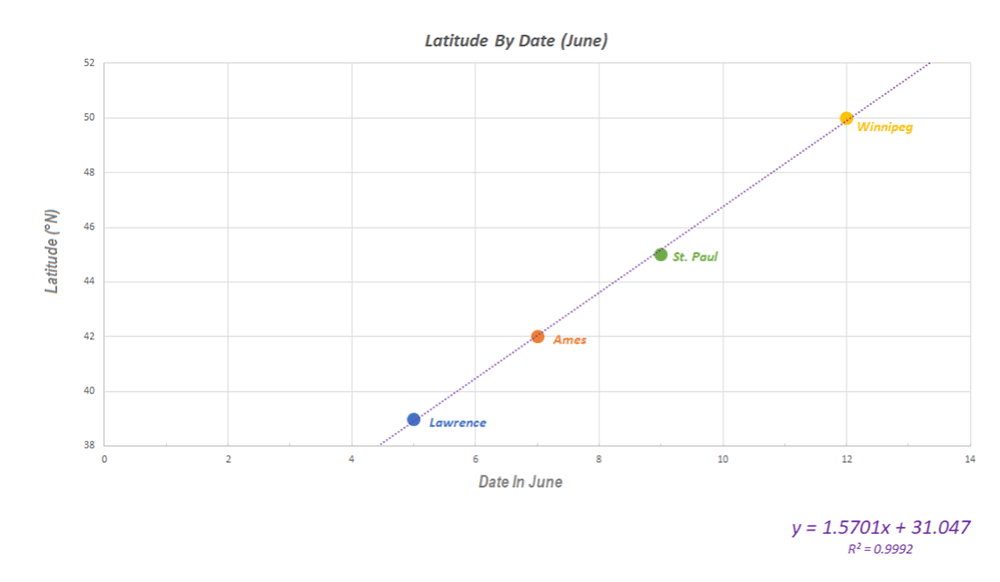
Below are Chris Mentrek’s graphical solutions. His graphs nicely show the convergence of dates and locations and easily beat my summary. Chris’s answer was more than I expected from any participant. Other winners simply showed the similarities among sites in the rate of change from one day to the next.
The migration-halt dates for the four cities in question DO follow a nicely-predictable pattern:
Here’s something that’s similar for these cities on the dates in question: the amount of change in daylight.
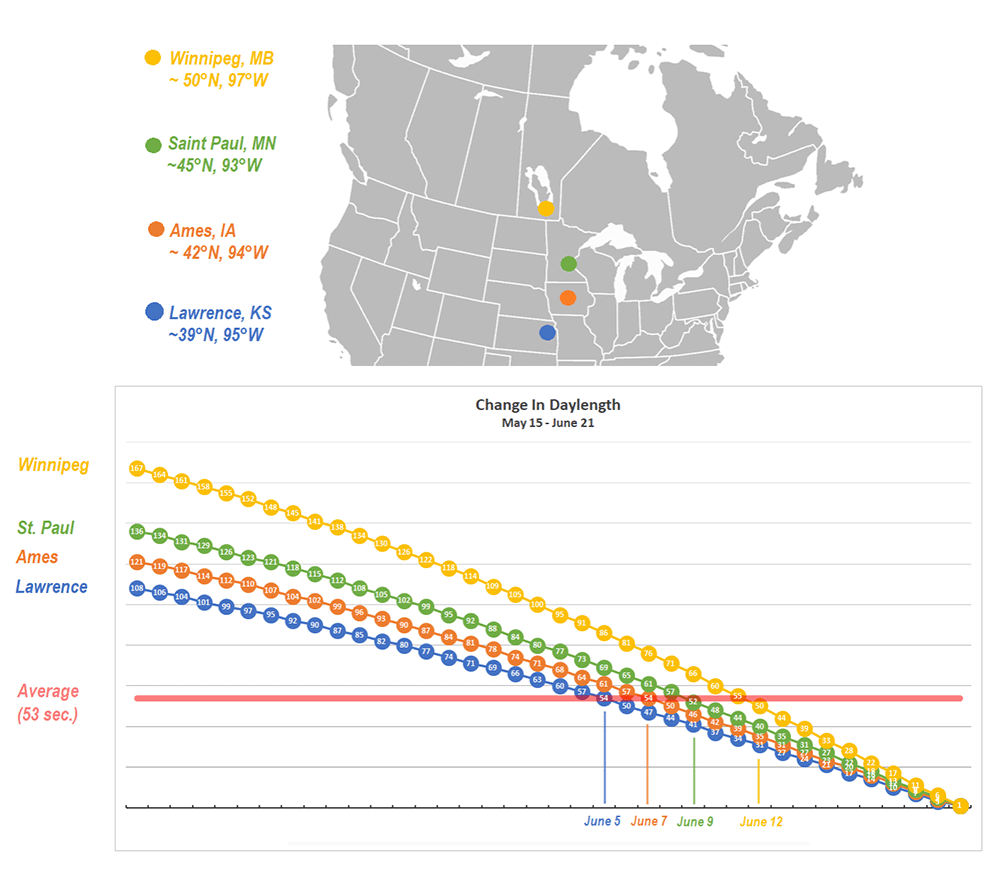
However, unless the butterflies are carrying this chart in their heads (along with an ability to sense latitude and the date), there’s probably a more-indirect clue in their environment that conditions are right to stop migrating north.
Every day in the spring, a site’s minutes-of-daylight will increase until the summer solstice — June 21st. In May and June, each day gets longer by slightly-less time than the day before. This change in the daylight length varies a lot with both date and latitude. (For example, Winnipeg sees a drop from 167 seconds-per-day to 0 from May 15th to June 21st.)
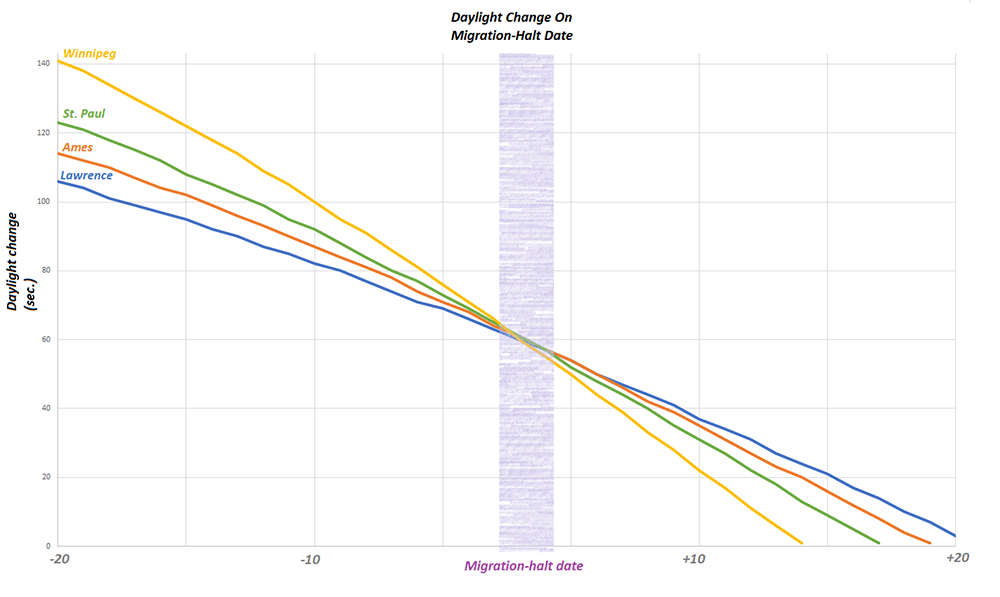
It’s not a perfect prediction, but the migration-stop dates all seem to occur when a site’s change in daylight reaches about 53 seconds. (For example, Winnipeg’s daylength drops from 55 to 50 seconds on the migration-stop date, while Lawrence’s daylength drops from 54 to 50 seconds.)
To sense this, the butterflies only need to be able to sense how much daylight they’re experiencing, and how it changes day by day. It might be a handy way to infer their latitude!
Directional Flight
As a follow-up to the puzzle challenge, the next steps involve teaching citizen scientists how to distinguish directional flight from meandering behavior. It’s distinctive, and once learned by volunteers, we can ask “flight spotters” to record whether they are seeing directional flight through May and June. We now have a hypothesis to test based on dates and latitudes. So, for any one site all an observer would have to do is record whether directional flight was observed (weather permitting) over the short period involved. I have already lined up one team in Michigan who will be making these observations. They will also be recording data from the nearest “Tempest” weather station in an effort to closely associate their observations with the behavior of the monarchs. Having a good location where the passing monarchs can be highlighted against the sky will be key. A compass will be needed as well.
I should mention that the shut down of directional flight might not be as abrupt as suggested in the puzzle. Rather, there might be a decline in directional flight over several days rather than an abrupt cutoff. Since we would be looking for a behavior that is declining with fewer individuals showing directional flight each day, it may be difficult to identify the exact date when directional flight ceases at each location.
Oh, almost forgot. There is one more thing that makes me believe that this line of research is worth pursuing – the converse.
What is the rate of change from one day to the next when the monarchs first arrive at the overwintering sites in Mexico at the end of October? Again, the rate of change drops below 1 minute – ranging from -58 to -56 seconds from 29 Oct to 2 Nov at Angangueo. In this case, in contrast to stopping directional flight, the migration toward the overwintering sites continues southward through Mexico until sometime in early December when the change per day is about -20 seconds. That gives us another mystery, doesn’t it? Why would monarchs experiencing increasing daylength that is increasing at a decreasing rate stop directional flight while monarchs that are experiencing decreasing daylength that is decreasing at a decreasing rate keep flying? Every aspect of monarch biology seems to be complicated, doesn’t it?


Sorry, comments for this entry are closed at this time.