Monarch Population Status
Wednesday, May 29th, 2013 at 9:05 am by Chip TaylorFiled under Monarch Population Status | 1 Comment »
Will this be a lean year for monarchs followed by another low overwintering population?
A slow start, a small population and some predictions
Monarchs are off to a slow start this year, with the number moving north in May at an all time low (as indicated by first sightings reported to Journey North). In the following paragraphs I’ll explain why this will be a lean year for monarchs and why the overwintering population in Mexico could be even lower this coming winter than it was in 2012-2013. Predicting whether monarch populations will increase or decrease would seem to be risky or even foolish but, as you will see, there are patterns that support these predictions based on: 1) overwintering numbers; 2) first sightings in the spring (1997-2013); and 3) the impact of temperature on the development of the first generation immature stages and the ability of adult monarchs to move northward to recolonize the breeding areas in the northern states and Canada.
As most of you know, the overwintering monarch population for 2012-2013 was the smallest recorded to date (see our Monarch Population Status article from March 14th). This number defines the upper limit for the number of monarchs returning north in the spring. There are at least two factors that diminish this number – overwintering mortality and mortality as the monarchs migrate through northern Mexico to Texas. Unfortunately, there is no consistent quantitative data on either of these factors. Further, no assessments have been made of the lipid reserves of the monarchs returning to Texas. These reserves are likely to vary from year to year and they probably determine the longevity and reproductive success of the returning females. In spite of the lack of data on these points, the data on overwintering numbers, first sightings and temperature are robust enough to define some patterns and make predictions.
First sightings
The first sightings reported to Journey North have been particularly useful in helping us understand the dynamics of the spring migration. Although first sightings data have a number of limitations, they reveal when and where returning monarchs are seen as they move into the United States and Canada. These sightings also reveal when first generation monarchs moving north and northeast from southern states reach the northern breeding grounds. Even though these data can’t be used quantitatively, they do provide a relative measure of the number of monarchs on the move each spring. Relative to other years (1997-2012) the number of first sightings reported in March and April in Texas this spring was the lowest recorded since 2005 (Table 3). Since more people have been reporting first sightings each year, the low numbers seen this year may be more significant than is suggested by the numbers. Are the low numbers of sightings this spring simply due to the modest number of returning monarchs or is the cooler than normal weather in the mid portion of the country also a factor?
Size of the overwintering population
Although the size of the overwintering monarch population in Mexico is determined by a number of factors, two major drivers of the population (certainly the easiest to document) are habitat area and weather. As you may remember from reading our Blog articles, monarch/milkweed habitat has declined significantly in parallel with the rapid adoption of glyphosate-tolerant corn and soybeans and, since 2006, the rapid expansion of corn and soy acreage to accommodate the production of biofuels (Brower et al, 2011a,b, Pleasants and Oberhauser, 2012 and Taylor, 2012). Monarchs have declined coincident with these habitat losses and the losses are continuing. Monarch numbers will continue to decline unless the collective efforts of citizens, communities, and governments are large enough to offset the annual loss of habitat. While the amount of habitat defines the resource base that monarchs require, weather often determines the extent to which these resources are used in a given year and hence the size of the fall and winter populations.
The impact of weather on the monarch population can be direct and obvious or quite subtle and complicated; especially since the weather conditions in one part of the northern breeding area can differ significantly from those in another. The breeding season for the monarch population extends from March through October (depending on latitude). If we break this season down into three periods, spring (March, April, May), summer (June, July, August), and early fall (September, October) and systematically look at year to year temperature variation for each of these periods, it is apparent that spring conditions are the most variable and most likely to affect the population. And, they do.
Effects of temperature on immature stages and adult monarchs
Before we dive into interpretations of the data, it might be useful to describe the general response of returning monarchs to spring temperatures. Flight and oviposition are both temperature limited. The lower and upper limits for both activities are not well defined but it is safe to say that there is little of either in the spring below 60F or above 90F. Monarchs leave the overwintering sites in Mexico in late February and early March when the late morning temperatures reach the high 60s to low 70s. The conditions are generally clear to mostly sunny at the start of these flights. Presumably, similar conditions have to occur for returning monarchs to move northward into Texas and for first generation monarchs to move into the northern breeding areas. Oviposition can be observed under sunny conditions when the temperatures reach the high 60s. Higher temperatures and reduced wind speeds at ground level appear to facilitate egg-laying. Both flight and egg-laying increase as temperatures increase from these minimal levels through the mid 80s and then begin to decline. At issue is the overall impact of temperature on monarch dispersal, realized fecundity, and longevity.
It is well known that the maturation rates of monarch eggs, larvae, and pupae are temperature dependent. At the highest temperatures, eggs can hatch in 3.5 days; however, at low temperatures egg development can be extended. On the 10th of April 2011, Jackie Goetz observed a newly arrived monarch lay and abundance of eggs on emerging milkweeds in her garden in Overland Park, Kansas. The weather became much colder after the 14th (with an extended cold period from 18-28 April) and those eggs did not hatch until after they were brought indoors on the 29th of April – some 19 days after oviposition. Similar comments could be made about the development of larvae and pupae. Less well-known are the effect of temperatures on adult longevity, egg-laying rates, and dispersal, specifically movement to the north and northeast in the spring.
In the laboratory we extend the longevity and reproductive output of monarchs in our culture by limiting the number of “daylight” hours while keeping the temperatures below 80F. Longer days and higher temperatures can produce large quantities of eggs over a short period but the monarchs die sooner. This outcome is expected. At higher temperatures, metabolic rates are higher and require greater inputs in terms of water and carbohydrates (nectar) and a more rapid conversion of fat body to sugars (trehalose, etc.).
Thus, the response of both the immature stages and adults to lower temperatures is the same. Life is extended in both cases but there is a difference. Extending the duration of development for immatures increases their exposure to predators, parasites, and other incidental causes of death such as heavy rains. However, extending the adult stage probably results in higher reproductive output (realized fecundity) in most cases. So, what should a returning female monarch do? Should it move northward as the temperatures allow, laying eggs along the way or, assuming it has a choice, should it lay most of its eggs in areas where the immature stages will develop most rapidly? As we will see, these data indicate that temperatures above 70F allow the returning monarchs to expand their distribution while periods with temperatures below 70F reduce movement. There are consequences of both moving northward too rapidly and too slowly. The warmer conditions expose the monarchs that have expanded the distribution furthest to the north to late spring storms and cold weather – conditions that reduce egg-laying. Further, the eggs and larvae that are produced by the monarchs on the leading northward edge can be exposed to low, sometimes freezing, temperatures resulting in delayed development and higher mortality rates. On the other hand, cool conditions can result in a delay in the arrival of first generation monarchs in the northern breeding grounds. Both extremes are associated with lower numbers of monarchs during the migration and reductions in the total hectares occupied at the overwintering sites.
Impact of spring temperatures in the South Region
The temperature in the South Region (Texas, Oklahoma, Kansas, Arkansas, Louisiana, Mississippi) in March has a big impact on the number of overwintering monarchs the following winter. The March temperatures for the South Region from 1994-2013 are given in Figure 1. Appended to the mean temperature for each year is a numerical figure indicating the net change in the size of the overwintering population from that of the previous year. Red indicates the population has declined and black indicates an increase in the population from one year to the next. Note that the declines (red numbers) are associated with higher than normal temperatures (7 out of 9 records) for this month while the increases (black numbers) are associated with cooler than normal temperatures or those close to the long-term mean (7 out of 8 records). There would seem to be some predictive value in this simple analysis. Indeed, when I first drew up this figure for the Monarch Biology and Conservation Meeting in Minnesota last June, I put a question mark for the change that might be expected from 2011 to 2012. The high mean temperature for March suggested that the population would decline and indeed it did from 2.89 to 1.19 hectares or a decline of 1.7 hectares. Although a single factor can go a long way in helping us understand what is happening, we can’t ignore the possibility that other factors are involved. If it is really as simple as this summary suggests, we would project that the monarch population will increase from 2012 to 2013 on the basis of the below normal temperatures for March in the South Region in 2013. Unfortunately, this won’t be the case. To understand why I’m making this assertion, I’m going to tell you why this year is both similar to and different from the springs of 1996 and 1997 (there are similarities to other years as well).
The March temperatures for 1996 were the coldest for the period (1994-2013) and the population increased from 12.61 to 20.97 hectares (+8.4 hectares) which is the largest increase yet recorded.* In 1997 the March temperatures were above normal and the population crashed, the worst decline in the record, from a high of 20.97 hectares in 1996 to 5.77 hectares in 1997 (-15.2 hectares). However, neither the increase in the population in 1996 nor the decrease in 1997 was entirely due to March temperatures; April temperatures for each year were strikingly different. While the April temperatures for 1996 were about a degree (F) below normal, those for 1997 were 4.9F below normal (the lowest in this record and the second coldest April from 1895 to present). Further, a blast of cold air with freezing temperatures (some as low as 25F) that extended into Oklahoma and north central Texas during 11-14 April is certain to have delayed development and killed some of the developing larvae and early-arrived adult monarchs in this region. Thus, cold and even freezing temperatures in the South Region in April 1997 likely contributed as much or more to the decline as did the high March temperatures of that year.**
May temperatures also differed substantially between these two years. In 1996 May temperatures were about 4.5 degrees F above normal while those for 1997 were about 3.5 degrees F below normal (also the lowest in this 20 year record). The 1996 conditions would favor rapid movement of the first generation monarchs (which typically begin moving north in the last week of April, with most moving north in May) out of Texas into all of the northern breeding areas (unfortunately, recording first sightings data by Journey North did not start until 1997). However, the colder April and May temperatures in 1997 would be expected to delay the arrival in the north of those that survived the late spring freeze. In fact, the mean arrival date in the north in 1997 was later than for all other years (Figure 14.6, Howard and Davis 2004).
Summer temperatures in the northern breeding areas can also contribute to the size of the overwintering population but the difference between the conditions in June, July, and August did not differ substantially for these two years. The differences in the outcomes were largely due to the conditions from March through May of each year.
Which brings us to why the spring of 2013 is both similar to and different from 1996 and 1997. As you can see from the summary in Table 1, 1996 and 2013 are similar in that both March and April means were colder than usual. These conditions would be expected to slow down development of larvae and reduce the dispersal northward of returning migrants. The May temperatures in 1996 were much higher than those of this year – which will be close to normal. Again, the high temperatures in May of 1996 would facilitate northward movement of first generation monarchs while the more normal May temperatures this year would be expected to neither slow nor accelerate movement northward.
Table 1. Summary of monthly mean temperatures for the South Region.
Deviations from the mean are shown in brackets.
| March | April | May | |
| 1996 | 49.2 (-4.4) | 61.2 (-1.0) | 74.7 (+4.5) |
| 1997 | 56.8 (+3.2) | 57.3 (-4.9) | 68.2 (-2.2) |
| 2013 | 51.6 (-2.0) | 59.5 (-2.7) | *** |
***(cold early but near average for the month)
Degree days
We can also use monarch degree days to compare these years. You can find an explanation of degree days in a 2005 article, Monarchs, Cold Summers, Jet Streams, Volcanoes, and More. Monarchs have both low and high temperatures at which development stops. These points are referred to as “developmental zero” with the low point being 52.7F (11.5C) and the high 91.4F (33C) (Zalucki, 1982). The simplest explanation for degree days is as follows: if the mean temperature for a 24-hour period is 1 degree above the developmental zero value, the total degree days for that day is one. If the mean is 20 degrees above developmental zero for a 24 hour period, the total would be 20 degree days and so on. The total number of degree days required from egg to adult is close to 640 Fahrenheit degree days. We have used this estimate to calculate the number of days required to complete development from egg to adult for each of the locations mentioned in Table 2. To compare locations and years we calculated development for eggs laid on the dates indicated. The spread of the dates and locations approximates the estimated dates of arrival of numerous monarchs at particular latitudes (represented by the cities). The developmental times are probably an overestimate since 4th and 5th instar larvae have the capability of increasing their body temperature and reducing overall developmental time by basking in sunlight. Nevertheless, it is the comparison of the years that is important and these figures show that the development times for 2013 bear similarities to both 1996 and 1997 depending on starting date and location (latitude).
Table 2. Approximate number of degree days required from oviposition to emergence for eggs deposited on the March and April dates indicated for each city.
| City | Latitude | Eggs Laid | 1996 | 1997 | 2003 | 2013 |
| Corpus Christi, TX | 27N | 10 Mar | 46 | 40 | 41 | 36 |
| Austin, TX | 30N | 20 Mar | 43 | 50 | 42 | 42 |
| Dallas, TX | 33N | 28 Mar | 41 | 49 | 39 | 44 |
| Ardmore, OK | 34N | 1 Apr | 42 | 50 | 39 | 53 |
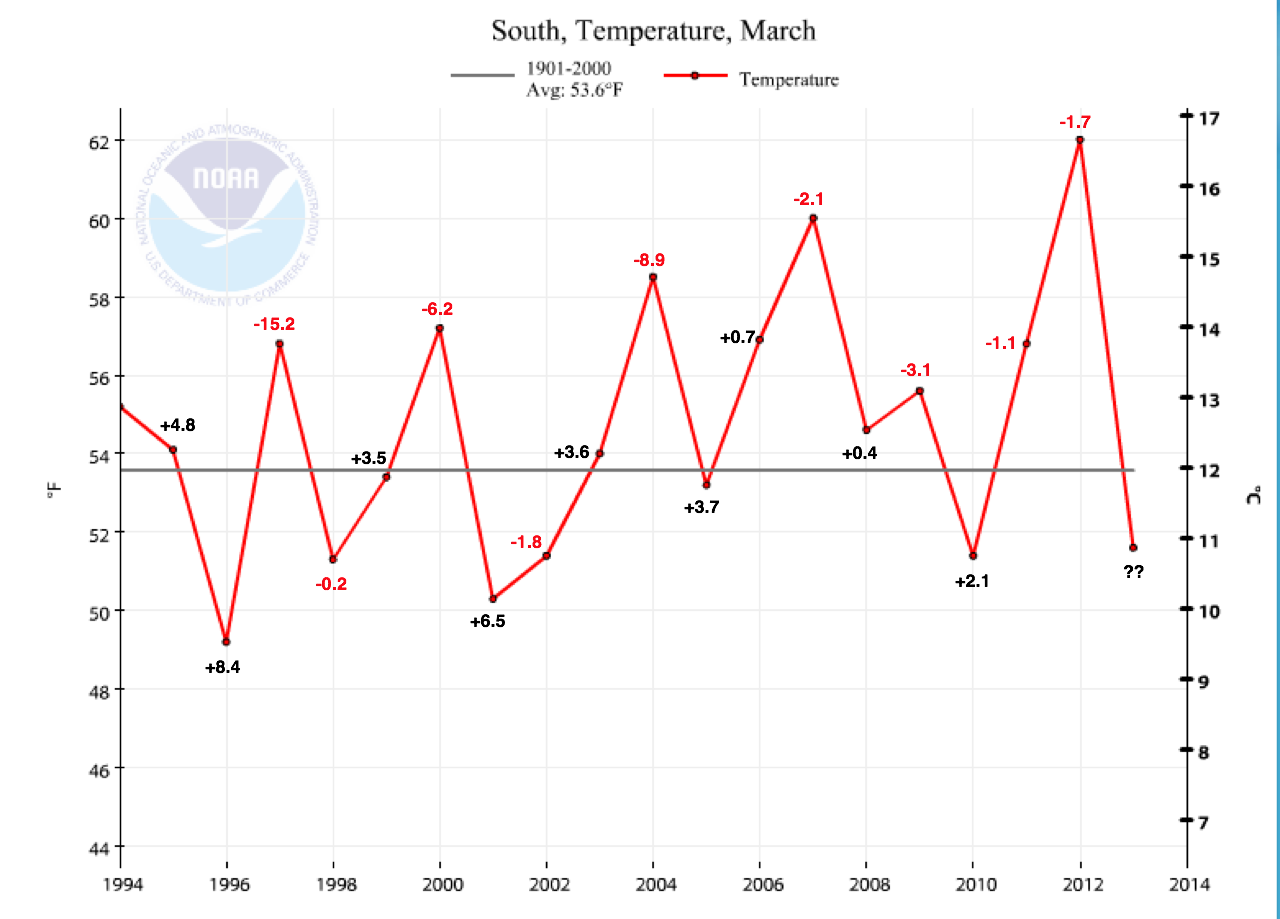
Figure 1. March temperatures for the South Region from 1994-2013. Appended to the mean temperature for each year is a numerical figure indicating the net change in the size of the overwintering population from that of the previous year. Red indicates the population has declined and black indicates an increase in the population from one year to the next. Note that the declines (red numbers) are associated with higher than normal temperatures (7 out of 9 records) for this month while the increases (black numbers) are associated with cooler than normal temperatures or those close to the long-term mean (7 out of 8 records). Summer temperatures account for some of the year-to-year changes. Warmer than normal (but not extremely hot (2012)) summers appear to contribute to an increase in the overwintering numbers (e.g., 1995, 1999, 2001, 2003, 2005, 2006, 2007, 2010) (Taylor, 2012 and Barve et al., 2012). It should be noted that this approach only allows us to predict the direction of change and not the amount of the change from one year to the next.
An examination of first sightings
A comparison of the first sightings for 2013 with those summarized in Table 3 would seem to suggest some similarities between 2004 and 2005. A glance at Figure 1 shows that the population declined from 2003 to 2004 by 8.9 hectares (the second steepest decline) while the population for 2005 showed an increase of 3.7 hectares. These observations give rise to a number of questions such as: 1) do the first sightings have any predictive value; 2) aside from warm temperatures in March, were there other factors that contributed to the 2003-2004 decline; and 3) why did the population increase from 2004 to 2005? The answer to the first question is yes, the first sightings do have predictive value but it is the “when and where” of the first sightings that is important rather than the numbers per se. This point should be clearer as we progress through the analysis. The low numbers of first sighting in the spring of 2004 are likely the result of the massive mortality that occurred at the overwintering sites that followed two severe periods of rain and freezing weather in January and February of 2004. The mortality from these storms was not well documented but there are many indications (from the number of recovered tags for example) that the mortality due to these storms was equal to, if not worse, than that of the storm that started on 12 January 2002 during which at least 70% of the monarchs died (Brower, et al 2004). The number of surviving monarchs in 2004 still should have been sufficient to recolonize Texas and produce a large first generation capable of recolonizing the northern breeding areas but that did not happen. The explanation lies in several factors:
1) March temperatures were the third highest of the period (+4.9F) and these were followed by a near-normal April (-0.2F) and a May with above normal temperatures (+1.7F). The March temperatures may have been the most detrimental, and would have been particularly stressful if monarchs that survived the winter storms were in poor condition.
2) The low numbers of returning monarchs, combined with the spring conditions and perhaps other factors, resulted in late arrival of first generation monarchs in the northern breeding areas. Late arrivals (after 1 June) in the summer breeding range are generally associated with population declines from one year to the next. But, there was yet another factor that kept this population from rebounding.
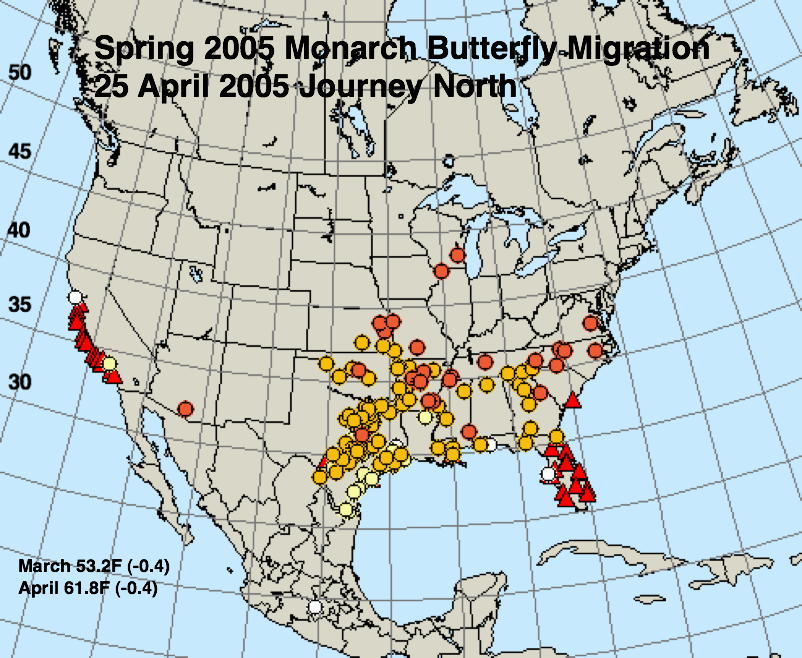
3) The summer of 2004 in the northern breeding areas (East North Central = upper Midwest) was the third coldest since 1895. Cold summers (1992, 2004, 2009) have all been associated with population declines. The conditions in 2005 were almost the opposite – near normal temperatures for March (-0.4F), April (-0.4F), and May (-0.9F) but warmer than normal summer temperatures. The first generation monarchs also arrived late in the northern breeding areas in 2005, although a bit earlier than those in 2004.
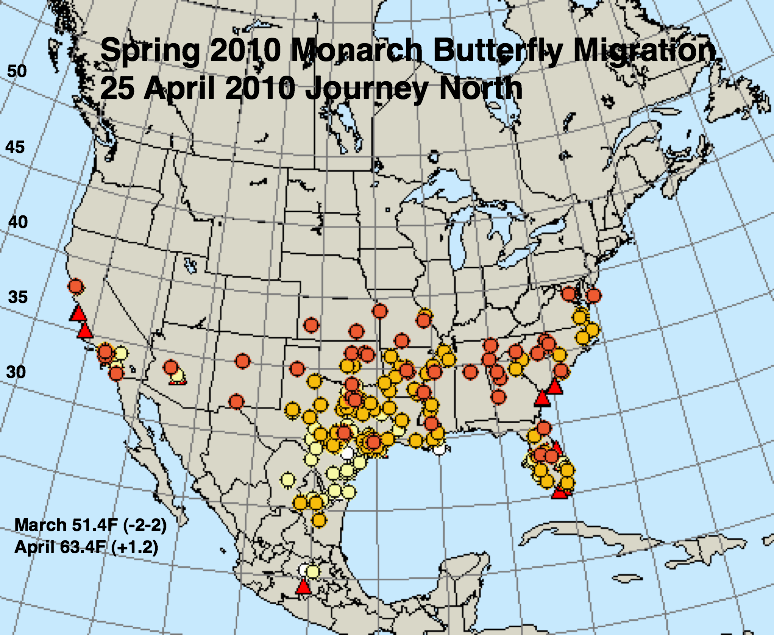
So, what does this tell us about what to expect in the fall and winter of 2013? Let’s deal with the number of observations first. Although, the number of first sightings reported in 2013 is similar to those of 2004 and 2005, the number of people reporting first sightings has increased significantly since reporting of first sighting began in 1997 (Howard and Davis 2004). In other words, fewer monarchs have been seen this year by a larger group of observers – suggesting that the number of returning monarchs was lower in 2013 than in 2004 and 2005 (both low returning populations) or even 2010, which saw the lowest overwintering population (1.92 hectares) prior to that of this past winter.
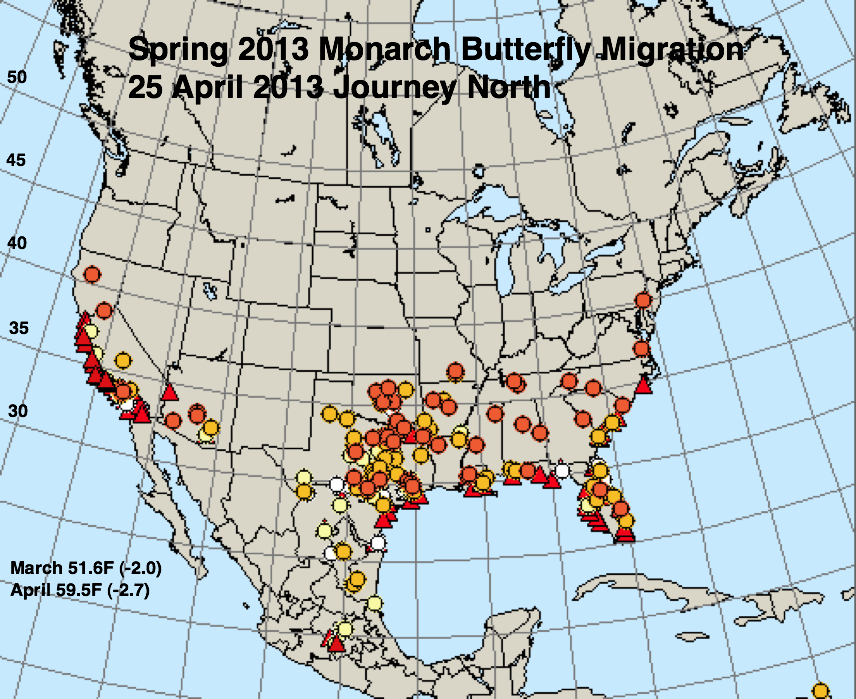
There is a similarity between 2013 and 2004 – the monarchs will arrive late in the northern breeding areas. The mean temperatures for March (-2.0F) and April (-2.7F) were the lowest for these months since 1996 and the April temperatures in particular slowed development of immature stages. May temperatures – which in most of the South Region are near or just below normal – have not appreciably aided northward movement of first generation monarchs. The result of all of these factors is that the arriving number of first generation monarchs will be low and they will arrive late. Even if this projection is true, is there a chance that the population can rebound as it did in 2005? Yes, but the temperatures in nearly all of the northern breeding range will have to be above normal by 2-3F throughout the summer for the population to increase. If the temperatures are normal (and normal summer temperatures are projected by NOAA for the upper Midwest (see the National Weeather Service’s Climate Prediction Center), the overwintering population is likely to be in the range of 1 hectare again this coming winter and could be much lower.
Table 3. First sighting data reported to Journey North (exclusive of areas west of the Rockies and Florida) from 1997-2013. The first sightings reported in March and April represent monarchs returning from Mexico while the majority of sightings reported 1-20 May represent first generation monarchs. Monarchs reported from 21 May through 9 June represent first generation monarchs. First sightings recorded after 9 June are not recorded here for several reasons, these monarchs were probably present in the northern part of the range on 9 June, their numbers are low, and such late arrivers are not likely to contribute substantially to the population relative to those arriving earlier.
| Year | March | April | May 1-20 | May 21-Jun 9 |
| 2013 | 78 | 82 | 42 | 211 |
| 2012 | 236 | 137 | 396 | 69 |
| 2011 | 148 | 319 | 125 | 273 |
| 2010 | 127 | 125 | 157 | 296 |
| 2009 | 138 | 209 | 96 | 176 |
| 2008 | 124 | 169 | 78 | 227 |
| 2007 | 141 | 109 | 118 | 228 |
| 2006 | 150 | 192 | 44 | 275 |
| 2005 | 74 | 95 | 36 | 151 |
| 2004 | 68 | 63 | 60 | 103 |
| 2003 | 113 | 86 | 67 | 75 |
| 2002 | 197 | 72 | 59 | 164 |
| 2001 | 76 | 99 | 199 | 105 |
| 2000 | 82 | 109 | 112 | 79 |
| 1999 | 54 | 86 | 75 | 111 |
| 1998 | 41 | 63 | 106 | 66 |
| 1997 | 68 | 109 | 49 | 35 |
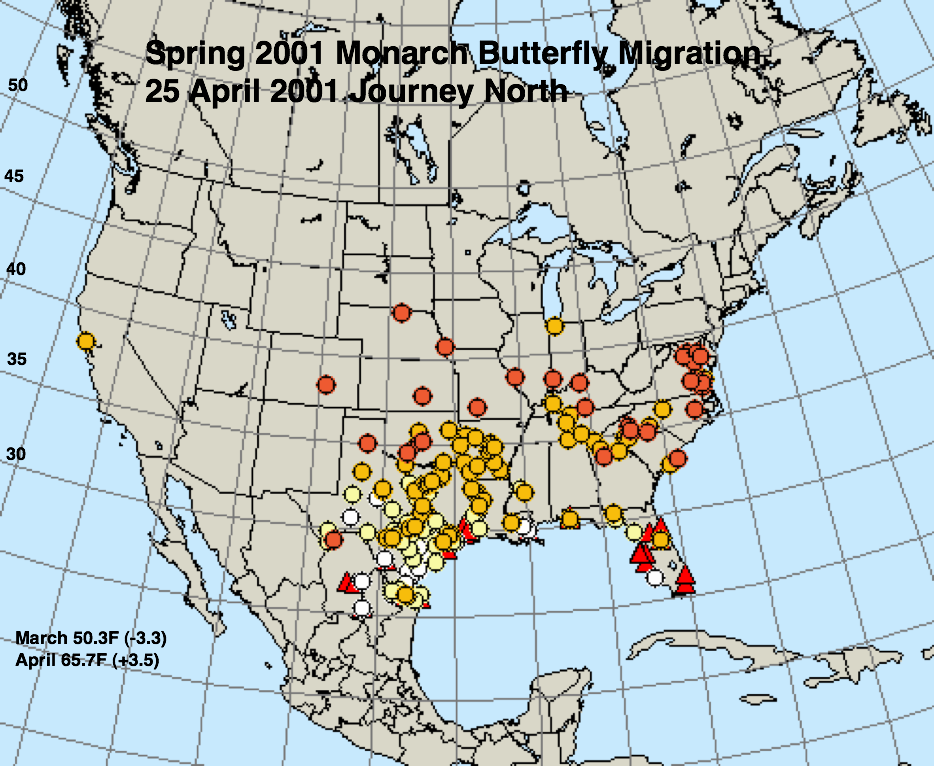
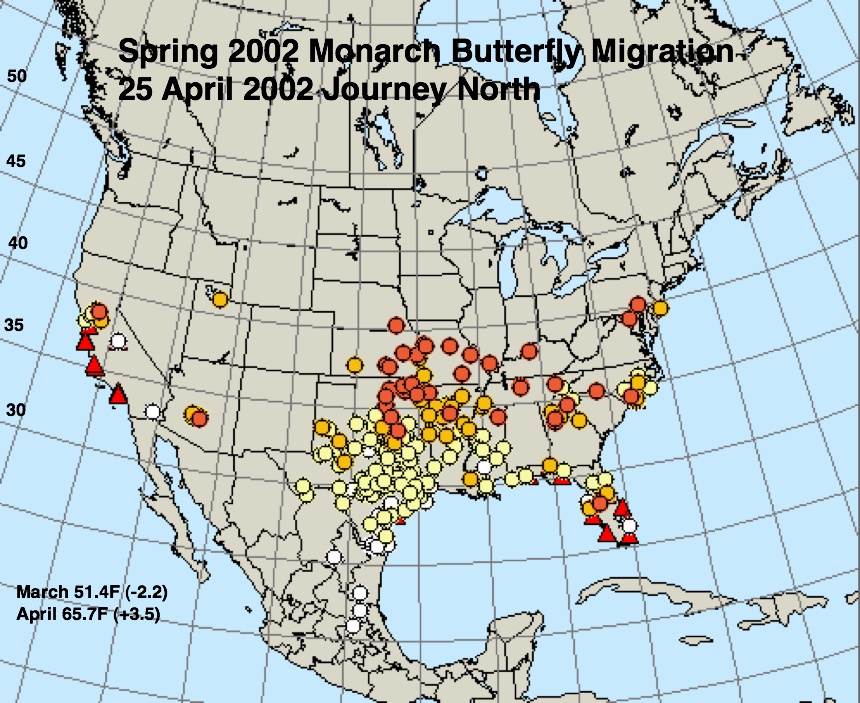
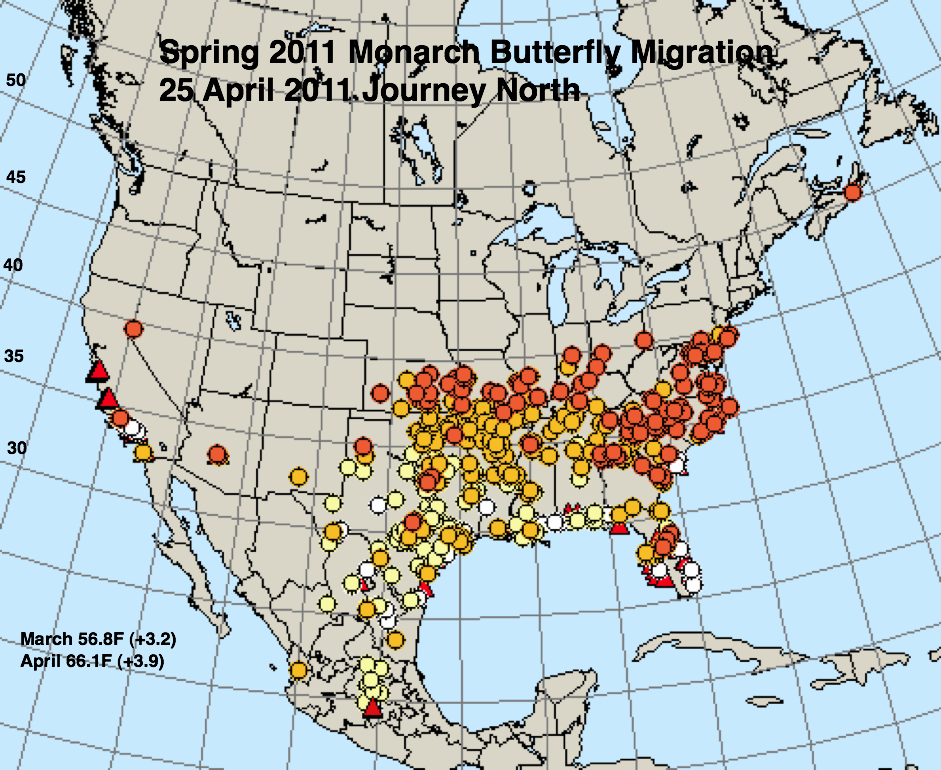
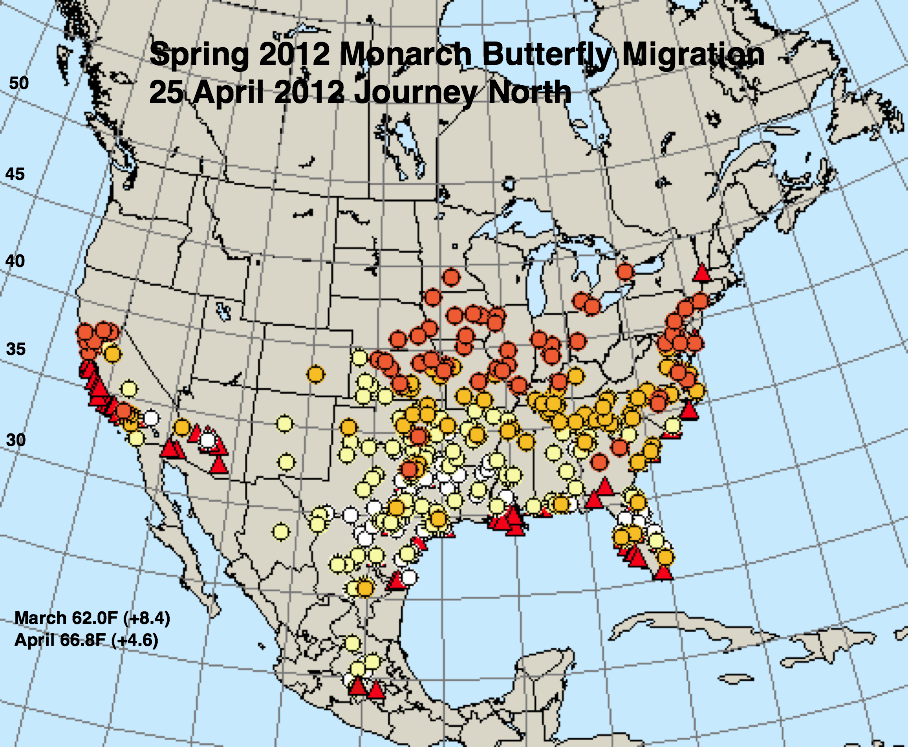
The figures below represent first sightings distribution maps for 25 April as recorded by Journey North for the years indicated. The 25 April date was chosen since sightings up to this date are likely to include only monarchs returning from Mexico. The maps were selected to represent a range of March and April conditions from the coldest (2013) to the warmest (2012) spring. The mean temperatures for each month and the deviations from normal are given in the lower right corner of each map.
* A moderate drought extended through most of Texas in March and April of 1996.
**The first sightings data appears to show that monarchs move “around” the jet stream to the northeast when it dips into the central part of the continent in the spring. This movement may account for the number of monarchs recorded per hour during the fall migration at Cape May, NJ in 1997. In contrast to the Midwest, where the migration was relatively low, the monarch monitoring at Cape May in 1997 yielded the 5th highest count per hour in the 21year history of that program.
Acknowledgements
I wish to thank Elizabeth Howard of Journey North for allowing me to modify and incorporate first sighting maps in this article. Janis Lentz graciously helped with the weather data, summarized the first sightings data, and calculated the projected degree days for eggs laid on specific dates at each location. Jim Lovett and Ann Ryan once again added their excellent editing touches to the text and compensated for my limited abilities to provide the proper formatting by doing things the right way.
References
Brower, L.P., Kust, D.R., Rendon-Salinas, E., Serrano, E.G., Kust, K.R., Miller, J., Fernandez del Rey, C. & K. Pape, K. (2004) Catastrophic winter storm mortality of monarch butterflies in Mexico in January 2002. Monarch Butterfly Biology and Conservation (ed. by K.M. Oberhauser and M. Solensky), pp. 151-166. Cornell University Press, Ithaca, New York.
Brower, L.P., Taylor, O.R. & Williams, E.H. (2011b) Response to Davis: choosing relevant evidence to assess monarch population trends. Insect Conservation and Diversity. doi: 10.1111/ j.1752-4598.2011.00176.x
Brower, L.P., Taylor, O.R., Williams, E.H., Slayback, D.A., Zu- bieta, R.R. & Ramirez, M.I. (2011a) Decline of monarch butterflies overwintering in Mexico: is the migratory phenomenon at risk? Insect Conservation and Diversity. doi: 10.1111/j.1752- 4598.2011.00142.x.
Howard, E. and A. K. Davis (2004) Documenting the spring movements of monarch butterflies with Journey North, a citizen science program. Monarch Butterfly Biology and Conservation (ed. by K.M. Oberhauser and M. Solensky), pp. 105-114. Cornell University Press, Ithaca, New York.
Pleasants, J. M. and K.S. Oberhauser (2012) Milkweed loss in agricultural fields because of herbicide use: effect on the monarch butterfly population. Insect Conservation and Diversity (2012) doi: 10.1111/j.1752-4598.
Barve, V., O.R. Taylor, J. Lentz and E. Howard (2012) Monarch population Dynamics: The relationship of temperature to patterns of recolonization by monarchs returning from Mexico. Monarch Biology and Conservation Meeting: Minnesota 2012 (Presentation by Vijay Barve)
Taylor, O. R. (2012) Conservation and restoration of monarch butterfly habitats. Monarch Biology and Conservation Meeting: Minnesota 2012 (Presentation by O. R. Taylor)
Zalucki, M.P. (1982) Temperature and the rate of development in two species of Danaus, D. plexippus and D. chrysippus. J. Aust. Entomol. 21:241-246.


One Response to “Monarch Population Status”
By Dave Kust on Jun 5, 2013
Enjoyed reading this article, Chip. Not only are we enduring a cooler, more rainy spring than usual here in Mpls, MN, it was reported that we have had only 15 DAYS OF SUN since meteorological spring began in March! We miss the sun as much as the monarchs do! Still waiting to make my first sighting and it’s already June 5….maybe this weekend, as sunny and 70s are finally being forecast!